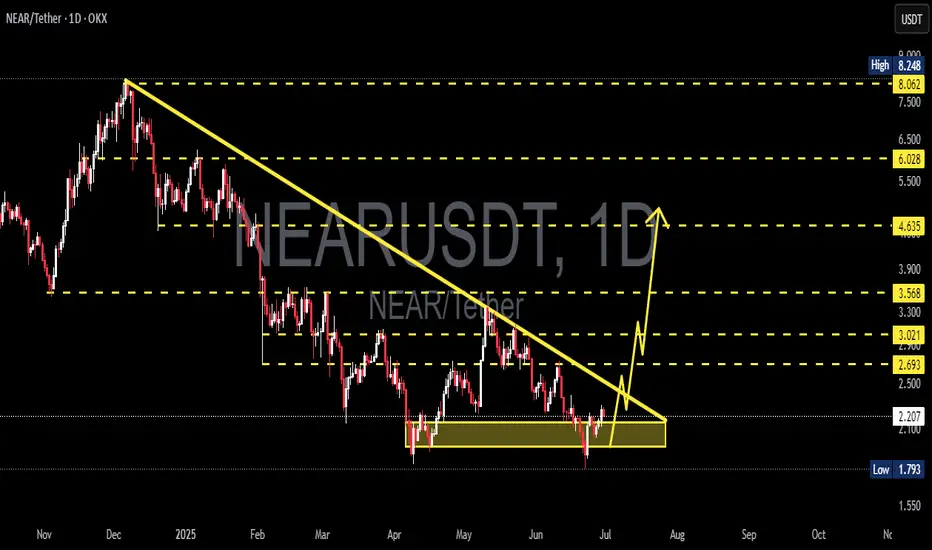
NEARUSDT Breakout Watch Descending Triangle Reversal in Progress🧠 Pattern and Structure Analysis
The NEAR/USDT pair is currently displaying a long-term Descending Triangle pattern that has been developing for over 6 months. While descending triangles are typically bearish continuation patterns, a breakout to the upside often signals a strong trend reversal.
De
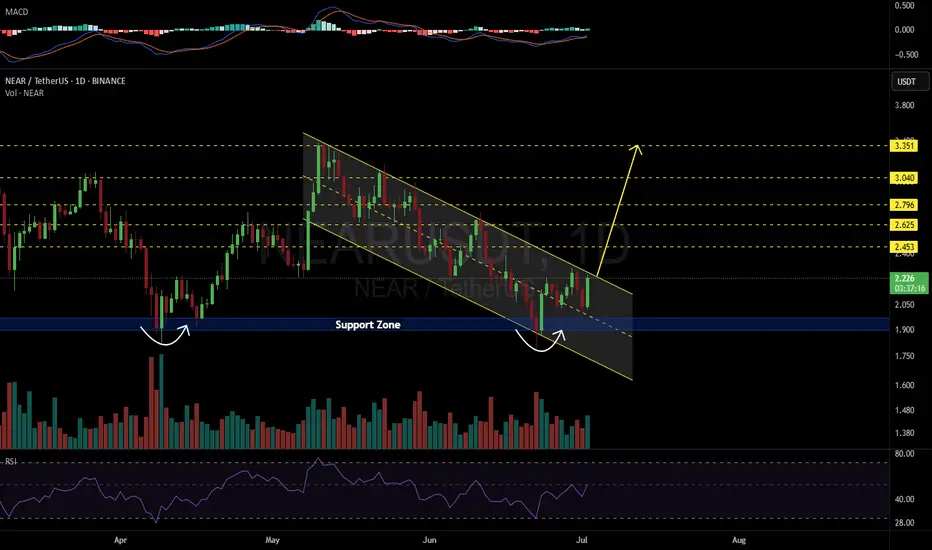
NEARUSDT 1D#NEAR is trading inside a descending channel on the daily chart and has recently bounced off a strong support zone.
It’s now on the verge of breaking above the channel resistance.
If a breakout occurs, the next targets are:
🎯 $2.453
🎯 $2.625
🎯 $2.796
🎯 $3.040
🎯 $3.351
⚠️ As always, use a tight st
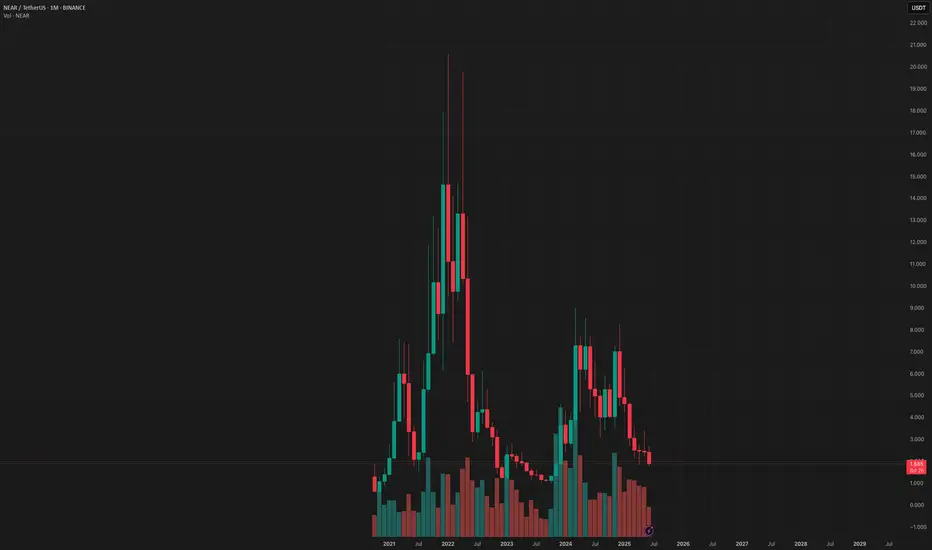
YOLO Near USDT is a stellar buy here HUGE UPSIDELast cycle we saw a large correction to these levels before seeing a huge altcoin season. I believe we will see another run this cycle.
Near is a entry between $1.90 and 1.60.
Sell targets 8 20% sell
$12 20% sell
$16 20% sell
$20 20% sell
20% sell: Let it rideeeee to euphoria
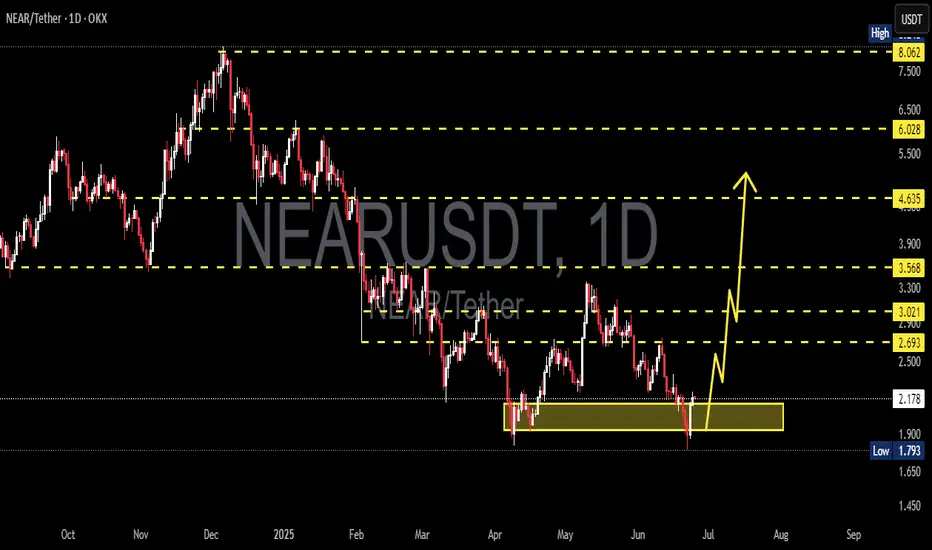
NEARUSDT 1D AnalysisNEAR ~ 1D Analysis
#NEAR Buy back on retest of this support block with short term target of at least 15%+ from here.
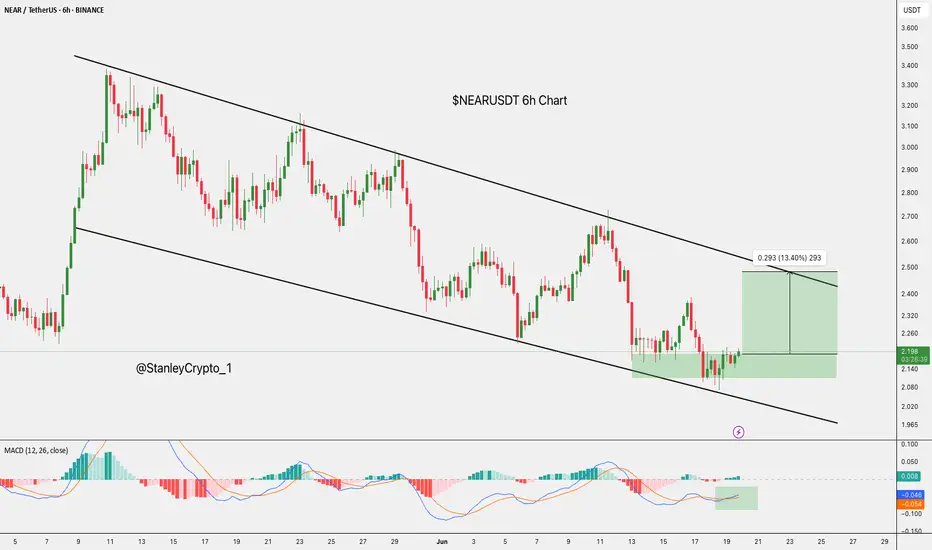
Descending Channel Breakout Ahead for $NEARUSDTCBOE:NEAR is trading in a descending channel on the 6H chart.
After bouncing from $2.140 support, it’s showing signs of a short-term recovery, with a target of $2.50, 13.40%.
MACD crossover supports bullish momentum.
Holding support is key, or the downtrend continues.
DYRO, NFA
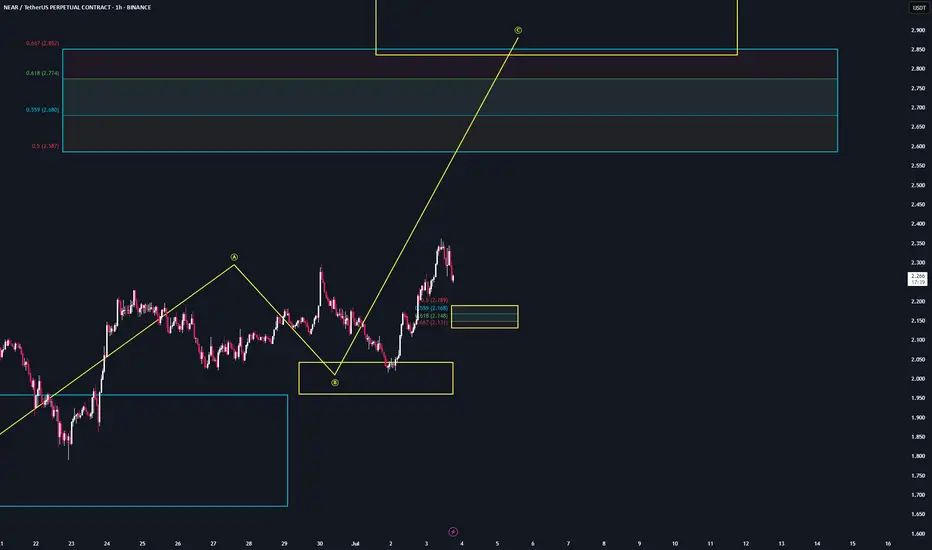
NEAR | Trade Setup📌 After the reaction from the bearish target zones (blue), we've now activated a bullish sequence (yellow) in $Near.
📊 Valid entries are currently forming during a potential B-C correction.
Trademanagement:
I'm placing long orders at each level.
Once the trade reaches a 2 R/R, I’ll move the stop-
$NEAR Approaching Breakout from 54D Trendline!CBOE:NEAR
In the LTF, CBOE:NEAR is sitting at the 0.5 Fib retracement level.
Which is a pretty good level to buy.
We have a 54D long descending trendline resistance, which we need to break out of.
IMO, we will break this trendline soon, so keep an eye on it.
We have strong support at the $1.

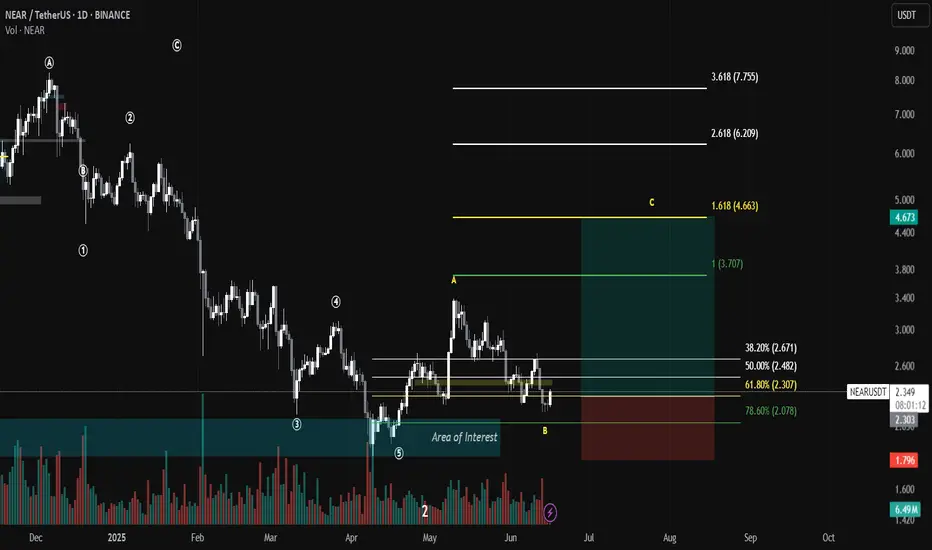
NEAR/USDT trade plan🧠 NEAR/USDT – Potential Wave C Setup (Elliott Wave + Fib Confluence)
📆 Timeframe: 1D | Exchange: BINANCE
🚀 Setup Overview:
We are likely entering a bullish Wave C based on the completion of an ABC corrective structure within a larger Elliott Wave pattern. The current price action has pulled back in
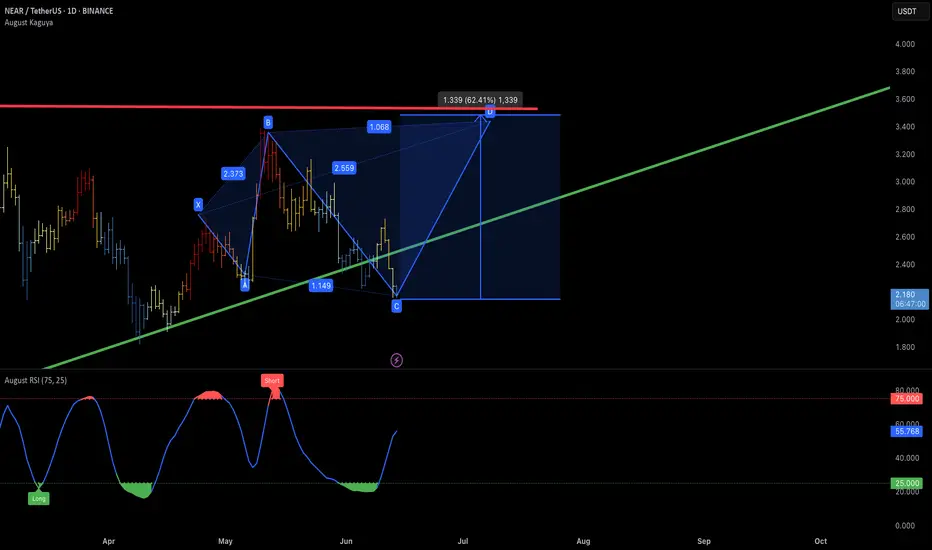
Long Setup on NEAR/USDTBullish harmonic pattern forming with confluence on the rising trendline and fib levels. Currently at point C, expecting a potential move toward point D.
📌 Entry: ~2.18 (current price, near C-zone)
🎯 Take Profits:
TP1: 2.55 (minor structure)
TP2: 2.85 (golden fib extension)
TP3: 3.20
TP4: 3.60 (ma
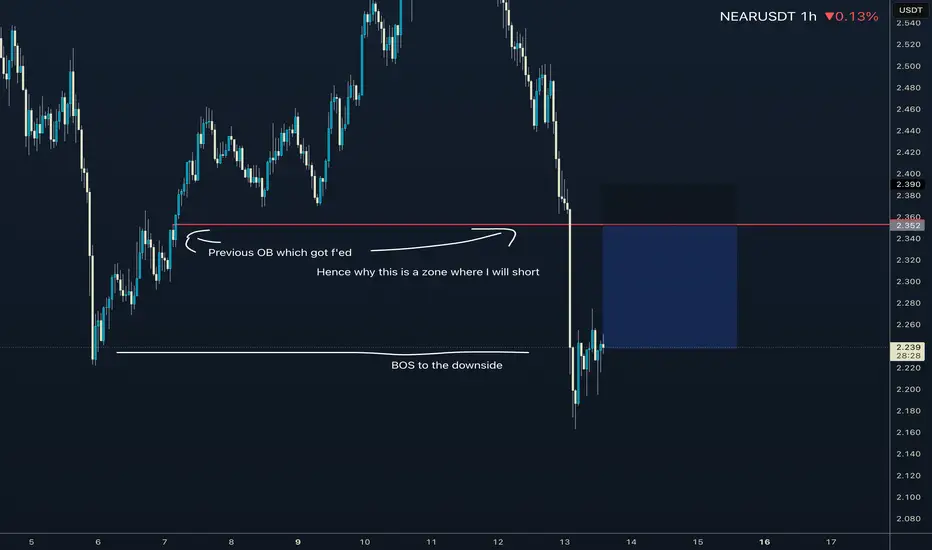
NEAR shortAs you can see on the chart NEAR has broken to the downside as multiple hourly candles have closed below previous swing lows.
I have identified an untapped OB which I will utilize for my zone to short.
Use max 5-8x leverage.
Good luck
See all ideas
Summarizing what the indicators are suggesting.
Oscillators
Neutral
SellBuy
Strong sellStrong buy
Strong sellSellNeutralBuyStrong buy
Oscillators
Neutral
SellBuy
Strong sellStrong buy
Strong sellSellNeutralBuyStrong buy
Summary
Neutral
SellBuy
Strong sellStrong buy
Strong sellSellNeutralBuyStrong buy
Summary
Neutral
SellBuy
Strong sellStrong buy
Strong sellSellNeutralBuyStrong buy
Summary
Neutral
SellBuy
Strong sellStrong buy
Strong sellSellNeutralBuyStrong buy
Moving Averages
Neutral
SellBuy
Strong sellStrong buy
Strong sellSellNeutralBuyStrong buy
Moving Averages
Neutral
SellBuy
Strong sellStrong buy
Strong sellSellNeutralBuyStrong buy
Displays a symbol's price movements over previous years to identify recurring trends.
Curated watchlists where NEARUSDT.PS is featured.

Gen 3 crypto: A new day dawns…
25 No. of Symbols

Smart contracts: Make the smart decision
36 No. of Symbols
See all sparks