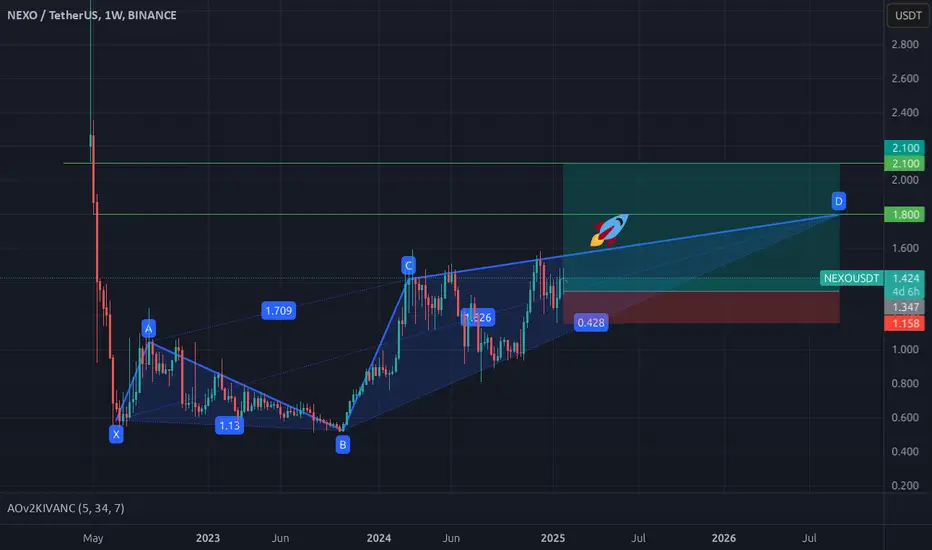
Technical Analysis of NEXO/USDT (Weekly Timeframe)Pattern and Structure:
The chart displays a harmonic pattern, possibly a Gartley or Bat formation, with the key points X, A, B, C, and D marked.
A broadening wedge (or expanding triangle) is also forming, showing increasing volatility.
Key Price Levels
Current Price: $1.423
Resistance Zone: $1
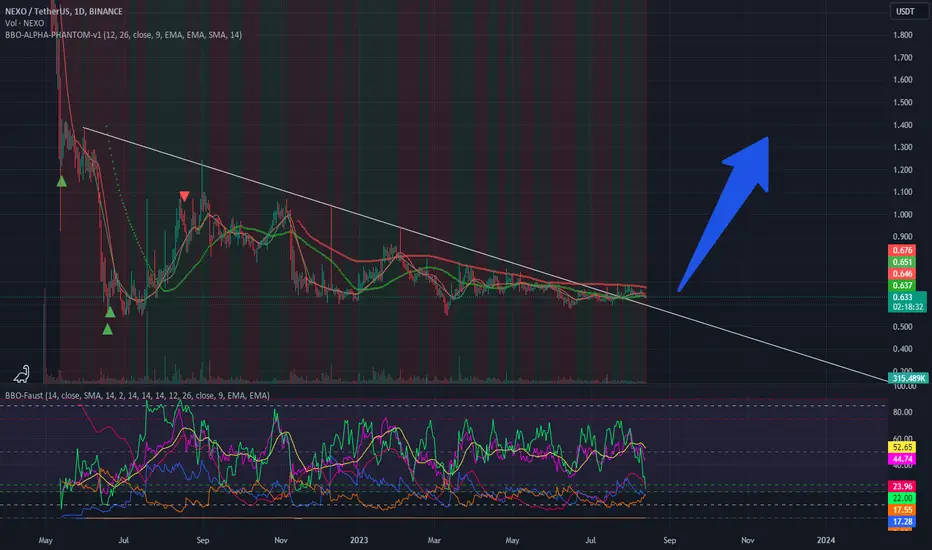
NEXO Cup and Handle PatternNEXO looks very good to breakout of the Cup and Handle pattern which is very visible on the 1week and 1month TF. Price is above the 20 MA on the Weekly TF.
It has been trending for awhile now but it's yet to make a big move. Cup and Handle breakout is always big.

TradeCityPro | Navigating NEXO's Financial Waters👋 Welcome to TradeCityPro!
In this analysis, I want to discuss the NEXO coin for you. The NEXO project is a payment platform. This coin has always had issues with the US government and has been involved in several legal cases, but now, with Trump as president, it's experiencing a more relaxed envir

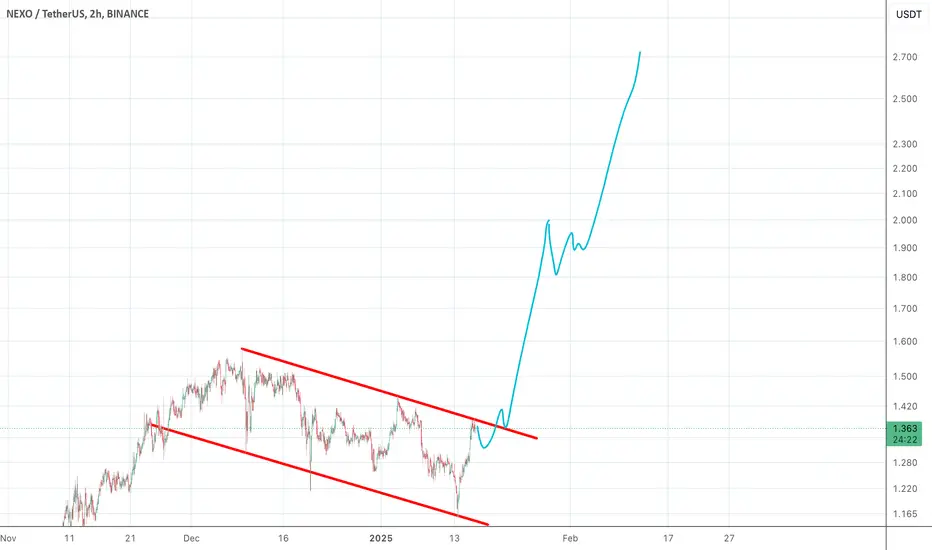
NEXO breaking outNexo the only lending platform to survive the 2021 collapse. Very strong momentum, lots of new features released and trust from its customers.
Gossip is: they are coming back to the US market.
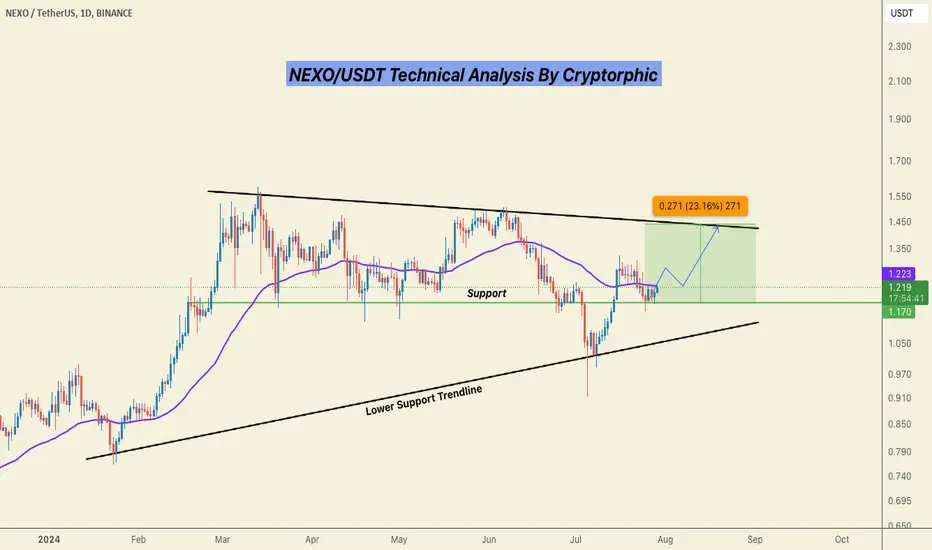
NEXO Technical Analysis in Daily TimeframeHello everyone, I’m Cryptorphic.
For the past seven years, I’ve been sharing insightful charts and analysis.
Follow me for:
~ Unbiased analyses on trending altcoins.
~ Identifying altcoins with 10x-50x potential.
~ Futures trade setups.
~ Daily updates on Bitcoin and Ethereum.
~ High time frame (H
NEXO/USDT I BUY SETUP✔︎📈 BINANCE:NEXOUSDT SIGNAL
✔︎ENTRY : 1.462
🏓TARGETS :
✔︎ T1 : 1.660
✔︎ T2 : 1.859
✔︎ T3 : 2.103
✔︎ Long term T4 - T5
✘ STOP : 1.360
🚦Stop Trigger:
• If you make capital management: Stop is activated when one candle opening and closing
below the stop level of the same time frame of the signal.

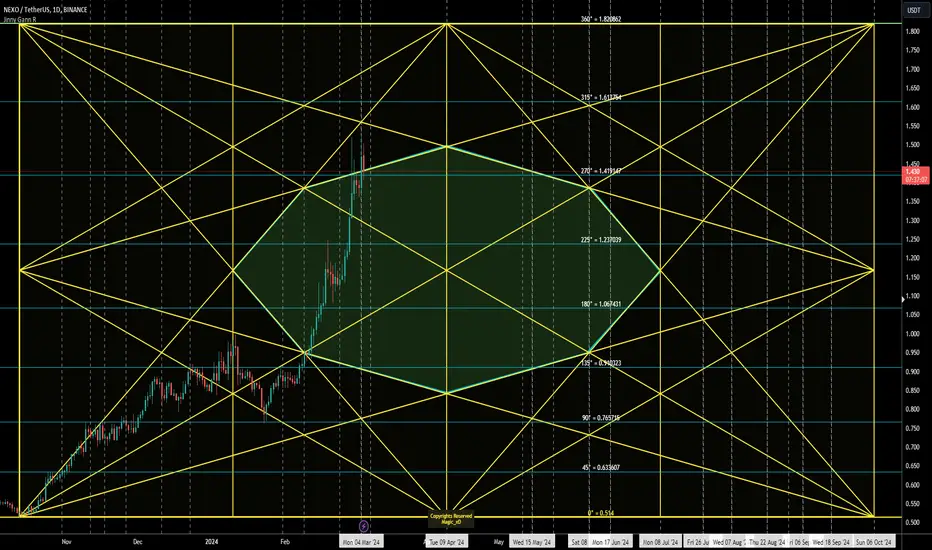
Nexo - Jinny Gann levels / StarNexo Reversal dates on chart
Expected Cycle top @ 1.82
horizontal lines are Support/Resistance .
Vertical lines are time pivots .
The most accurate Gann tools here.
Jinny Gann
Appreciate your Comments.
GL
NEXO on its way to $3I tentatively assume that we will reach $1.3 with NEXO, then around $3, and if successful, a peak around $4
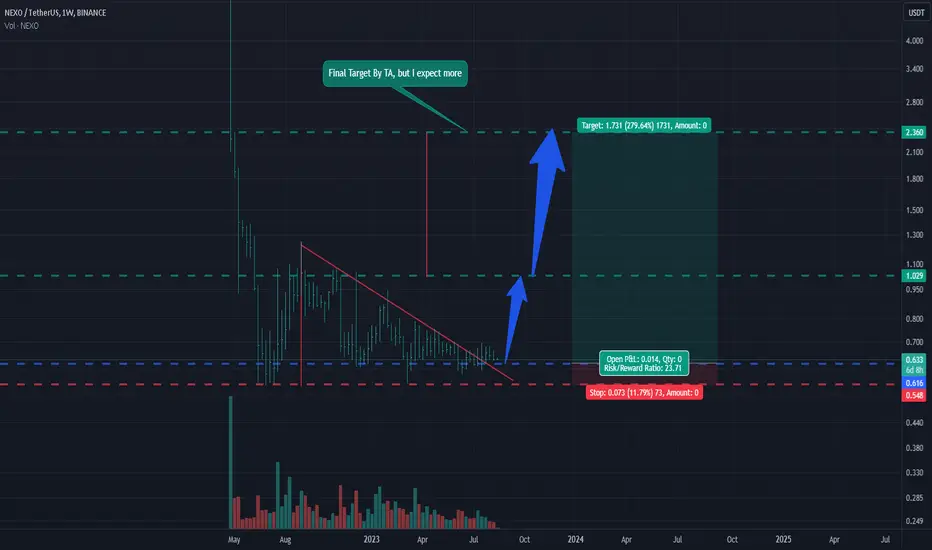
Nexo showing a very professional Accumulation phase Hi Everyone;
today we have one of the Interesting coin.. NEXO
My TA showing almost 23 Risk to rewards, but looking to the accumulation phase I expect more than that, let's give it a chance.
#NEXO/USDT - Long - Potential 21.68%
Strategy: Long
Exchange: BYBIT
Account: Spot
Entry mode: Market order in range
Invest: 5%
Exit:
• Target 2 : 1.1 20.32%
• Target 1 : 1.012 11.72%
Entry: 0.9142 ⌁ 0.9142
• Current market price: 0.9142
• Stop: 0.812 (-11.18%)
Technical indicators:
Resistance break in confirmed uptrend. Dip into l

See all ideas
Summarizing what the indicators are suggesting.
Oscillators
Neutral
SellBuy
Strong sellStrong buy
Strong sellSellNeutralBuyStrong buy
Oscillators
Neutral
SellBuy
Strong sellStrong buy
Strong sellSellNeutralBuyStrong buy
Summary
Neutral
SellBuy
Strong sellStrong buy
Strong sellSellNeutralBuyStrong buy
Summary
Neutral
SellBuy
Strong sellStrong buy
Strong sellSellNeutralBuyStrong buy
Summary
Neutral
SellBuy
Strong sellStrong buy
Strong sellSellNeutralBuyStrong buy
Moving Averages
Neutral
SellBuy
Strong sellStrong buy
Strong sellSellNeutralBuyStrong buy
Moving Averages
Neutral
SellBuy
Strong sellStrong buy
Strong sellSellNeutralBuyStrong buy
Displays a symbol's price movements over previous years to identify recurring trends.