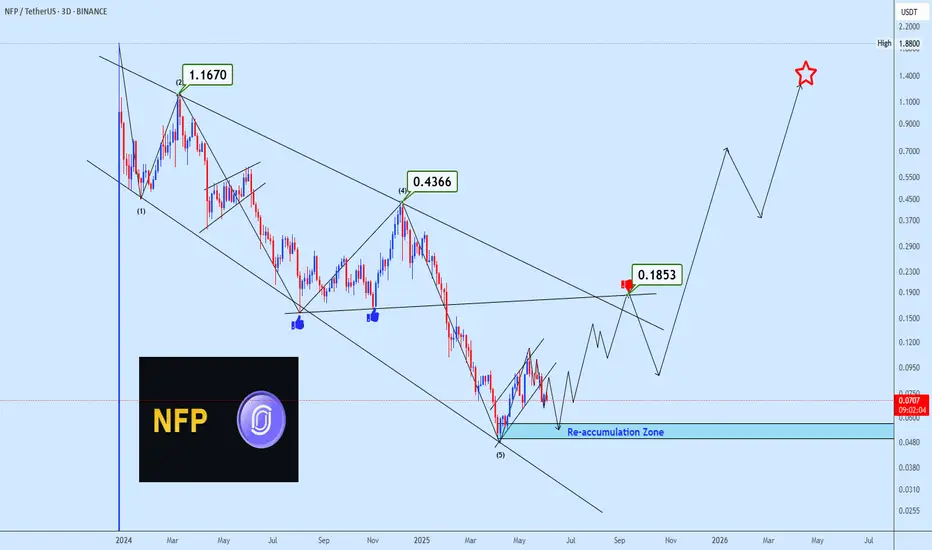
NFPUSDT Bottoming Out for a Major Reversal?After completing a 5-wave bearish cycle within a descending broadening wedge, NFP is now trading within a key re-accumulation zone, suggesting a potential macro reversal is forming. The price recently rejected from the $0.1133 resistance and may continue consolidating before initiating a bullish leg
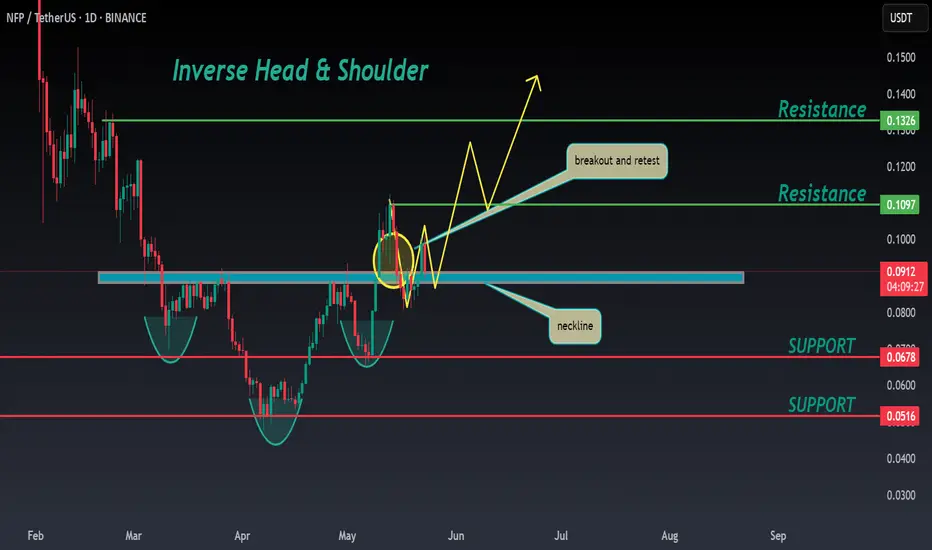
NFP ANALYSIS🚀#NFP Analysis : Pattern Formation💲💲
🔮As we can see in the chart of #NFP that there is a formation inverse head and shoulder pattern and it's a bullish pattern. Also there is a perfect breakout and retest of the levels. This indicates a potential bullish move.📈📈
🔰Current Price: $0.0910
🎯 Target
$NFP – Ascending Channel in Play📈 NEWCONNECT:NFP – Channel Watch
🗓 On the daily timeframe, NEWCONNECT:NFP is trending within an ascending channel and is currently testing the mid-level support/resistance 🔄
🛡 If this zone holds, bulls could drive price toward the upper boundary of the channel 🎯
📊 Structure remains intact — a

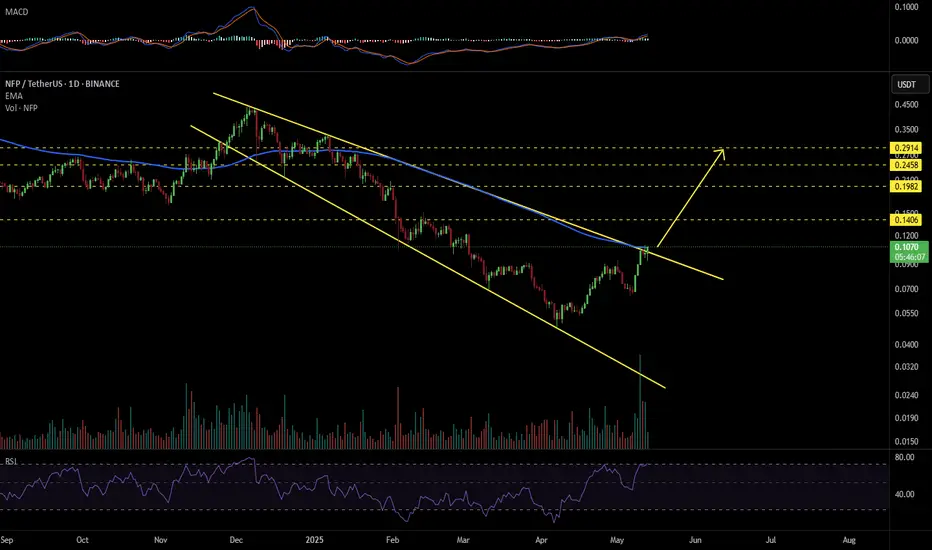
NFPUSDT 1D#NFP is breaking out above the descending broadening wedge pattern on the daily chart. In case of a successful retest of the pattern and breakout above the EMA100, the targets are:
🎯 $0.1406
🎯 $0.1982
🎯 $0.2458
🎯 $0.2914
⚠️ Use a tight stop-loss.
NFP breakout soon!!!#NFP Buy gradually from here or wait for breaking through this resistance line with a short-term target of at least 10%+.

NFPUSDT 1D Analysis NFP ~ 1D Analysis
#NFP On the verge of a breakout. Buy after successfully breaking this resistance line with a short term target of at least 10%+ from here.

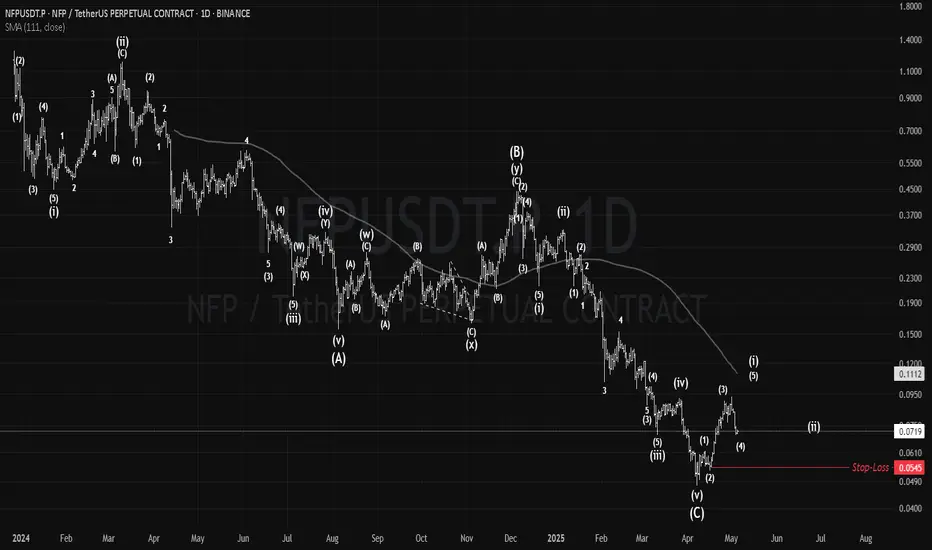
NFP: A Hidden Gem?#NFP has crashed over -95% since its late 2023 listing.
However, the rebound it had last month may signal the end of the downtrend.
Holding above $0.0545 (stop-loss) is crucial to avoid new ATLs and to validate a potential bullish reversal targeting higher levels.
#NFPrompt
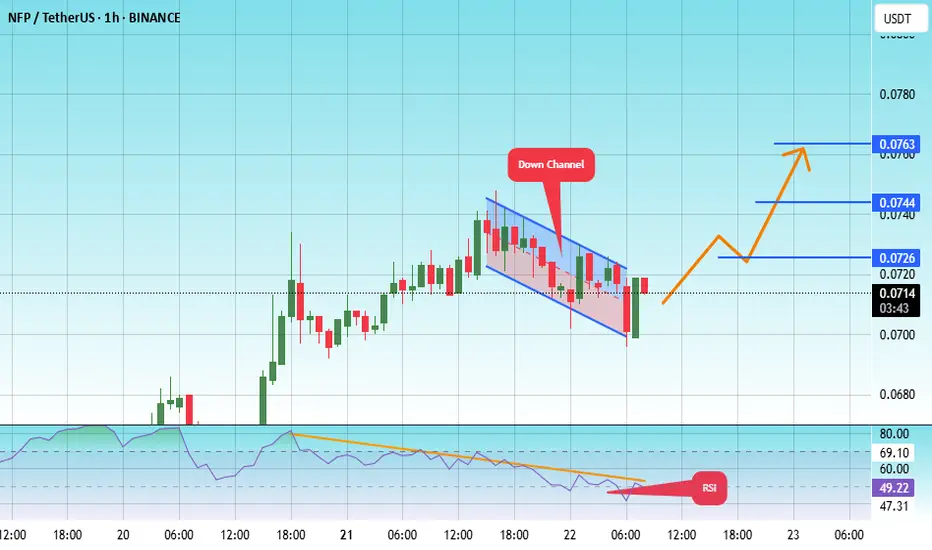
#NFP/USDT#NFP
The price is moving within a descending channel on the 1-hour frame, adhering well to it, and is heading for a strong breakout and retest.
We are seeing a bounce from the lower boundary of the descending channel, which is support at 0.0700.
We have a downtrend on the RSI indicator that is abo
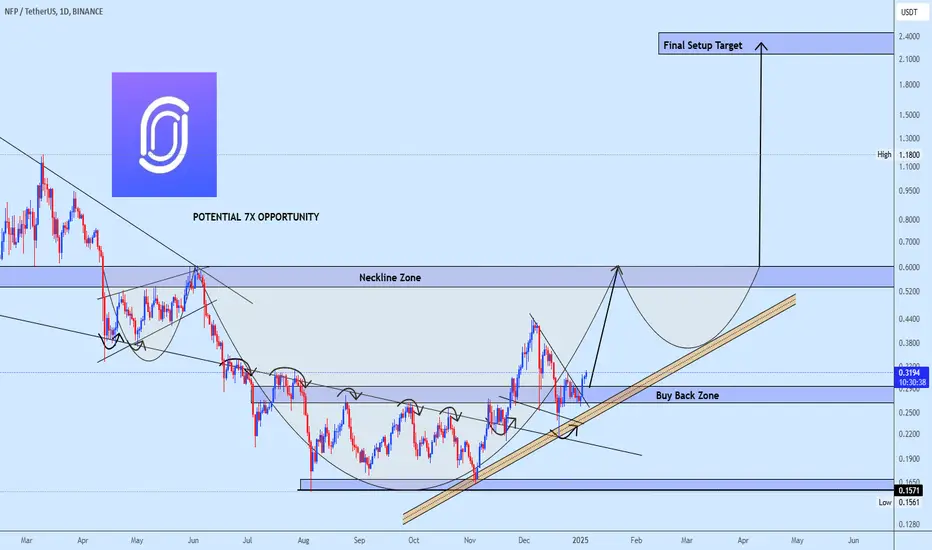
NFPUSDT with potential 7x opportunityNFP/USDT has established a solid bottom, with the price consistently respecting the dynamic trendline, signaling strong support. This structure suggests the potential formation of an Inverse Head and Shoulders (ISHS) pattern, a classic bullish reversal setup.
The neckline, which serves as the imme
NFP Roadmap (1D)It seems that the NFP has entered a corrective phase from the point where we placed the red arrow on the chart.
Currently, it appears to be in the bearish wave C of this phase, and wave C itself is a symmetrical pattern. At the moment, we are in wave g of this symmetrical pattern.
This symmetrical

See all ideas
Summarizing what the indicators are suggesting.
Oscillators
Neutral
SellBuy
Strong sellStrong buy
Strong sellSellNeutralBuyStrong buy
Oscillators
Neutral
SellBuy
Strong sellStrong buy
Strong sellSellNeutralBuyStrong buy
Summary
Neutral
SellBuy
Strong sellStrong buy
Strong sellSellNeutralBuyStrong buy
Summary
Neutral
SellBuy
Strong sellStrong buy
Strong sellSellNeutralBuyStrong buy
Summary
Neutral
SellBuy
Strong sellStrong buy
Strong sellSellNeutralBuyStrong buy
Moving Averages
Neutral
SellBuy
Strong sellStrong buy
Strong sellSellNeutralBuyStrong buy
Moving Averages
Neutral
SellBuy
Strong sellStrong buy
Strong sellSellNeutralBuyStrong buy
Displays a symbol's price movements over previous years to identify recurring trends.