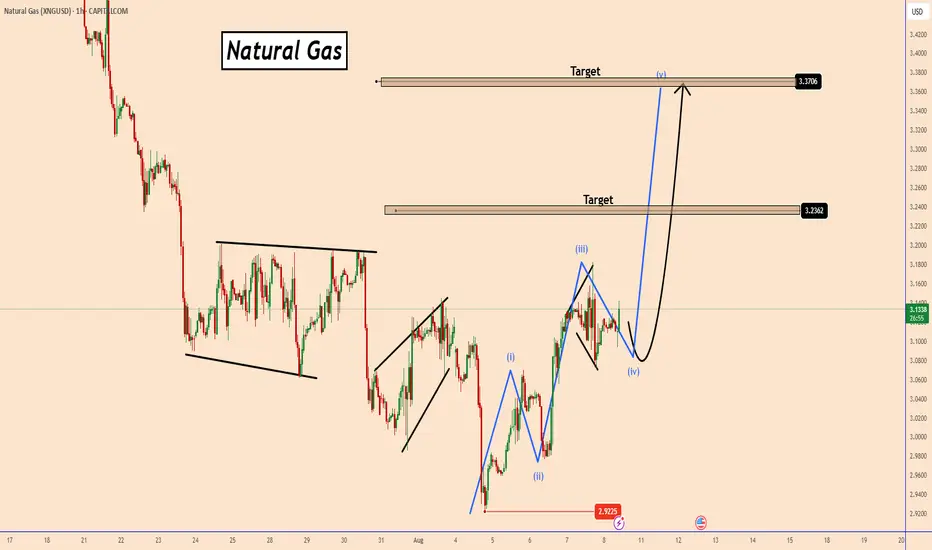
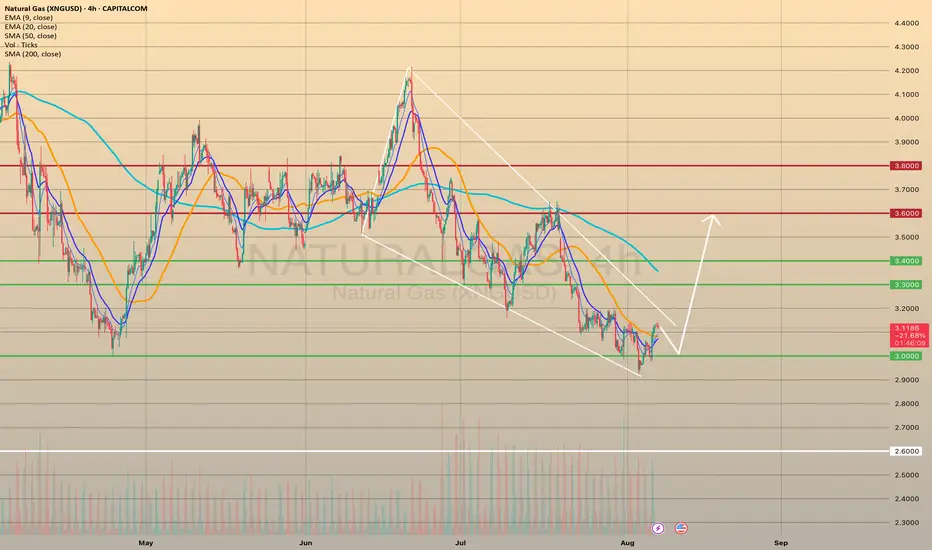
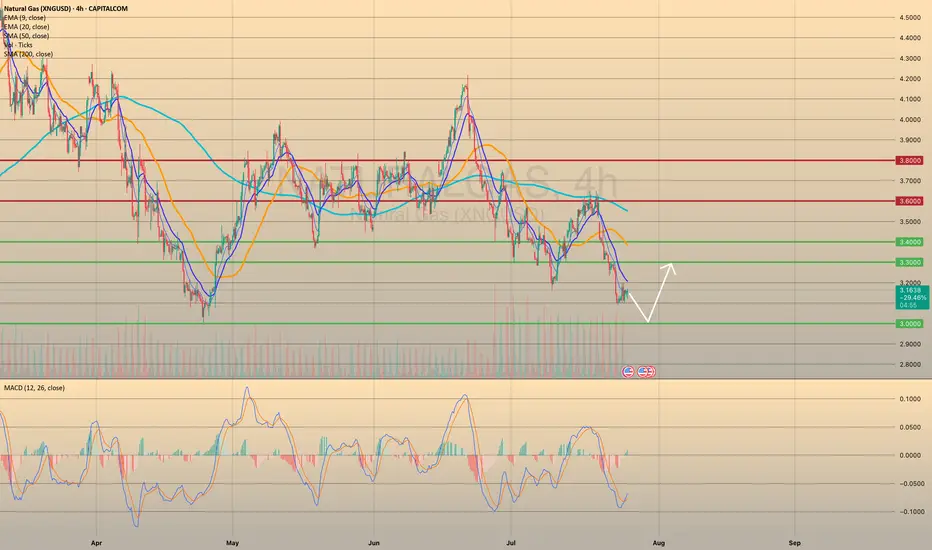
Natural Gas Shows Signs of Bullish Wave CompletionNatural Gas Shows Signs of Bullish Wave Completion
Natural gas is struggling to drop below 2.92, which could mean the current bullish wave is coming to an end.
Since NG is moving in a clear correction, we might be in the 5th wave—this could either be the start of a larger bullish move or part of a corrective pattern.
Looking at how the price has moved in the past, I believe it's more likely that a bullish wave is forming and could continue into next week.
For now, I’m watching two short-term targets at 3.23 and 3.37.
You may find more details in the chart!
Thank you and Good Luck!
PS: Please support with a like or comment if you find this analysis useful for your trading day
NG trade ideas
Natural Gas is in the Buying DirectionHello Traders
In This Chart NATGAS HOURLY Forex Forecast By FOREX PLANET
today NATGAS analysis 👆
🟢This Chart includes_ (NATGAS market update)
🟢What is The Next Opportunity on NATGAS Market
🟢how to Enter to the Valid Entry With Assurance Profit
This CHART is For Trader's that Want to Improve Their Technical Analysis Skills and Their Trading By Understanding How To Analyze The Market Using Multiple Timeframes and Understanding The Bigger Picture on the Charts

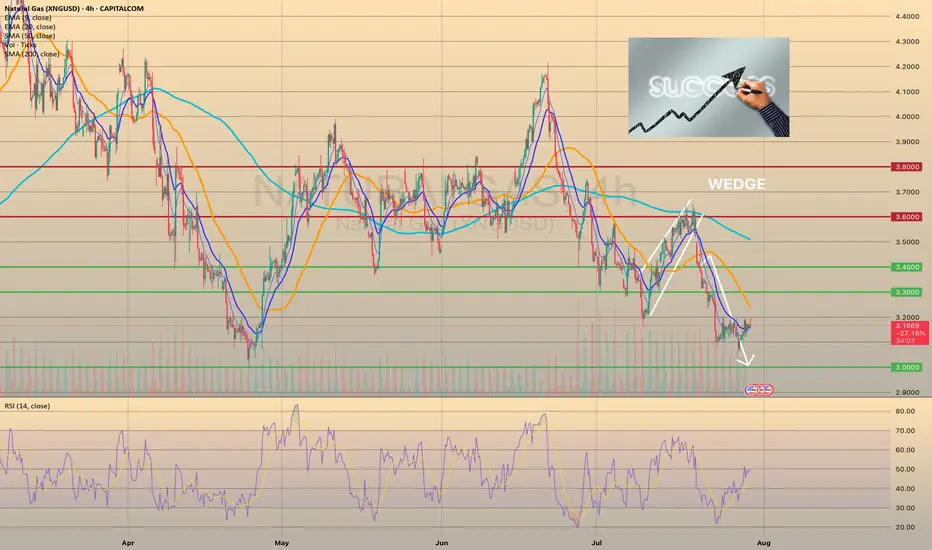
Natural Gas XNG: Trend Reversal or Just a Retracement?Natural Gas (XNG) has been trending bearish 🔻, but we’re now witnessing a bullish market structure shift ⚡— particularly visible on the 4H timeframe ⏱️. At present, price is overextended and pressing into a key resistance zone 📈🧱. I’m watching closely for a retracement back into equilibrium 🔄 within the previous price swing. This could offer a short-term scalp or day trade short setup 🎯.
Should price hold firm at support after the pullback 🛑, we could then begin building a bullish bias and look for long opportunities 📊— depending on how price action develops from there. 🚨 This is not financial advice.

Natural Gas Prices Fall to Yearly LowNatural Gas Prices Fall to Yearly Low
Analysing the chart on 22 July, we constructed a descending channel and assumed that natural gas prices would continue to form a bearish market structure of lower highs and lower lows. Since then, the market has declined by almost 10%.
As the XNG/USD chart shows today, natural gas prices are hovering around the psychological level of $3.000/MMBtu. Earlier this week, gas was trading around $2.940/MMBtu — the lowest level of 2025.
According to media reports, the price decline is driven by both high production levels and favourable weather forecasts for August, the hottest month of the year. What might happen next?
Technical Analysis of the XNG/USD Chart
We have updated the descending channel, taking into account the recent fluctuations in natural gas prices.
The chart shows that bearish momentum remains intact — the rise from point B to C appears to be a corrective rebound within the prevailing downward trend, with the following developments:
→ point C formed in the 0.5–0.618 area, which corresponds to classic Fibonacci retracement levels following the A→B impulse;
→ the former support at 0.365 has now become resistance.
Bulls may hope that the current sentiment could shift following tomorrow’s natural gas storage report (scheduled for 17:30 GMT+3). A drop in inventories could potentially trigger a bullish impulse on the XNG/USD chart.
This article represents the opinion of the Companies operating under the FXOpen brand only. It is not to be construed as an offer, solicitation, or recommendation with respect to products and services provided by the Companies operating under the FXOpen brand, nor is it to be considered financial advice.
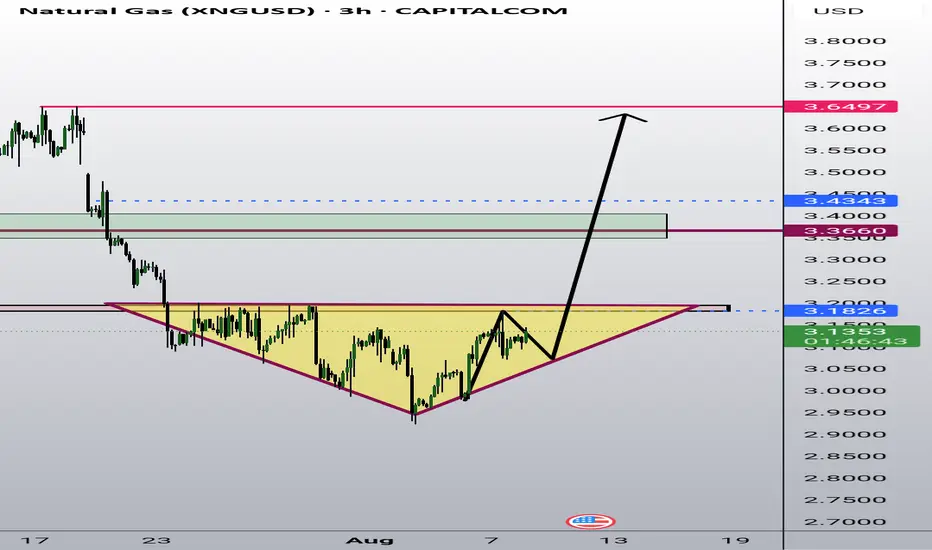
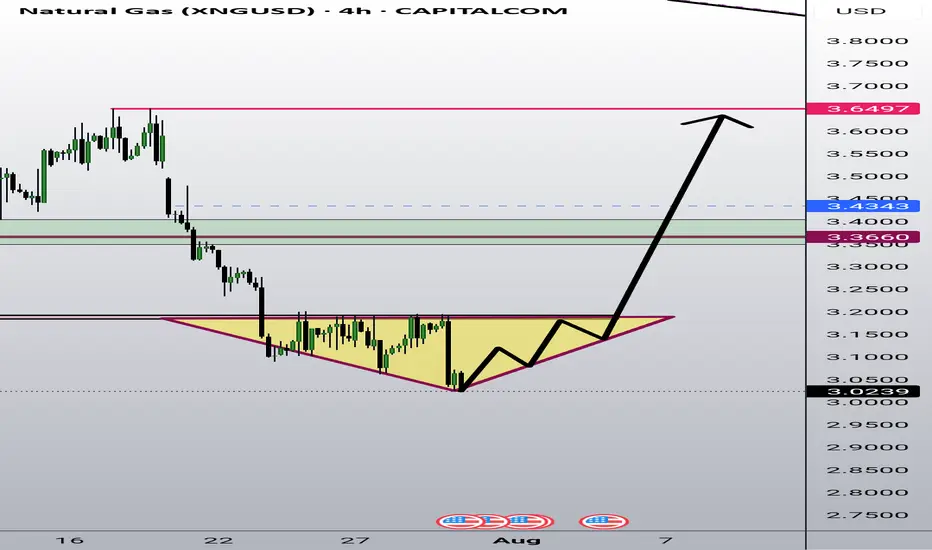
Natural Gas is getting ready for Spike moveFollowup for Prvious published idea 31 July
Natural Gas well fitted in Diamond pattern satisfied all its characteristics
Breakout can happen by gapup opening on Monday
Now atleast for next all temperature are look positive
Natural Gas spotBullish Crab pattern may form, but over all sell on rally as ichimoku cloud break in weekly but fallen too much so need to be careful. Level of crab pattern completion spotted in chart.

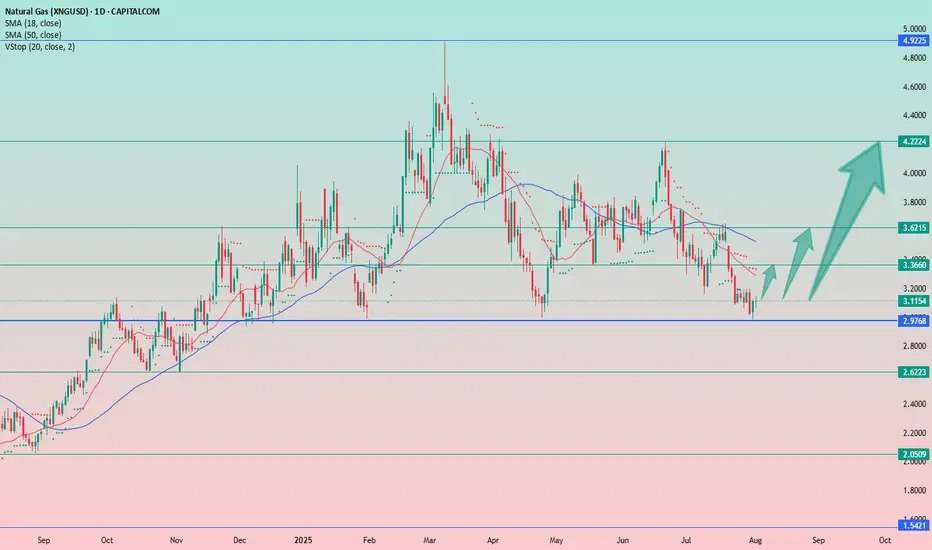
U.S. Hot temperature boosted natural gas prices. For how long?U.S. Hot temperature boosted natural gas prices. For how long?
U.S. natural gas futures rose ~2% August 6 due to near-record LNG export flows and forecasts of hotter-than-normal weather through late August, boosting air conditioning demand and gas use by power plants (over 40% of U.S. electricity). Despite a hot summer, record production has kept gas stockpiles ~6% above normal, with storage likely to grow further.
Technically, price seems to form bullish wedge since mid - August. Price successfully tested the level of 3.0000, still can go on a retest of this level soon once again before some mid-term bullish momentum occurs. Additionally, according to seasonals, since the second half of the august, natural gas prices go bullish due to the beginning of the shoulder season.
Natural Gas Bullish Recovery?Nat gas has recovered key technical levels with a strong rally today.
Looking at the daily chart we got a close above the 7 MA staging a potential 3 bar surge setup.
Nat gas looks to be targeting 3.18 in the near term...
Inventory report tomorrow: 10B forecast for inventories.
A potential arbitrage opportunity setting up for EQT, upside calls for next week.

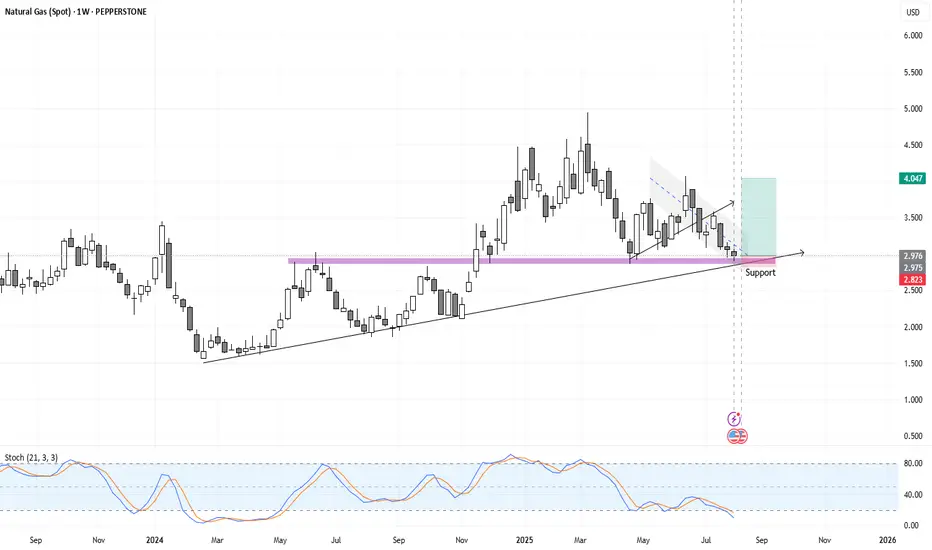
NATGASThis weekly chart of Natural Gas (Spot) shows the price currently trading around 2.976 USD, sitting directly on a long-term ascending trendline and a horizontal support zone near 2.82–2.85 USD. The support has been tested multiple times in the past, reinforcing its importance as a key demand area. The stochastic oscillator at the bottom is deep in the oversold region, hinting at potential reversal conditions.
The recent candles show a downtrend channel that has just been broken to the upside, suggesting the possibility of a trend change. A highlighted green box indicates the potential upside target area around 4.04 USD if the rebound from support continues. This aligns with a technical bounce expectation after prolonged downside pressure.
Overall, the chart implies a bullish short-to-medium-term outlook if the support holds. A break below the ascending trendline would invalidate this scenario and could trigger deeper declines. However, with strong confluence of trendline, horizontal support, and oversold momentum, the probability of an upward move appears favorable.
Sell NATGAS into OCT/NOVNatalie has fromed a H&S and has broke through all of the supporting EMAs leading to most of the indicators turning bearish.
My approach for the forseeable is seeling bounces until the winter season approaches.
Of course Natalie is extremely susceptible to trend changes due to economical data and has to be monitored closely. Currenlty I'm a bear.
Only selling once it breaks and retests, where I will once again reasses based on economics such as storage, production, imports and demand.
Target around $2.5 where interestingly a gap (red rectangle) sits from Nov - 24.
Elliot Wave (although not a great fan) kind of aligns as well as the 0.786 fib level which began forming at the beginning of 2024.
Storage | Volatility | Price Outlook
U.S. natural gas markets are stabilizing as volatility trends back toward seasonal norms.
📉 Volatility has dropped from 81% in Q4 2024 to 69% in mid-2025
🏪 Storage is currently at 3,075 Bcf,
🔻 4.7% lower YoY
🔺 5.9% higher than the 5-year average
🚢 LNG exports remain strong—up 22% YoY and 74% above the 5-year average
🔌 Domestic demand is seasonally weaker but steady
➡️ Despite being below last year’s levels, storage surplus vs. the 5-year average acts as a soft ceiling on price.
➡️ Historical analogs suggest a fair value range between $2.50–$3.20/MMBtu in the short term.
📊 Current price action around $3.00–$3.40 looks slightly overheated unless a fresh catalyst emerges (heatwave, export spike, etc.).
🧭 Watching for:
Injection trends over the next few weeks
Cooling demand in power sector
Resistance around $3.40
Support near $2.80

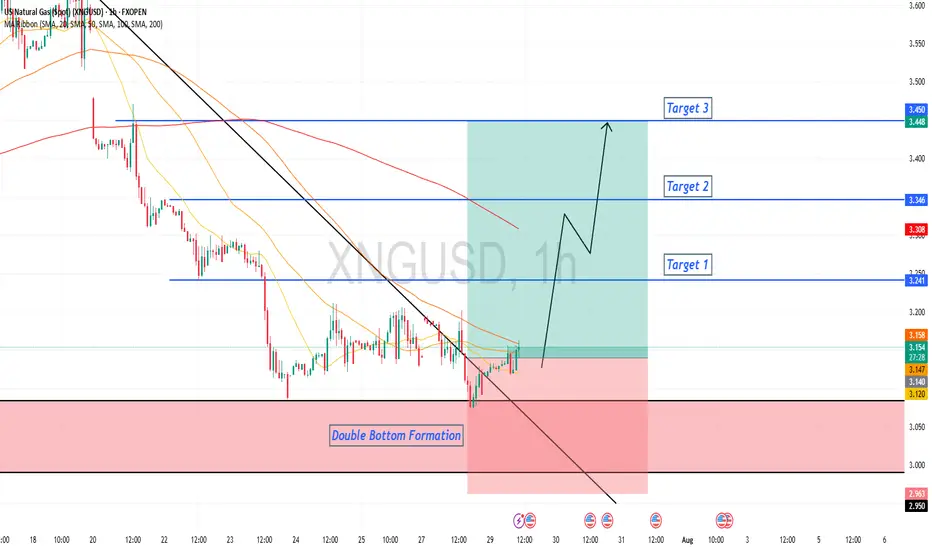
Natgas - At support zone2 hr chart. natgas in support zone. Longs can be tried with appropriate SL as per appetite
Shorts should definitely be cautious here. trading longs , short term trade

Natural Gas SpotFormed Gartley though break 0.786 ratio but allowed upto starting point , also forming ABCD pattern, appear ib wave B or X later will decide b or X which wave . Let see. I am not SEBI registered analyst, this is not buy , sell , hold recommendation. Only personal view for educational purpose. Thanz. if goes wrong no offence.

Natural Gas Rebounds from Key SupportNatural gas has bounced off its strong support level and is showing signs of upward movement, particularly evident on the hourly chart. Dips are being bought up, with the price quickly returning to previous levels.
Downsides: The downtrend is still in place (though it may potentially be broken), and there's a relatively long stop-loss below yesterday’s candle low at 2.98.
📝Trading Plan
Entry: buying gold at the current level
Stop Loss: 2.98
Target: 3.36, 3.62, and 4.20.
Natural GasBearish bat pattern formed though first target achieved not able to post on time when detected but still there is room and also wave B may be folding and moving for wave C new low possible but time wise still one up may come but that possibly be selling opportunity.

Natural Gas Bullish Reversal...Are the Lows in?U.S. natural gas inventories increased by 48 billion cubic feet last week to 3,123 Bcf, increasing the surplus over the five-year average.
Consensus / forecast was 37Billion Cubic feet.
Despite a much higher build than expected Nat gas saw positive price action.
This appears to simply be a dead cat bounce before we go lower.
A death cross on the daily chart has occurred. This signal often results in a small bounce before going lower.

XNGUSD CONTINUES ITS DOWNWARD TREND. FOR HOW LONG?XNGUSD CONTINUES ITS DOWNWARD TREND. FOR HOW LONG?
Recent bearish impulse started at the beginning of this week may come to an end soon. Yesterday the U.S. Natural Gas Storage report came out. Numbers appeared to be lower than expected and lower than previous. (23b vs 28b vs 46b). This is bullish signal for the market participants. Minutes after the report came out, market reacted bullish, however, soon price went sideways.
Right now gas prices continue to decline. Still, the opportunity for short-sellers here is quite limited. Not so far below there is a level of 3.0000, form where I expect the price to rebound, supposedly to a 3.3000.
Bullish Diamond pattern (Reversal) is forming in Natural GasNatural Gas is show Classical bullish Diamond pattern character supported by oversold Rsi & triple bottom in weekly
Any good positive data will trigger sharp reversal in Natural Gas
Reversal will be brutual
Seller be cautious trail your stoploss
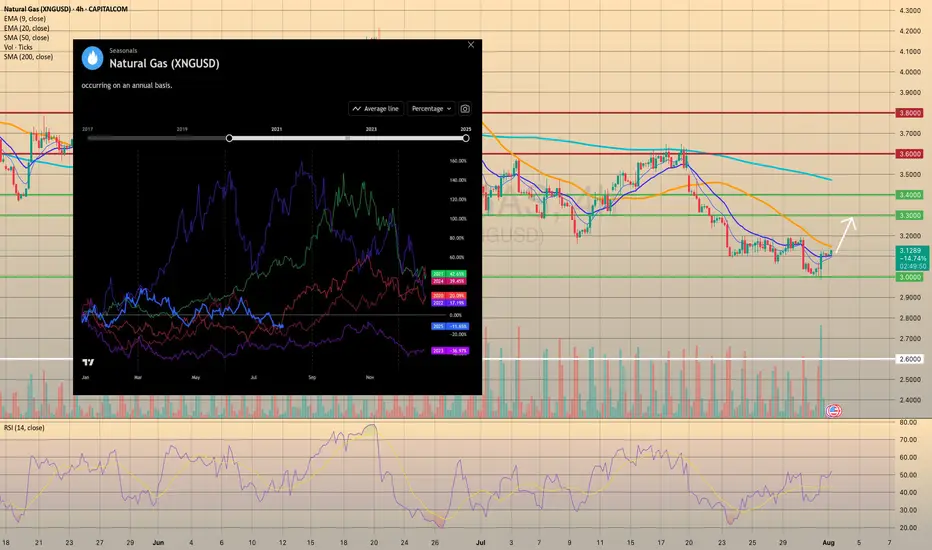
U.S. NATURAL GAS SUCCESSFULLY REBOUNDED FROM FIRM SUPPORT.U.S. NATURAL GAS SUCCESSFULLY REBOUNDED FROM FIRM SUPPORT.
Yesterday the natural gas storage report came out higher than expected. U.S. natural gas inventories increased by 48 billion cubic feet last week to 3,123 Bcf, increasing the surplus over the five-year average to 195 Bcf from 171 Bcf the week before, the EIA reports. The storage increase was bigger than the 24 Bcf average for the week, and above the 36 Bcf estimate. However, the price rised on 2.35% afterwards, supported by increased volume, which indicates the strength of the level. The upward movement towards the 3.3000 level is highly expected.
Additionally, seasonals suggest us that current prices may become the lowest till the end of the year. Historically, since August the natural gas prices increase in anticipation of a new heating season and higher energy demand (pic2).
Natural Gas is in the Buying DirectionHello Traders
In This Chart NATGAS HOURLY Forex Forecast By FOREX PLANET
today NATGAS analysis 👆
🟢This Chart includes_ (NATGAS market update)
🟢What is The Next Opportunity on NATGAS Market
🟢how to Enter to the Valid Entry With Assurance Profit
This CHART is For Trader's that Want to Improve Their Technical Analysis Skills and Their Trading By Understanding How To Analyze The Market Using Multiple Timeframes and Understanding The Bigger Picture on the Charts
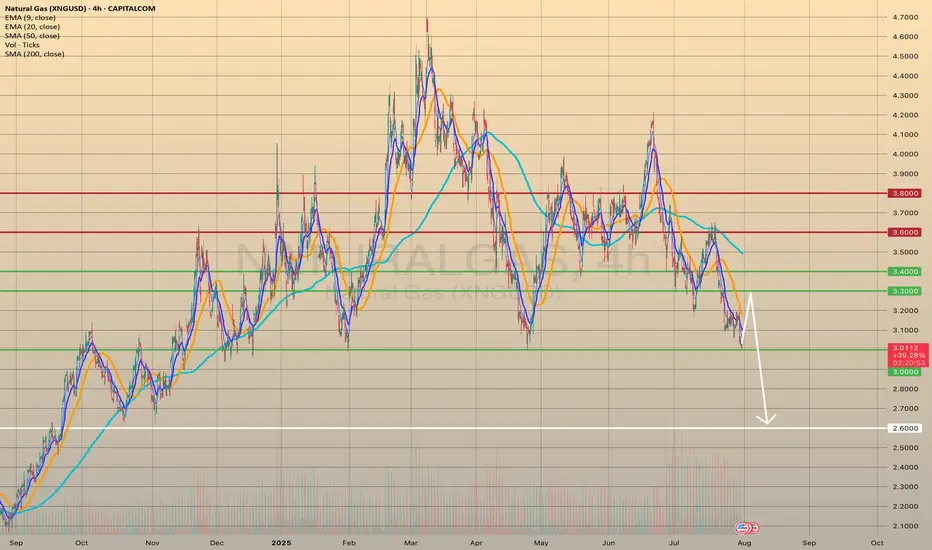
NATURAL GAS REACHED THE KEY SUPPORT LEVEL. WHERE TO GO NEXT?NATURAL GAS REACHED THE KEY SUPPORT LEVEL. WHERE TO GO NEXT?
XNGUSD has come to a crucial support level of 3.0000. Although the sentiment here stays as quite bearish (seasonally, August is not the perfect month for natgas buyers), we expect the price to rebound from the level of 3.0000 towards 3.3000 first. Afterwards, the continuation of bearish trend is expected with final target of 2.6000 before cold season beginning.
Wedge Pattern — A Key to Trend Movements📐 Wedge Pattern — A Key to Trend Movements 📈
🔍 Introduction
The Wedge is a chart pattern that represents a phase of directional consolidation following a trending move. It can act as a continuation 🔄 or a reversal 🔃 signal, depending on the context. The structure consists of two converging trendlines, both sloping in the same direction.
🧩 Pattern Description
Unlike the Flag pattern 🚩, the Wedge has no flagpole and doesn’t depend on the direction of the previous move. The direction of the wedge body determines its type:
A falling wedge ⬇️ is bullish 🟢 (buy signal)
A rising wedge ⬆️ is bearish 🔴 (sell signal)
The breakout is the key point to watch. The two trendlines slope in the same direction but at different angles, causing them to converge. This reflects a loss of momentum ⚠️ and typically indicates that buyers or sellers are preparing to take control.
This pattern can act as:
A continuation signal 🧭 — appearing at the end of a correction
A reversal signal 🔄 — forming at the end of a strong trend
📉 Volume is usually low during the wedge and rises on breakout. A low-volume breakout increases the risk of a false breakout ❗. Often, price retests the breakout level 🔁, giving traders a second chance to enter.
🎯 Entry & Stop-Loss Strategy
📥 Entry: On breakout confirmation
🛑 Stop-loss: Below the pattern’s low (bullish) or above its high (bearish), or under/above the most recent local swing point
🎯 Target: Project the height of the widest part of the wedge from the breakout point. Alternatively, use key price levels 📊 or a trailing stop 🔂 to lock in profits.
💡 My Pro Tips for Trading the Wedge
✅ Pattern Criteria
Two converging trendlines ➡️➕➡️
Clearly defined structure ✏️
Prior trending move before the wedge 🚀
Low volume within the wedge 📉, high volume on breakout 📈
Retest of breakout level = confirmation 🔁
🔥 Factors That Strengthen the Signal
Breakout on strong volume 📊💥
Appears after an extended trend 🧭📉📈
More touches = stronger pattern ✍️
Breakout occurs close to the apex 🎯
⚠️ Factors That Weaken the Signal
Low volume on breakout 😐
Poorly defined trendlines 🫥
Few touches on lines
Early breakout (too far from apex) ⏱️
No prior trend / appears in a range-bound market 📏
✅ Examples of My Successful Wedge Trades
📸
❌Examples of Failed Wedge Overview
💥
💬 Do you use the wedge pattern in your trading?
It’s a powerful pattern, especially when confirmed by volume and market structure. Share your favorite wedge setups or ask questions below 👇👇