XNGUSD ( Natural gas ) Short Term Selling ideaHello Traders
In This Chart XNGUSD HOURLY Forex Forecast By World of Forex
today XNGUSD analysis 👆
🟢This Chart includes_ (XNGUSD market update)
🟢What is The Next Opportunity on NZDCHF Market
🟢how to Enter to the Valid Entry With Assurance Profit
This Video is For Trader's that Want to Improve Their Technical Analysis Skills and Their Trading By Understanding How To Analyze The Market Using Multiple Timeframes and Understanding The Bigger Picture on the Charts.
NG trade ideas

NATURAL GAS - LONG SETUP!Last push into our Fibonacci levels and then new trend to the upside. Fibonacci levels line up with trendline, turned into support around 2$. White highlighted area (Fib levels) have previously acted as a support and resistance level.

NATURAL GAS Possible Long analysisThe NATURAL GAS trend is bearish for the last couple of months. The market placed a 1.9625 low on 22-Feb-2023. In a 4Hour time frame market reject the resistance area ( $2.54-2.61 ) as mentioned in the price chart and continued the bearish move. Now price is traded near the Support area ( $2.31-2.24 ). Volume indicates bears lose momentum. Price respect the Trendline in the past two times and now again near to test. Price also traded above the 200 MA ( moving average ) which indicates a bullish trend. So initiate long positions after closing above the Support area and also the trendline. On the other side, Short selling is favorable near the resistance area as mentioned above in the price chart after confirmation by a bearish price action structure.
Support and Resistance levels for day trading ;
Pivot Point Level: PP 2.3776
Support Levels: S1 2.3137, S2 2.2684, S3 2.2045
Resistance Levels: R1 2.4229, R2 2.4868, R3 2.5321

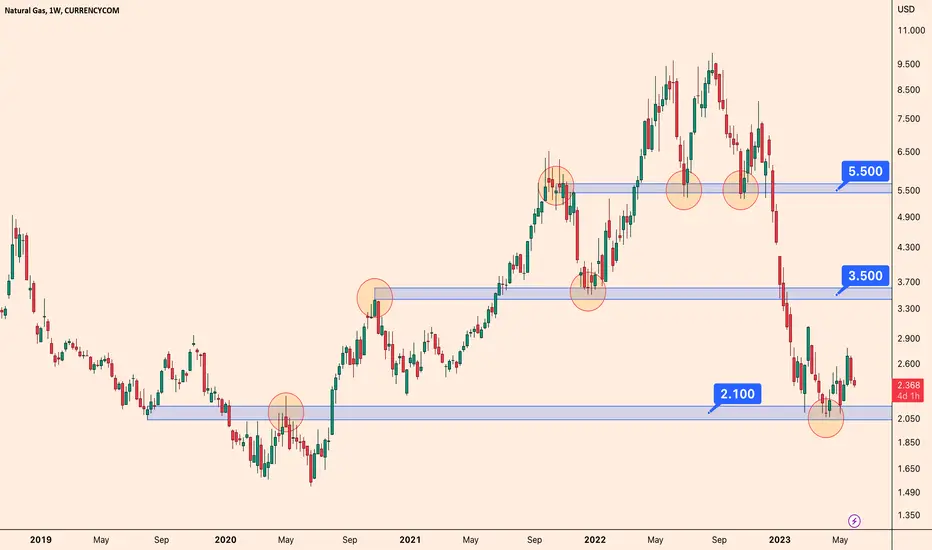
Natural Gas Critical LevelsNatural gas, which fell sharply from $ 6.5 to $2 is trying to recover again.
During this process, critical levels were determined. These levels appear at $2.10, $3.50 and $5.50.
As long as it does not fall below the $2.10 level, I can say that the $3.50 targeted buying opportunity in natural gas continues.
NatGas Update A revised version of the chart from yesterday. Be prepared for the possibility that this leading diagonal will turn to be something else (e.g. expanding diagonal). Yet, so far it is bullish

Natural Gas: May Continue To Move DownNatural Gas: May Continue To Move Down
Natural Gas is still under strong bearish pressure on a higher time frame.
All the times that the price manged to grow we saw a very fast sell-off
This is a clear signal that the market is not ready to increase NG for a
a long period of time.
After the price broke out from the pattern on the chart I am looking at for
a deeper bearish continuation movement.
Thank you and Good Luck!

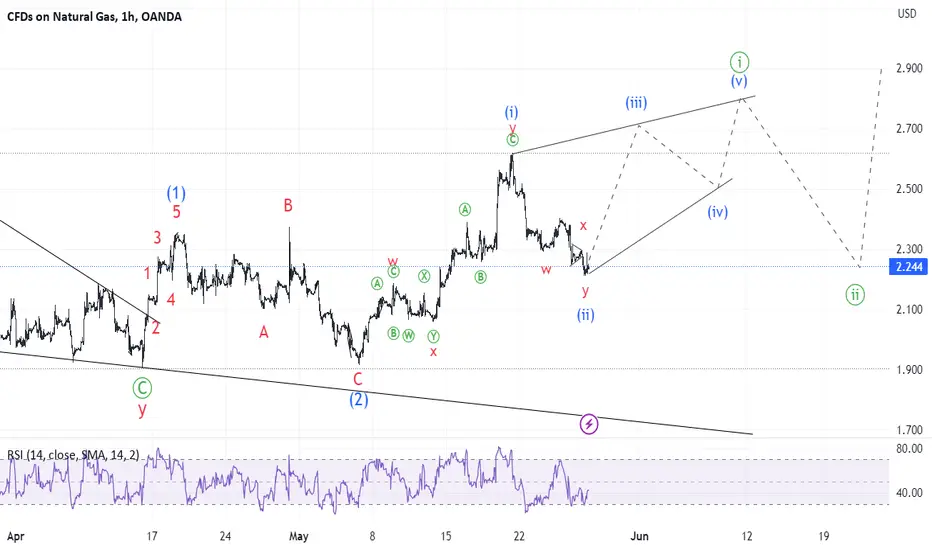
Natgas UpdateThe local correction for natural gas appears to be over, and it will now move through the uptrend. Given that the previous wave marked as (i) was not an impulse, I envisage further struggles to shape a diagonal. Timing is notional; the diagonal can be shorter or longer, and price levels can be quite different. I will be looking for price to shape wxy zigzags up and down to confirm the outlook.
Natural Gas movementThe bull movement and the breakout is real, we should see pull back to load up more positions
Natural Gas Possible Path (Updated)I had originally published a BUY trade idea which I am still in but currently running at a loss. However, I did fail to notice the current wave patterns at that point which now offers some sense as to why the trade has gone against the hopeful BUY direction. I do believe the current leg down is a mini ABC correction phase and I am hopeful for a move up next week. I do think that this BUY trade is for the very long term (months) and may well be a bit rocky, but the price GAP in December 2022 will eventually act as magnet and bring this commodity back off the bottom.
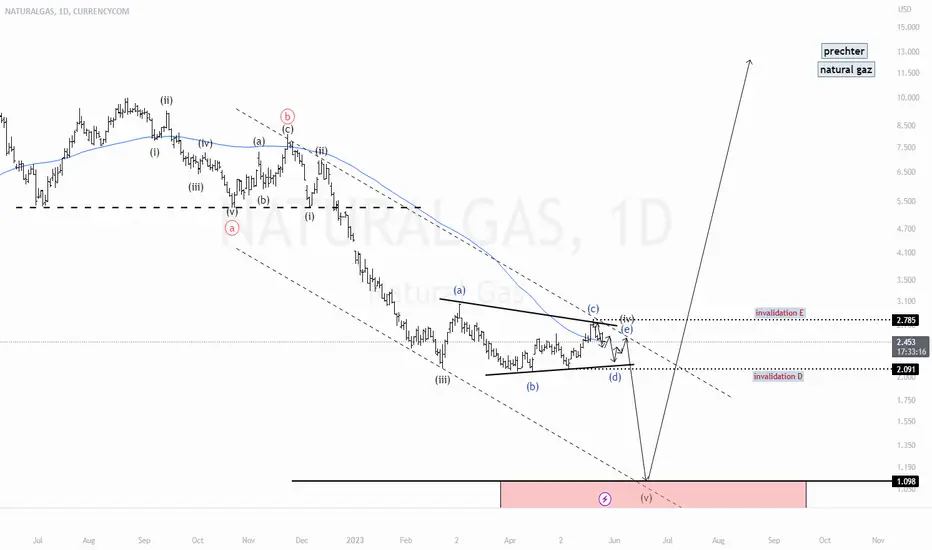
natural gaz probably forming wave 4 of 5 natural gaz it might surprise us with flash crash within the following weeks
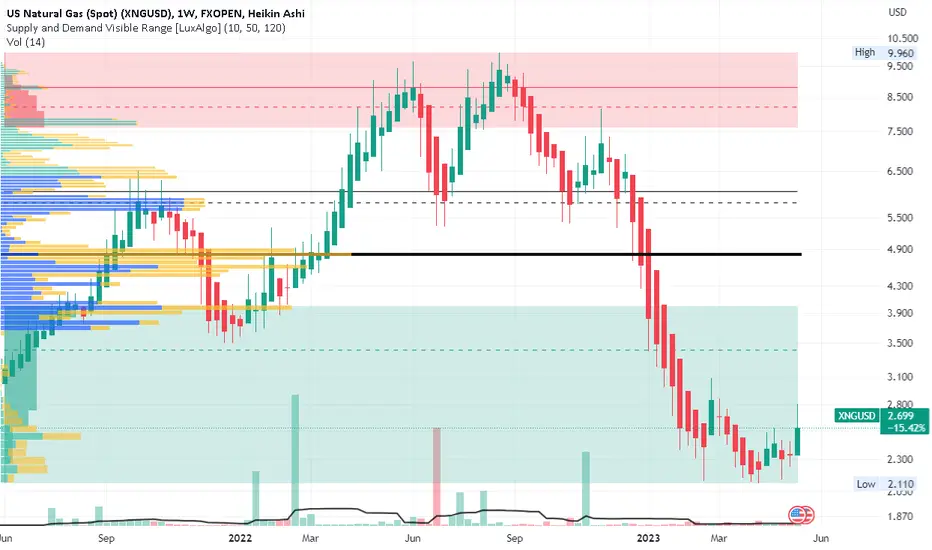
Can XNGUSD short squeeze?XNGUSD on the weekly chart showing two years of price action with weekly candles
shows the rise in 2021 into spring 2022 then printing a head and shoulders pattern
and the reversal to deep into the support/demand zone. The volume profile shows
the majority of the trading during this time period to have been between $3.75 and
$ 8.50. It would seem likely that there are a sizeable amount of short sellers holding
positions with unrealized profits of 50% to as much as 300%. This past week had the
best buying volume in six months and provides bulls with optimism
If natural gas can gain some momentum and put in green candles with a decent price range for
a couple of weeks in a row, the combination of new buyers with new interest and short sellers
liquidating and buying to cover their unrealized gains might ignite a bit of a rally for natural
gas. I will keep natural gas on watch. I will keep in mind that a breakout without a
corresponding volume the response could be a fakeout. A stop loss would be $1.95 below the
support zone while the final target would be $4.75 below the POC line. Interval take profits
would be 10% of the forex lots every time the price rises by $0.50 for risk management and
good profit taking while underway.
natural gas bull
natural gas is bull again
1. hit tp1 and finished retracement
2. 2 trend line break out
3 . bullish englulfing candle
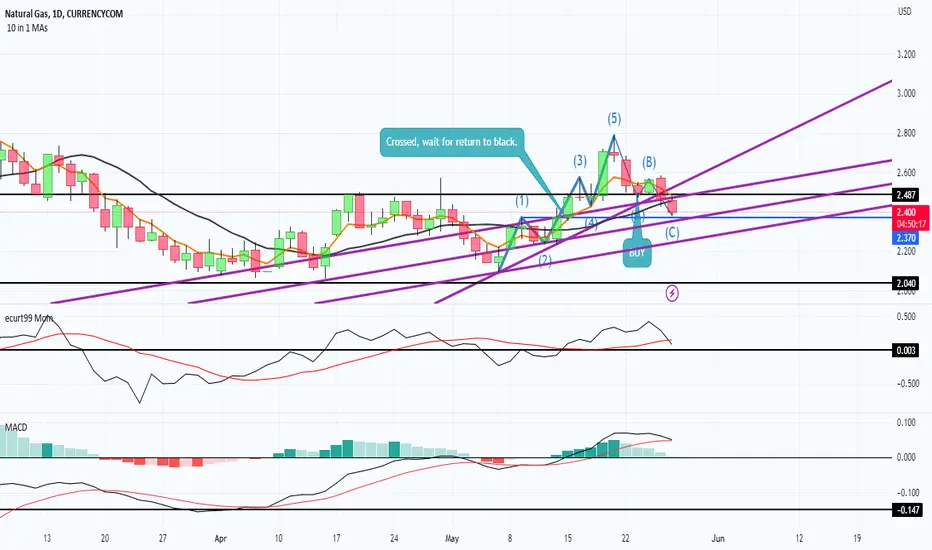
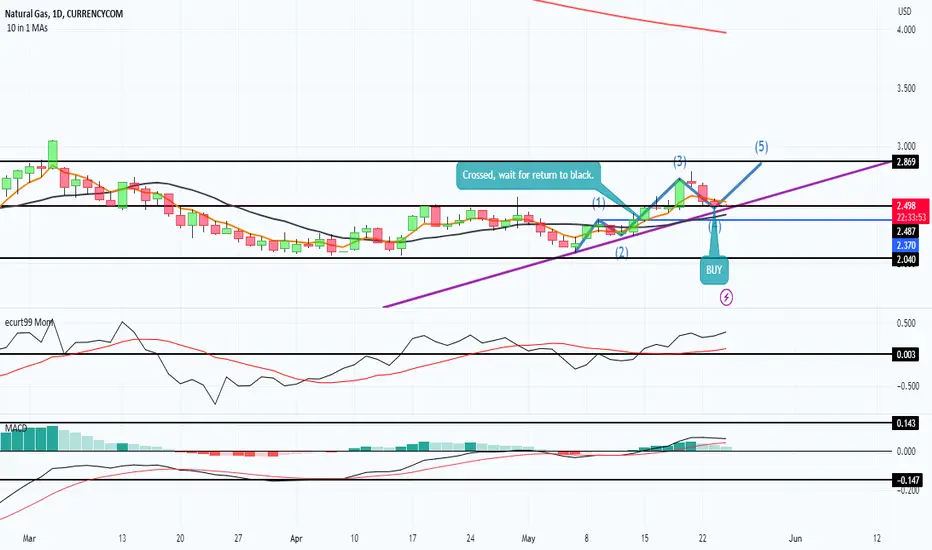
Natural Gas Live Buy TradeI have mapped out a mini-Elliott Wave which, in combination with a positive momentum indicator, looks like a decent chance of playing out. The longer time MACD has the lines in the right place. The 15SMA and 5EMA are quite wide apart so there is every chance of a rebound in the coming days.
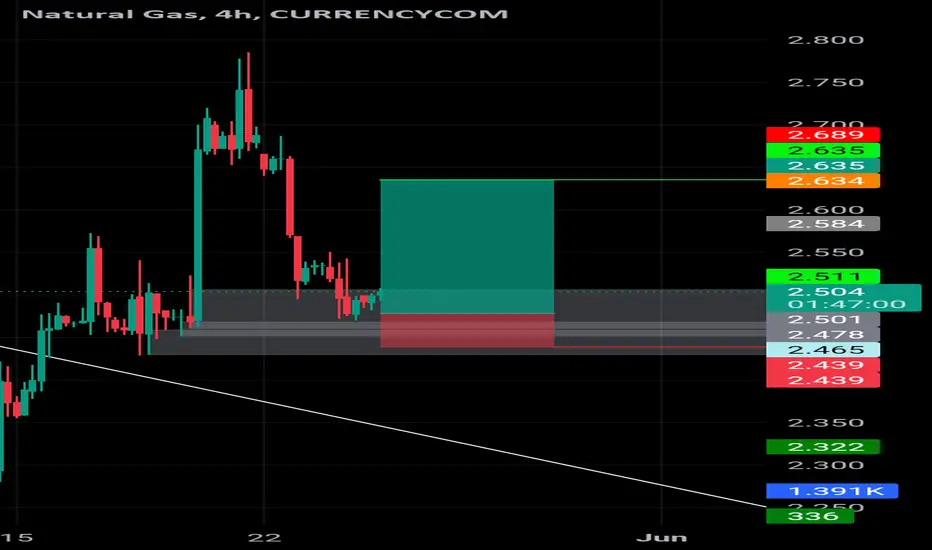
Risky buy possible long natural gasStop and tgt marked
1:4 R/R
TRADE ON OWN RISK
DO YOUR OWN RESEARCH
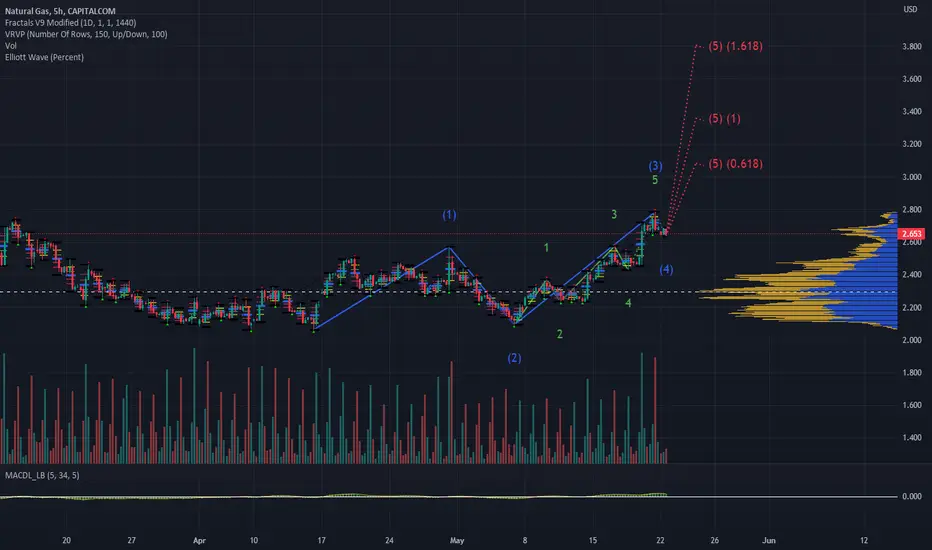
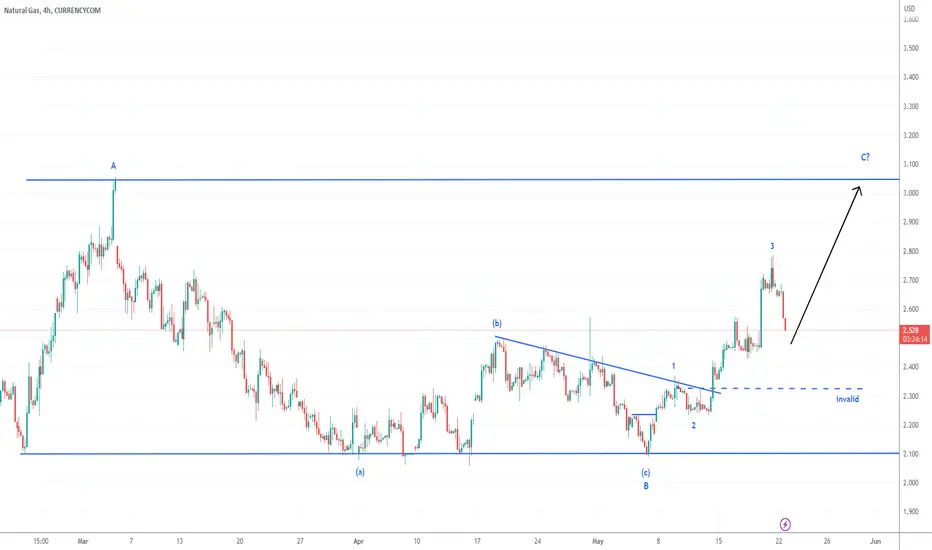
NATURALGAS 22May2023broadly speaking, it is sideways with a fairly large range. but we can still take a chance on a good moment. if you look at the current elliot notation, it is likely that the price will go to the previous HH, you can take a long opportunity with the SL area below the invalid area
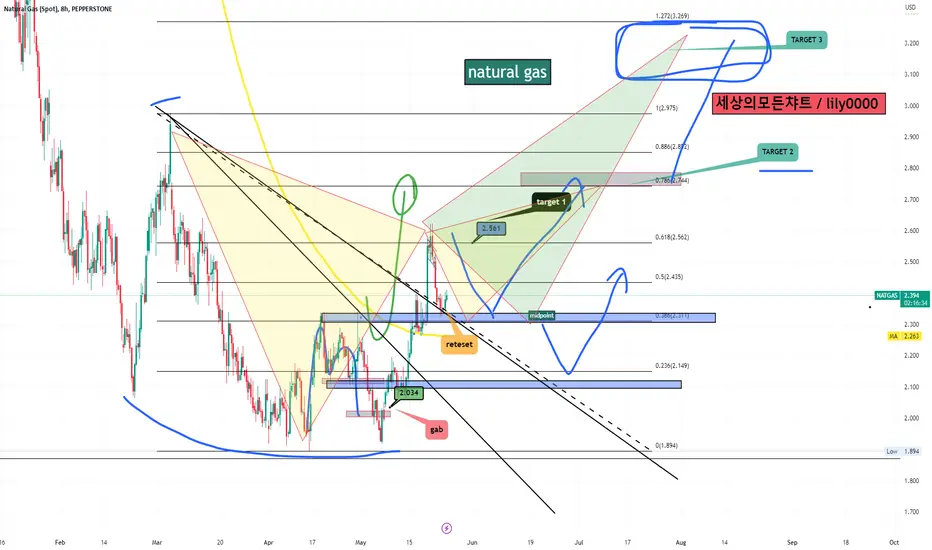
Natural gas 4th Elliot wave As the summer gets closer the filling process of European reserves gonna take place soon, the Usa production lost some precessing power and the North Stream gaslines being partially destroyed, we can see an exponentian growth of the Natural gas Price. First possible targets are presented on the Chart