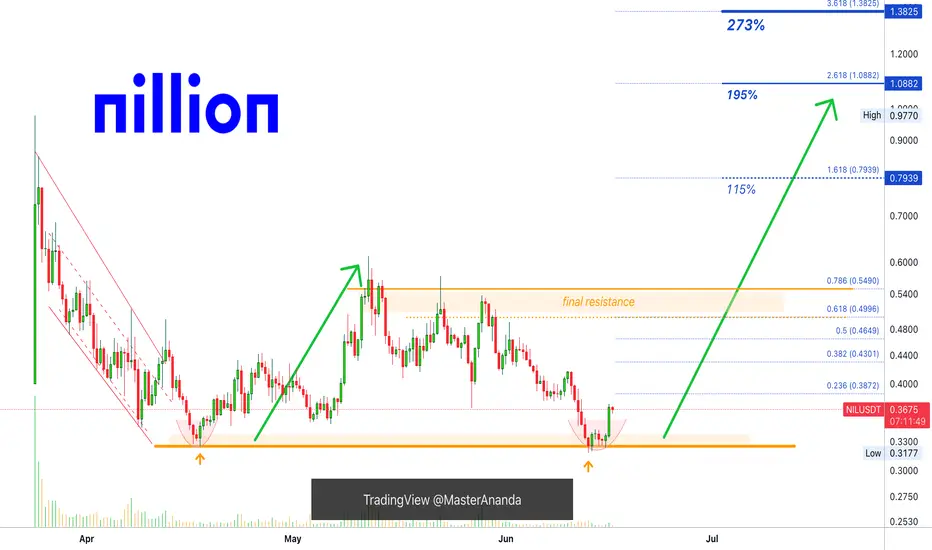
Nillion To Meet Final Resistance To Reach 273% —Trading BasicsNillion hit bottom 13-June but the bottom is only confirmed today with the current bullish breakout.
As the action turns bullish Nillion will grow to face its "final resistance" around $0.55. The good news is that this resistance level will break followed by additional growth.
Within the next 2 mo
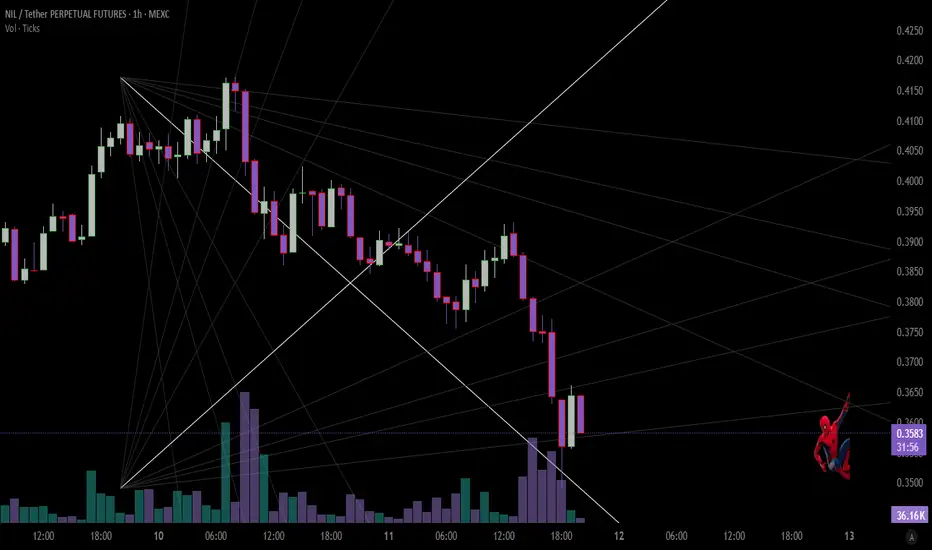
"Blind Trap Breakout"Wait for the web to stop shaking- or weave on your own.
Playing off the "blind computation" tech and the liquidity trap on the chart.
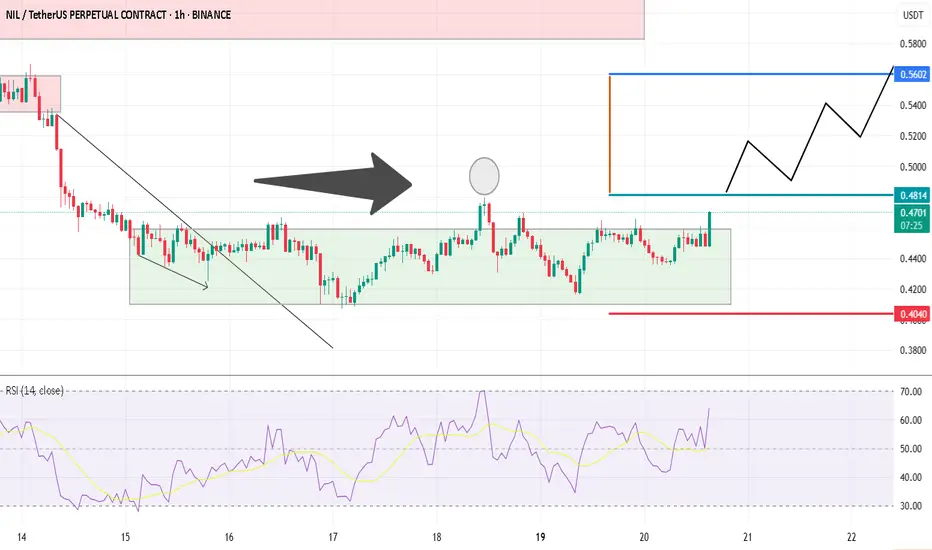
Technical Analysis for NIL/USDT (1H Chart)The NIL/USDT pair is currently trading at $0.4662, showing signs of bullish momentum with a +4.06% gain in the latest hourly session.
A confirmed breakout above this previous high (HH) would signal a potential bullish continuation, targeting the next resistance around $0.5602. RSI is trending upwar
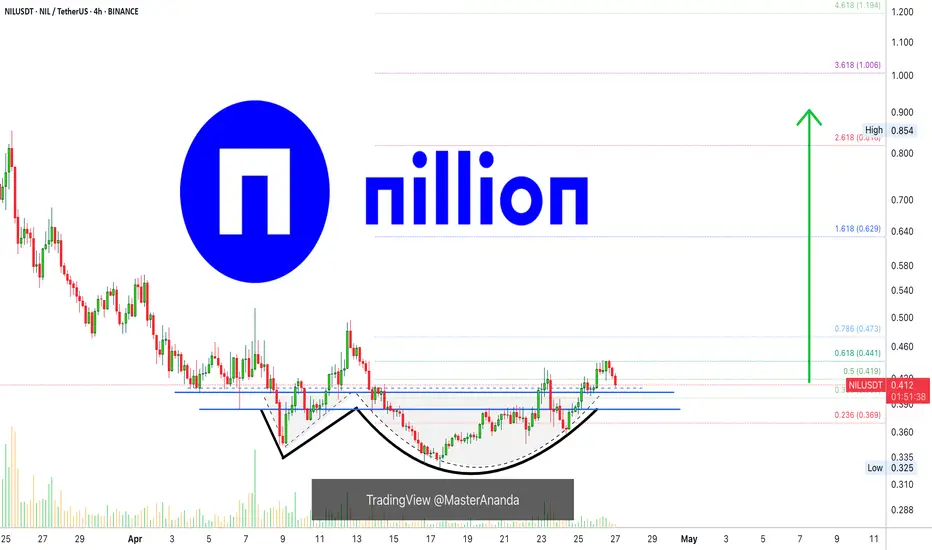
Nillion: Huge Long-Term Potential For GrowthThis one caught my attention and the project seems to be a good one, the concept behind it.
The chart here is very young so I am using a short-term timeframe, 4H.
(I will do a more thorough analysis once more data is available.)
The classic Adam & Eve (A&E) bottom formation is present on the char
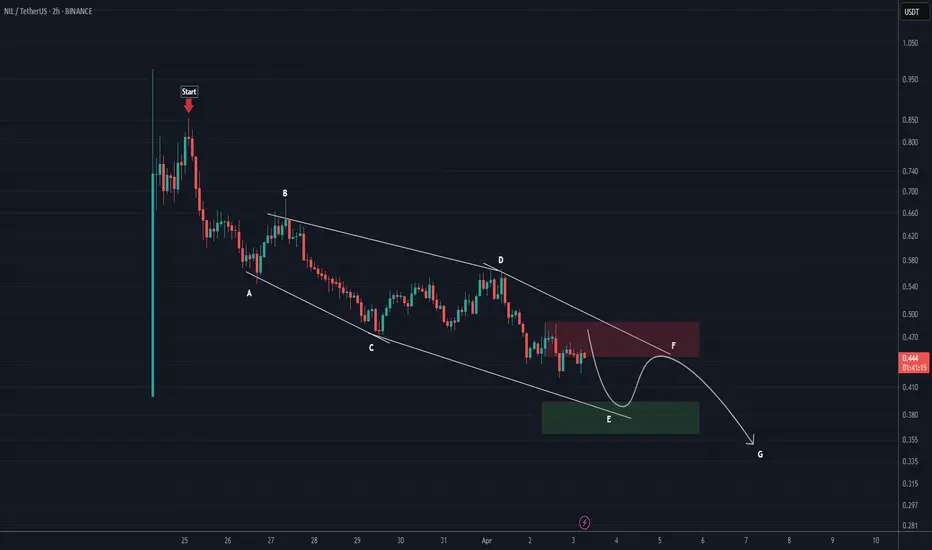
NIL ANALYSIS (4H)The NIL correction started from the point we marked as Start on the chart.
This correction appears to be a Diametric, and it seems we are currently in wave E of this pattern. The price is expected to follow the path indicated by the arrow.
A daily candle close above the invalidation level will inv
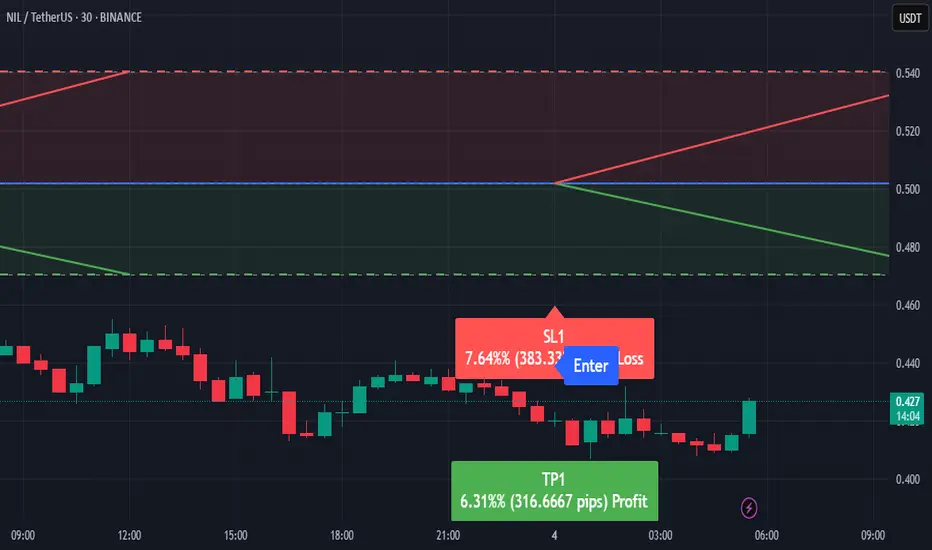
NILUSDT Forecast: Anticipated Bearish Move AheadBased on the EASY Trading AI strategy analysis, NILUSDT currently demonstrates bearish sentiment. Our entry point is marked at 0.502 with projected targets indicating downward movement toward a Take Profit at 0.47033333. Protective Stop Loss is clearly defined at 0.54033333 to mitigate potential ris
$NilIs nil going to nil?
Probably last chance to bounce somewhere around here. Bullish if reclaim 0.55$

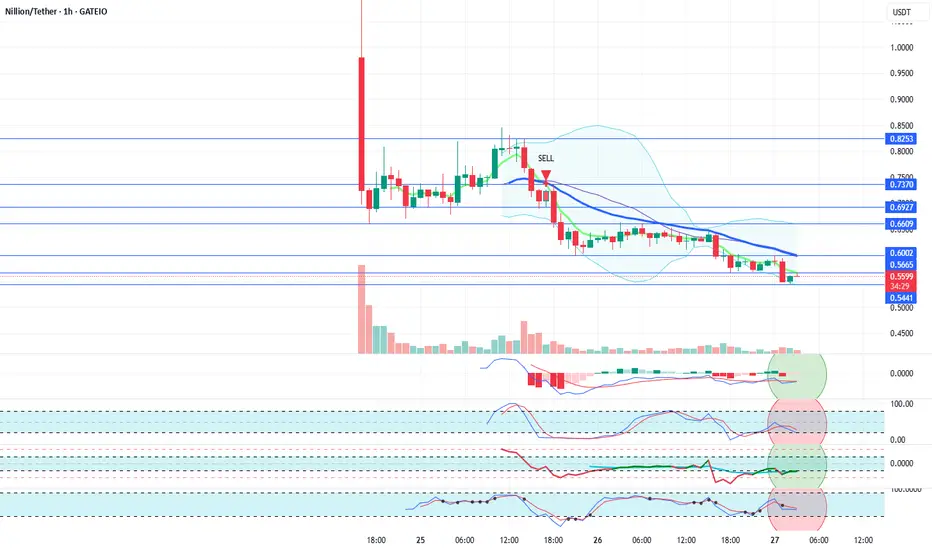
NILUSDT Hourly Technical AnalysisNILUSDT Hourly Technical Analysis
Nillion Coin is experiencing selling pressure below the 21-day moving average in the 1-hour technical analysis. Currently, it is trying to recover after forming support at 0.5441. The decline in Bitcoin has also affected Nillion Coin. Indicators are partially posit
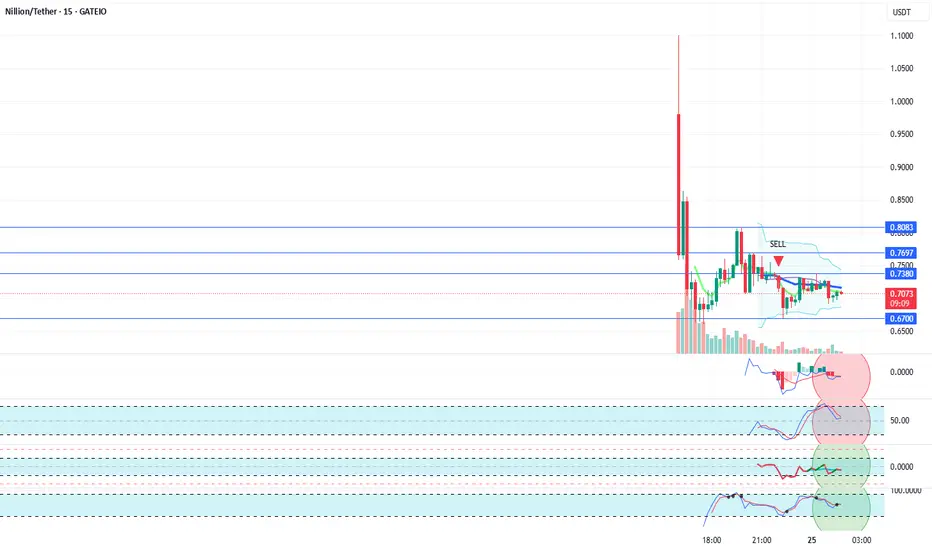
NILUSDT 15 Minute Technical AnalysisNILUSDT 15 Minute Technical Analysis
Nillion Coin's 15 minute chart on Binance is currently showing a sideways movement. It is above the 0.67 support level and moving at the same level as the 21-day moving average line. We believe Nillion Coin has the potential to rise to higher price levels. There
See all ideas
Summarizing what the indicators are suggesting.
Oscillators
Neutral
SellBuy
Strong sellStrong buy
Strong sellSellNeutralBuyStrong buy
Oscillators
Neutral
SellBuy
Strong sellStrong buy
Strong sellSellNeutralBuyStrong buy
Summary
Neutral
SellBuy
Strong sellStrong buy
Strong sellSellNeutralBuyStrong buy
Summary
Neutral
SellBuy
Strong sellStrong buy
Strong sellSellNeutralBuyStrong buy
Summary
Neutral
SellBuy
Strong sellStrong buy
Strong sellSellNeutralBuyStrong buy
Moving Averages
Neutral
SellBuy
Strong sellStrong buy
Strong sellSellNeutralBuyStrong buy
Moving Averages
Neutral
SellBuy
Strong sellStrong buy
Strong sellSellNeutralBuyStrong buy