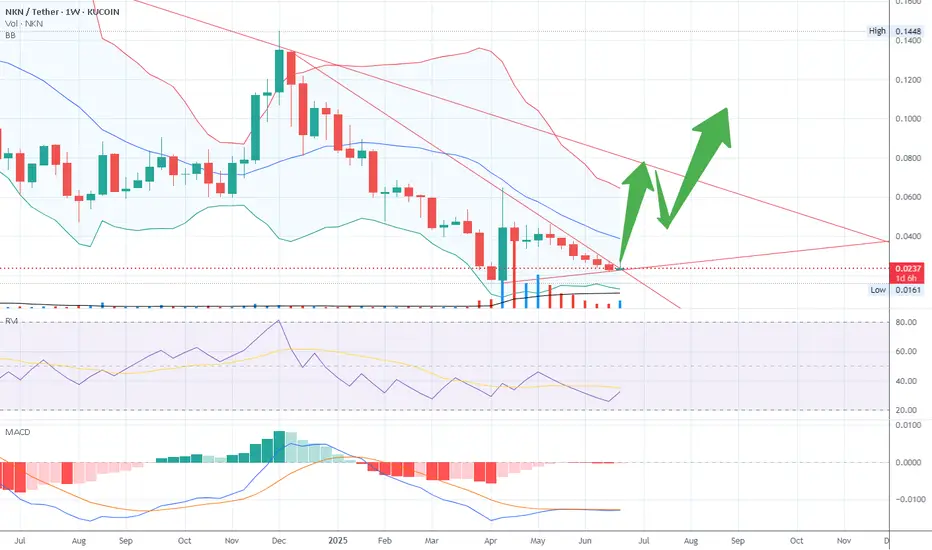
$NKNUSDT - Buy Zone ReadyBINANCE:NKNUSDT - I'd jump into NKN at this point. Price is a steal in my opinion. Wont sell this until it reaches a minimum 1x. All charts to me are posing a potential buy signal. All the best
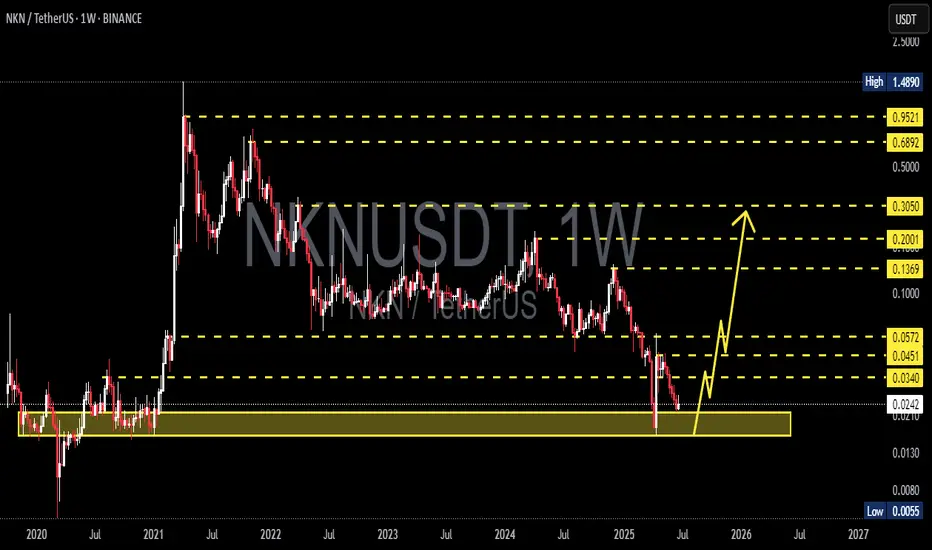
NKN/USDT — Epic Reversal from Major Demand Zone🔍 Chart Breakdown:
1. Strong Historical Demand Zone:
Highlighted by the thick yellow box between $0.0055 – $0.0240.
Price has returned to this accumulation range, which previously launched a major rally in 2021.
2. Potential Bullish Reversal Pattern:
After hitting the lower support, recent week
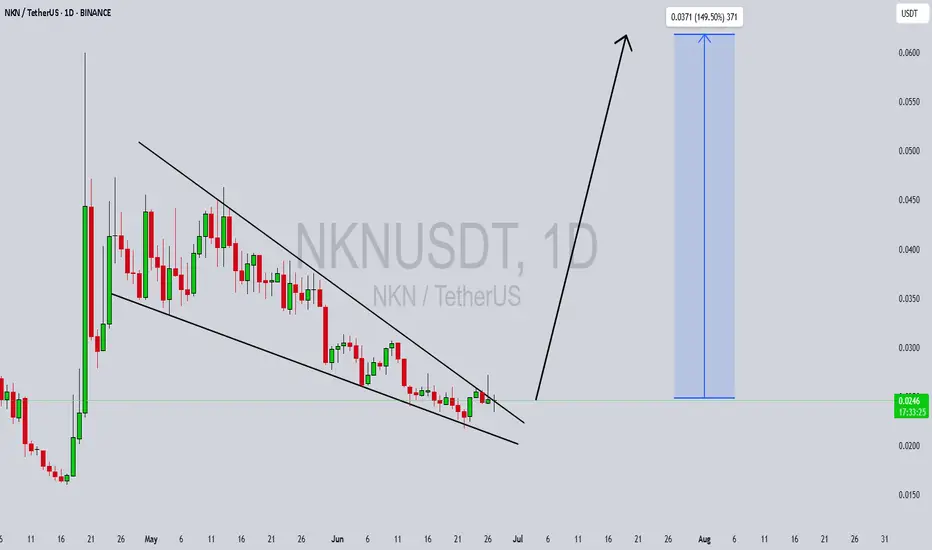
NKNUSDT Forming Falling Wedge BreakoutNKNUSDT has recently confirmed a Falling Wedge Breakout Pattern, signaling a strong bullish reversal after a prolonged downtrend. This classic reversal structure is often considered a high-probability setup, especially when accompanied by increasing volume, as seen in this case. The breakout suggest
bullish fractalAs you can see, this fractal I think will happen
it's not a deal just watch it with your analyze
NKN Successfully breakout this resistant line Successfully breakout this resistant line with a short -term target of at least +10%

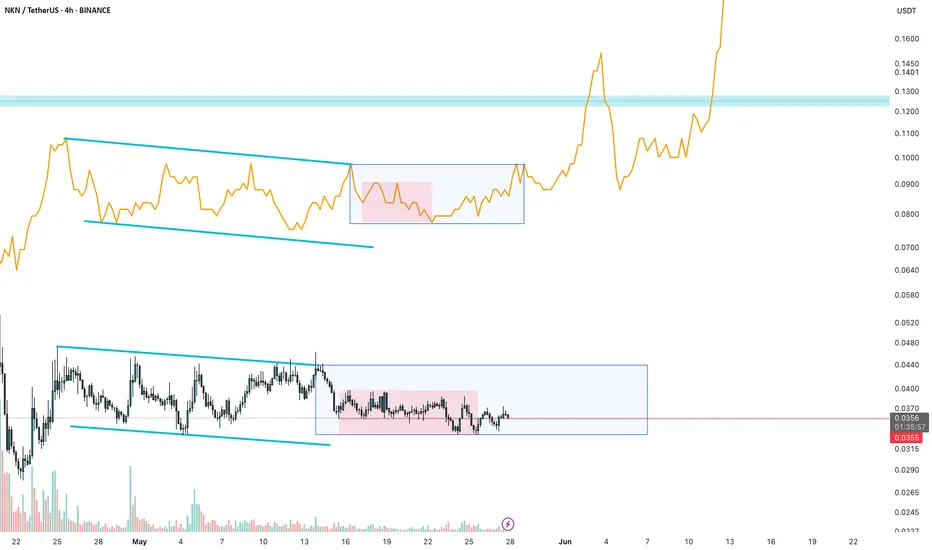
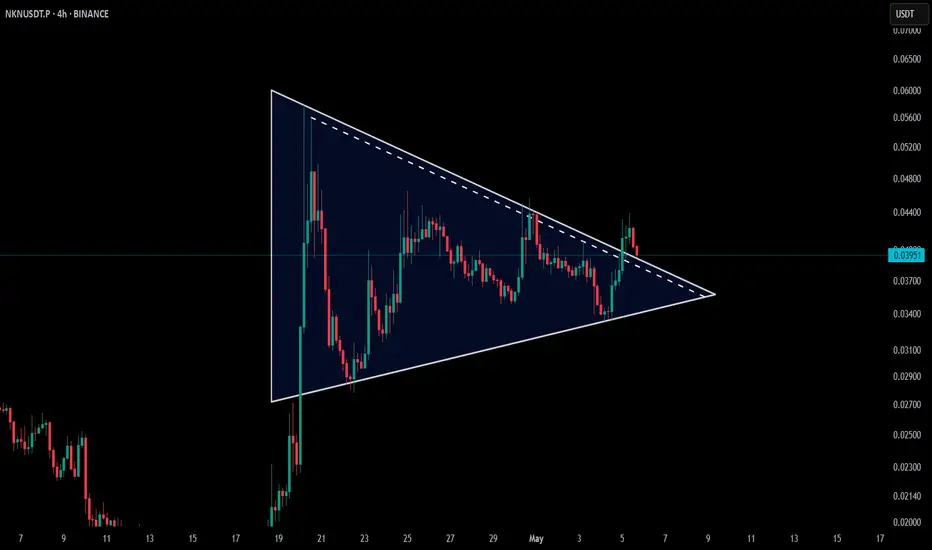
NKN Approaching Key Support – Big Move Loading?🚨 GETTEX:NKN 4H Chart Update!
🔺 Price is retesting the support zone of a symmetrical triangle—an area that often leads to high-volatility breakouts.
📈 If buyers hold the line, an explosive move could follow as triangle setups tend to trigger strong momentum!
👀 All eyes on this zone—will the bull
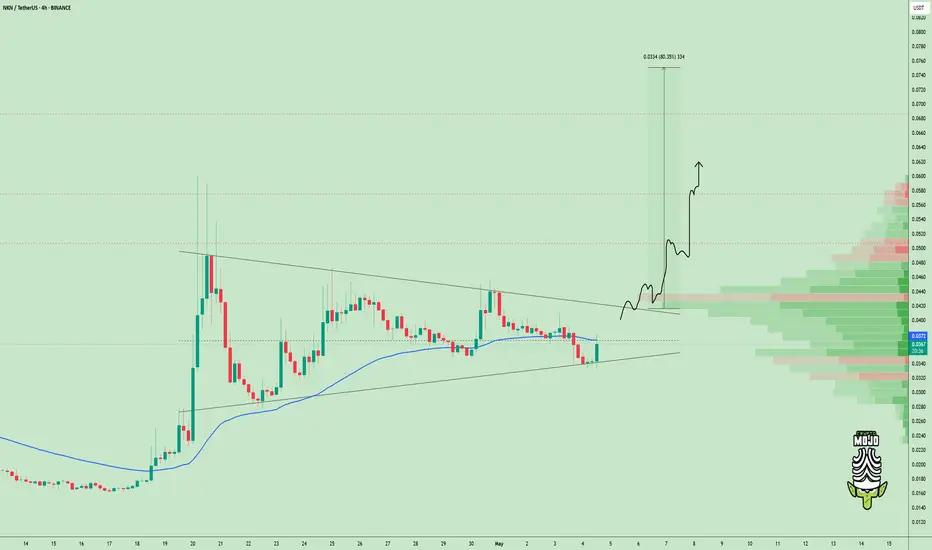
$NKN Heating Up — Breakout Imminent?GETTEX:NKN is waking up.
It held that trendline perfectly, and now it’s pushing back strongly.
Price was getting squeezed in that wedge for days looks like it’s ready to pop.
That top line? It’s not going to hold for long.
Volume is picking up, and this move could easily send it flying to $0.06
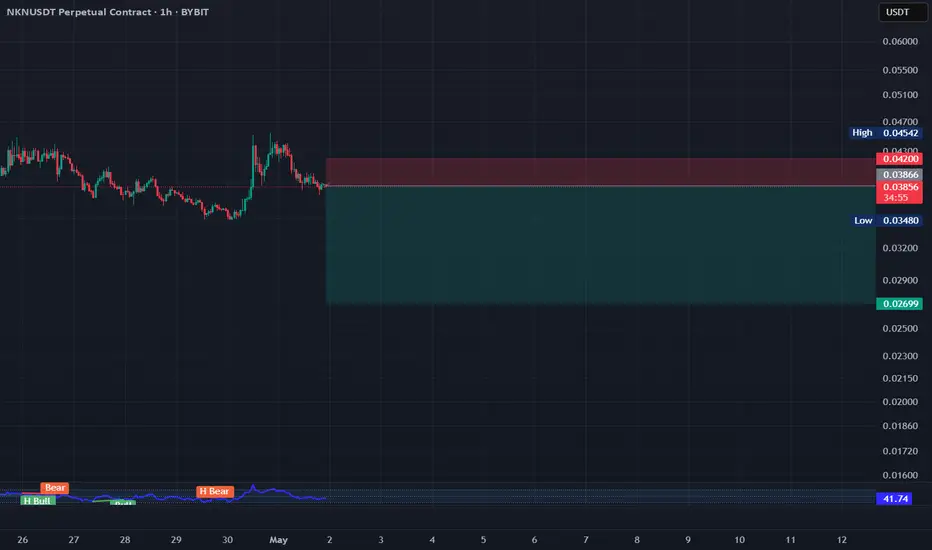
ORDER - NKN/USDT ShortORDER - #NKN/USDT
Direction: #Short 🔴
Entry Price: 0.03866
Stop Loss: 0.041995
Target 1: 0.036326
Target 2: 0.033991
Target 3: 0.031657
Target 4: 0.029322
Target 5: 0.026988
Note: Our software manages trades dynamically. Positions may close early (before SL or final TP) based on market conditions,
NKNUSDT - Buy it now!After a long downtrend of approximately 90%, the bearish trendline has been broken — this is a strong signal that the current price is a great entry point for buying.
my target is previous top at 0.14$

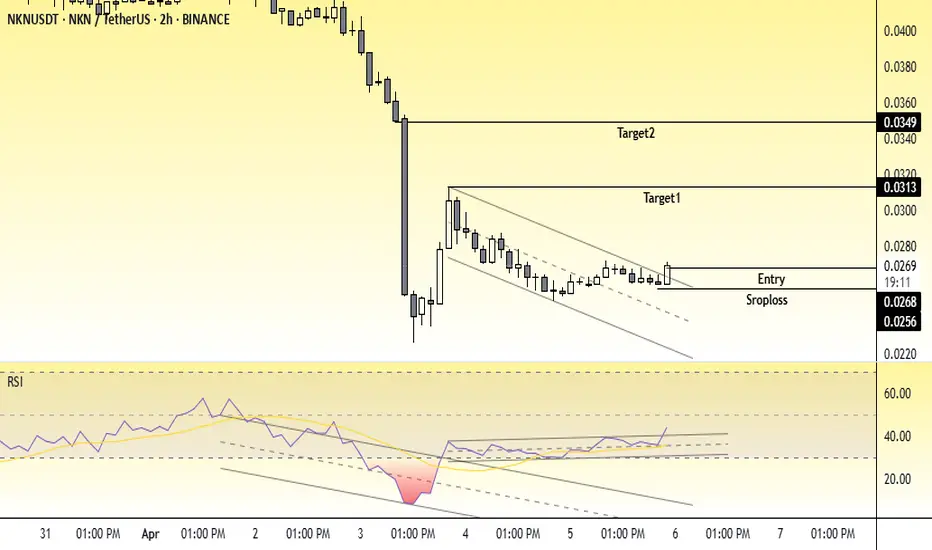
NKNUSDTRISKY DUE BINANCE MONITORING TAG
📊 Technical Breakdown
📉 Pattern: Falling Channel
The price has been moving inside a descending channel, which often acts as a bullish continuation or reversal pattern.
A breakout above the upper trendline of the channel has been marked as the entry point, signalin
See all ideas
Summarizing what the indicators are suggesting.
Oscillators
Neutral
SellBuy
Strong sellStrong buy
Strong sellSellNeutralBuyStrong buy
Oscillators
Neutral
SellBuy
Strong sellStrong buy
Strong sellSellNeutralBuyStrong buy
Summary
Neutral
SellBuy
Strong sellStrong buy
Strong sellSellNeutralBuyStrong buy
Summary
Neutral
SellBuy
Strong sellStrong buy
Strong sellSellNeutralBuyStrong buy
Summary
Neutral
SellBuy
Strong sellStrong buy
Strong sellSellNeutralBuyStrong buy
Moving Averages
Neutral
SellBuy
Strong sellStrong buy
Strong sellSellNeutralBuyStrong buy
Moving Averages
Neutral
SellBuy
Strong sellStrong buy
Strong sellSellNeutralBuyStrong buy
Displays a symbol's price movements over previous years to identify recurring trends.