track it - buy at zoneENTRY
- lines marked below is potential reversal zone ( PRZ)
- entry is strictly inside the zone
- look for buying confirmation in smaller time frame ( 15 minutes preferred )
EXIT
1. target
- mark fib retracement from C to latest swing low
- TGT 1 - 0.236 fib level ( intraday target )
- TGT 2 - 0.382 fib level
- TGT 3 - 0.5 fib level ( preferred target )
2. SL
- candle close below (PRZ)
- if u didn't get confirmation inside the zone , ignore this pick
- if candle close is below zone , this pattern becomes invalid . IGNORE THIS PICK
- RE-ENTRY can be done , if u again get buying confirmation inside the zone
ACC trade ideas

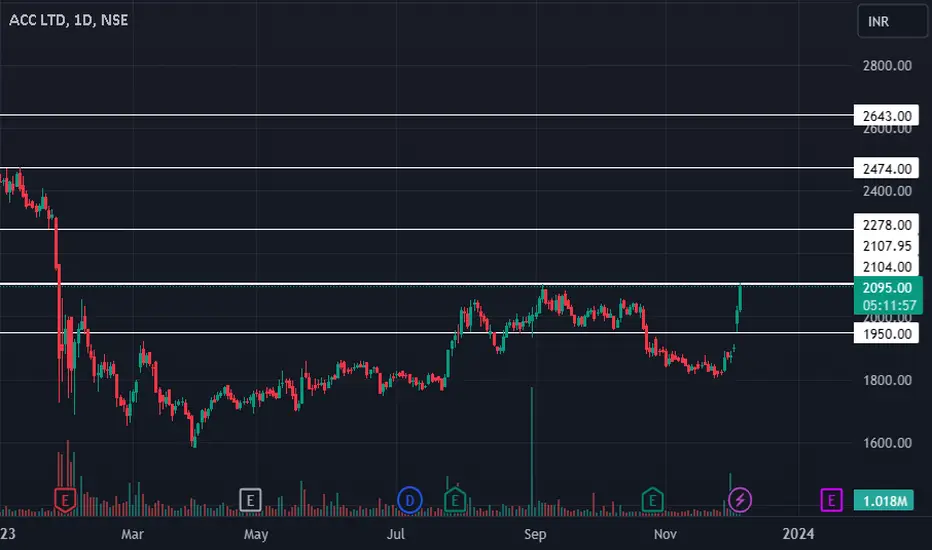
Bullish On ACCACC looks bullish. Can be bought above 2104, with a stoploss at 1950. On the upper side, the first target at 2278, second target at 2474 and he third target at 2643
ACC LTD Conclusion
ACC Ltd. presents a compelling buy opportunity due to its consistent financial
growth, strategic capacity expansion, robust cost management, and strong
market position. The company's alignment with environmental sustainability
and digitization eorts further strengthens its long-term prospects. Coupled
with the synergistic benefits from the Adani Group acquisition and favorable
macroeconomic conditions, ACC Ltd. is well-positioned for continued growth
and profitability, making it a strong buy recommendation.
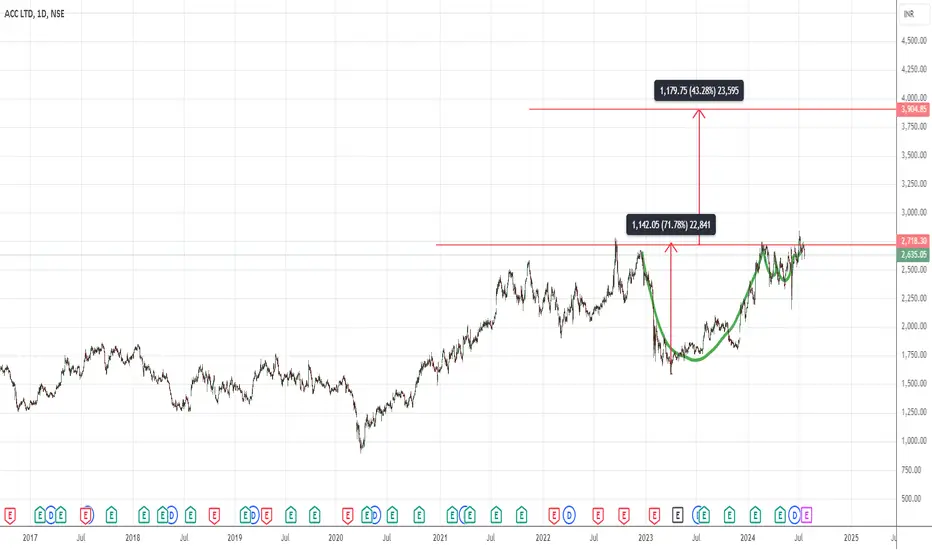
After thorough analysis and considering all the factors mentioned above, we
recommend buying at the current price of 2619.80 with a target of 3905
which represents a potential upside of 49% in the next 12-18 months
timefraME
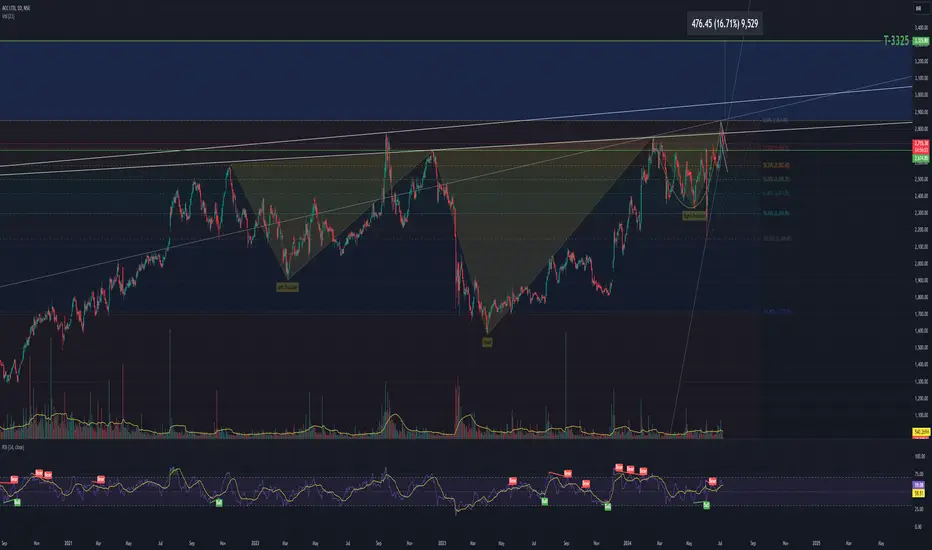
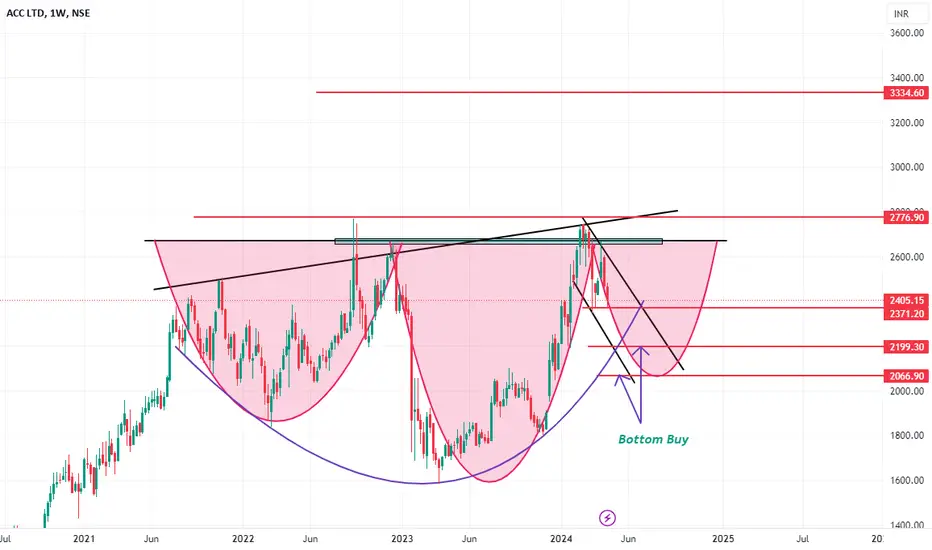
ACC: bullish or bearishACC: I see Inverted H&S and at the right shoulder side. cup & handle pattern. Looks like the breakout is yet to happen. but if it happens target1 is near 3325. Also from the previous high retracement was up to 50% but closing happened above 38.2%, which was the closing above the last swing high. Need more light on this.
SWING IDEA - ACCACC has recently emerged as a focal point of interest, presenting a promising buying opportunity when analyzed through the lens of technical indicators.
Reasons are listed below :
The 2080 levels underwent multiple tests before the price eventually broke through. Currently, the price is in the process of retesting those levels.
A bullish marubozu candle is formed on daily timeframe.
0.382 Fibonacci support.
Broke strong consolidation of 308 days.
The stock price is above 50EMA and 200EMA i.e the trend is intact.
Target - 2397 // 2635 // 2777
StopLoss - Daily close below 1970

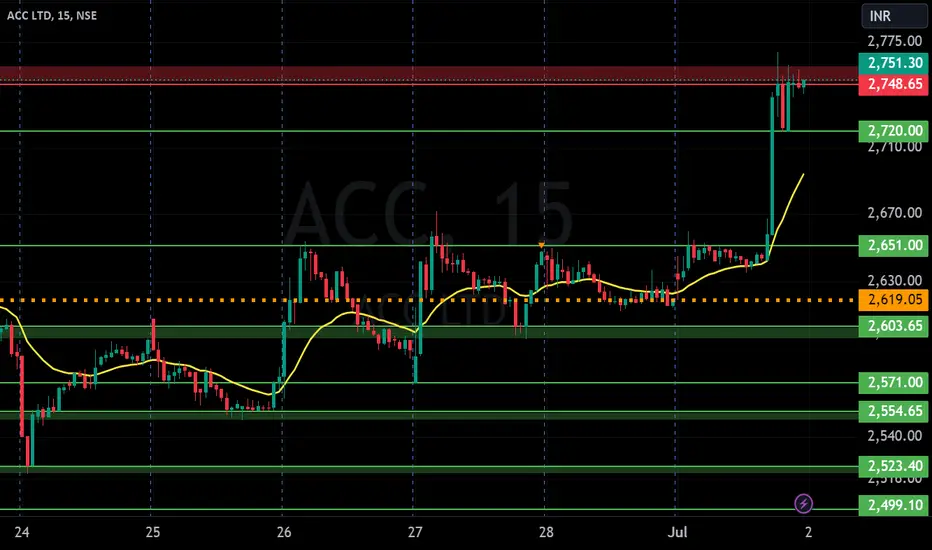
ACC LTD S/R for 2/7/24Support and Resistance Levels: In technical analysis, support and resistance levels are significant price levels where buying or selling interest tends to be strong. They are identified based on previous price levels where the price has shown a tendency to reverse or find support.
Support levels are represented by the green line and green shade, indicating areas where buying interest may emerge to prevent further price decline.
Resistance levels are represented by the red line and red shade, indicating areas where selling pressure may arise to prevent further price increases. Traders often consider these levels as potential buying or selling opportunities.
Breakouts: Breakouts occur when the price convincingly moves above a resistance level (red shade) or below a support level (green shade). A bullish breakout above resistance suggests the potential for further price increases, while a bearish breakout below support suggests the potential for further price declines. Traders pay attention to these breakout signals as they may indicate the start of a new trend or significant price movement.
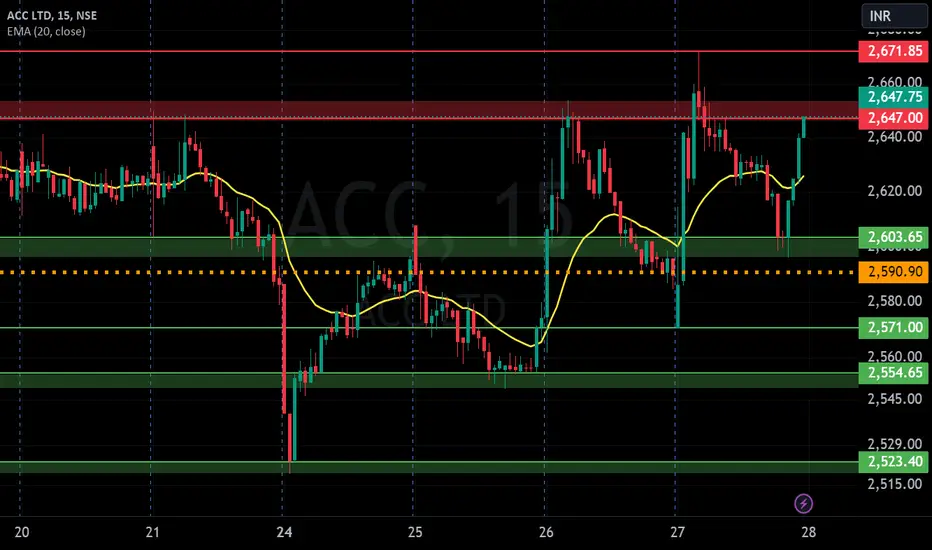
20 EMA: The yellow line denotes 20 EMA, to interpret the 20 EMA, you need to compare it with the prevailing stock price. If the stock price is below the 20 EMA, it signals a possible downtrend. But if the stock price is above the 20 EMA, it signals a possible uptrend.
Disclosure: I am not SEBI registered. The information provided here is for learning purposes only and should not be interpreted as financial advice. It is important to consult with a qualified financial advisor before making any investment decisions. Tweets neither advice nor endorsement.
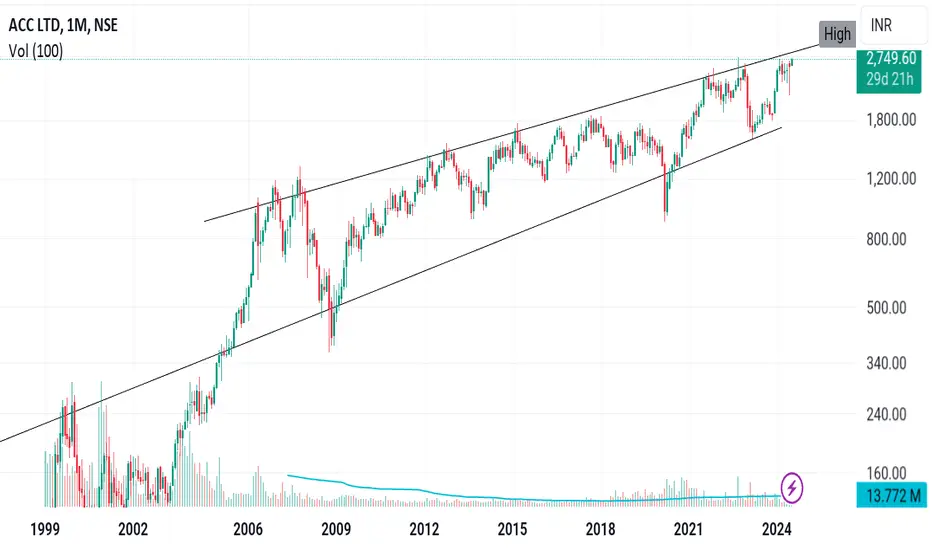
What if ACC Ltd. Crosses its oldest boundary wallToday, the highest jumping share in Nifty 50 was ACC Ltd. What if it has been locked in an upper-side jail for a long time, but if it breaks the boundary wall, then it can prove that it is really a share of Adani Group.
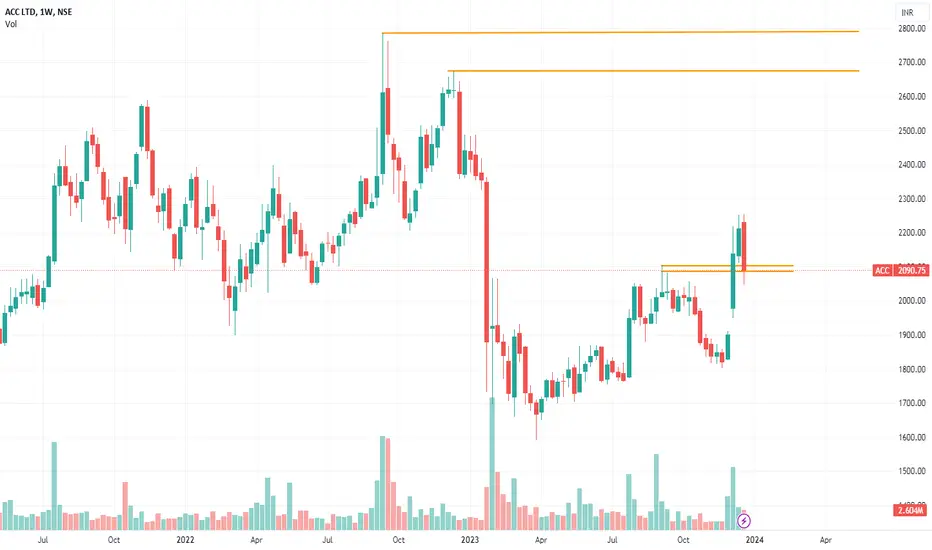
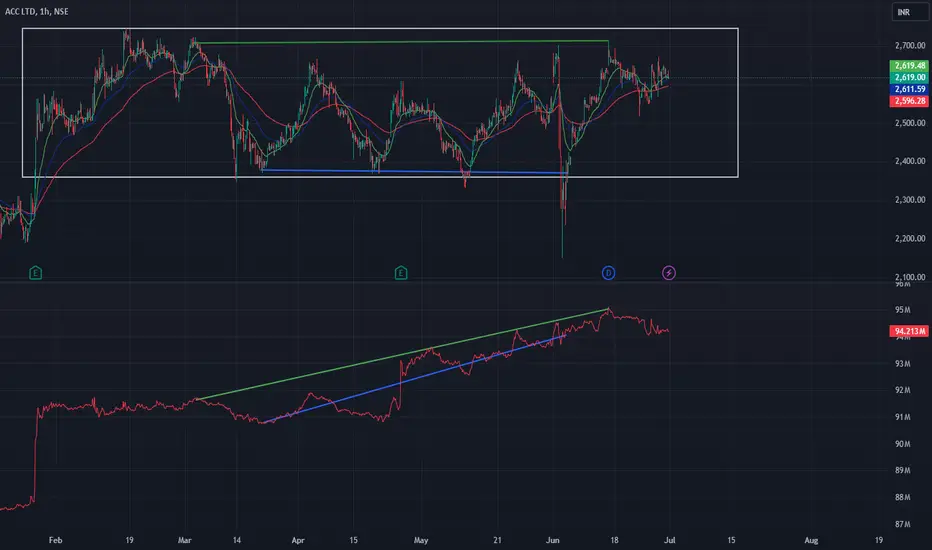
ACC looks Bullish with Huge volume accumulationACC range bound from long time with good consolidation and volume build up looking bullish for long term.
ACC LTD S/R for 29/6/24Support and Resistance Levels: In technical analysis, support and resistance levels are significant price levels where buying or selling interest tends to be strong. They are identified based on previous price levels where the price has shown a tendency to reverse or find support.
Support levels are represented by the green line and green shade, indicating areas where buying interest may emerge to prevent further price decline.
Resistance levels are represented by the red line and red shade, indicating areas where selling pressure may arise to prevent further price increases. Traders often consider these levels as potential buying or selling opportunities.
Breakouts: Breakouts occur when the price convincingly moves above a resistance level (red shade) or below a support level (green shade). A bullish breakout above resistance suggests the potential for further price increases, while a bearish breakout below support suggests the potential for further price declines. Traders pay attention to these breakout signals as they may indicate the start of a new trend or significant price movement.
Disclosure: I am not SEBI registered. The information provided here is for learning purposes only and should not be interpreted as financial advice. It is important to consult with a qualified financial advisor before making any investment decisions. Tweets neither advice nor endorsement.
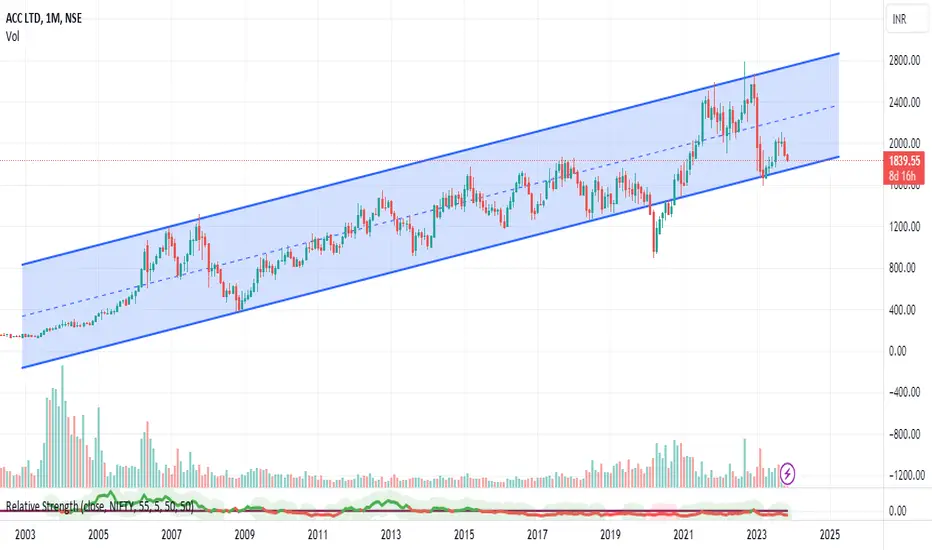
Very limited downside. Look at the upside potentialI am not sure how many days this will take to travel to its parallel channel resistance, but given the way the stock is positioned, the downside looks limited as support is very close and it looks like stock will travel to its resistance at the least. What do you think?
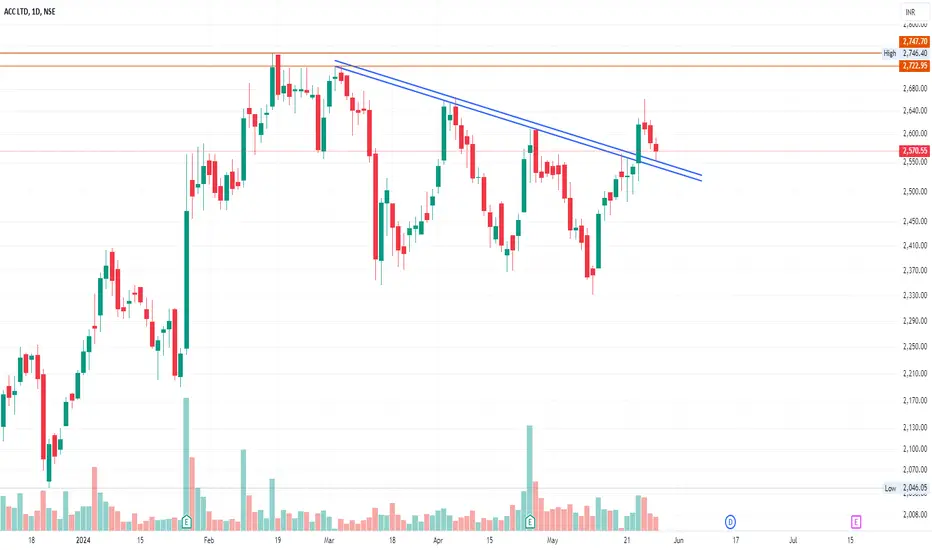
ACC LTD Trade Idea for LongACC LTD has clearly closed above the trendline. Breakout and retest completed.
If this sustains, entry can be made and target is the horizontal TL above, with SL below the last red candle.
first TGT: 2662
second TGT: 2693
third TGT: 2772
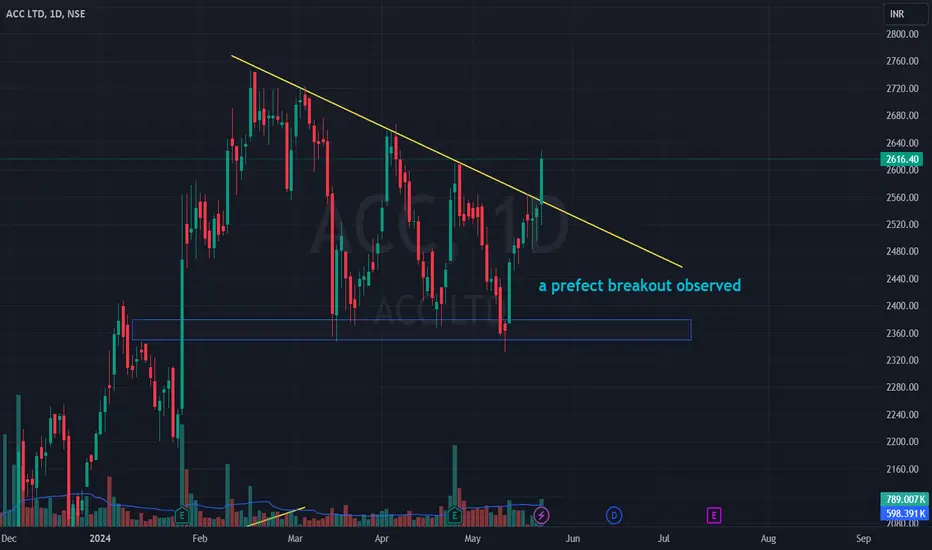
ACC 1DAYa prefect breakout observed.
.
.
.
.
.
.
.
I Am Not SEBI Registered Analyst. All Post and Levels Posting is only for educational and knowledge purpose. I Am not responsible for your any kind of loss or profit.
No Claim, All Rights Reserved.‼️
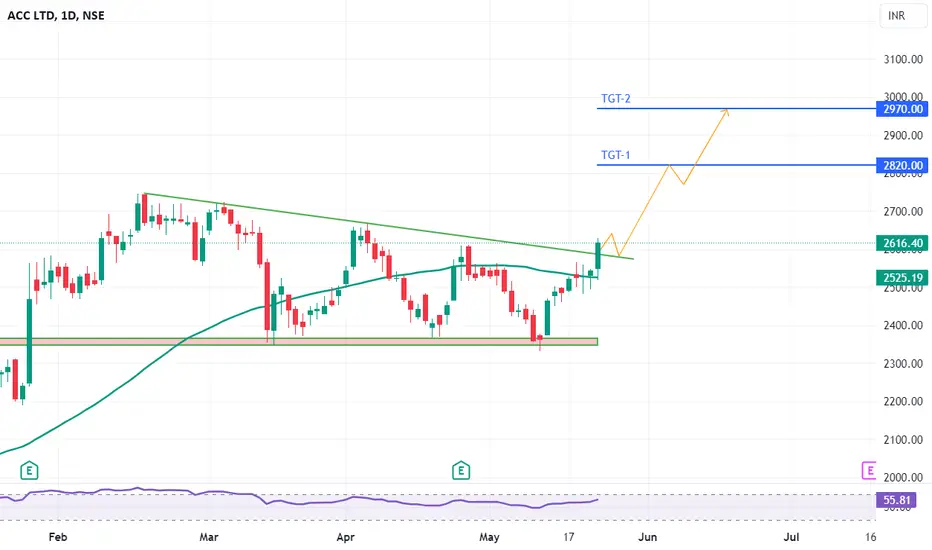
ACCNow it's time to go Long with ACC.
WHY:
- There is a fresh breakout of triangle pattern.
- It is also above 60SMA.
- Conservative traders can wait to cross the level 60 of RSI, but still good to enter.
- All set.
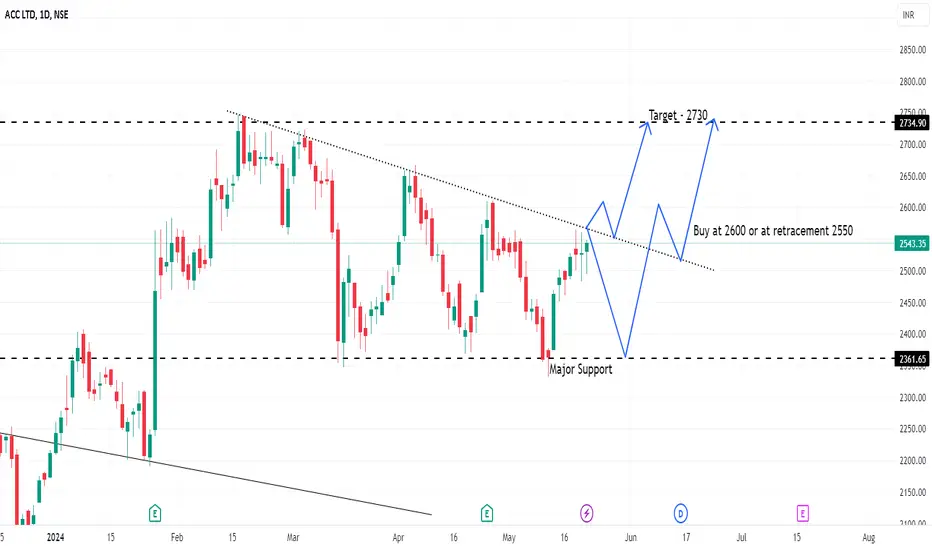
ACC Ltd. (ACC) StrategyThe chart is a daily candlestick chart of ACC Ltd. (ACC) on the NSE, with the current price at INR 2,543.35. The chart shows a descending triangle pattern, highlighting a major support level and potential trade strategies based on key price levels.
Key Observations:
1. Current Price and Trend:
- The current price is INR 2,543.35, showing a slight increase of 0.61%.
- The price is near the upper boundary of the descending triangle pattern.
2. Support and Resistance Levels:
- Major support is at INR 2,361.65.
- Resistance is indicated around the INR 2,600 level and higher at INR 2,734.90 (target).
3. Descending Triangle Pattern:
- The chart shows a descending triangle pattern, suggesting potential for either a breakout or continued consolidation.
- The upper trendline acts as a dynamic resistance.
4. Trade Strategies:
- Buy Strategy:
- If the price breaks above INR 2,600, it signals a potential bullish breakout.
- Traders could buy at the breakout level of INR 2,600.
- Alternatively, traders can wait for a retracement and buy at INR 2,550 for better entry.
- The target for this buy strategy is INR 2,730.
- Sell Strategy:
- If the price fails to break out and moves downward, keeping an eye on the major support at INR 2,361.65 is crucial.
- A break below this major support could indicate further downside potential.
Summary:
The chart of ACC Ltd. indicates a descending triangle pattern, with the current price near the upper boundary. Major support is at INR 2,361.65, and resistance is around INR 2,600, with a target for a bullish breakout at INR 2,730. Traders are advised to watch for a breakout above INR 2,600 for a buy opportunity, with a potential entry at INR 2,550 on retracement. Conversely, a failure to break out and a move towards major support could suggest caution or potential downside risks.
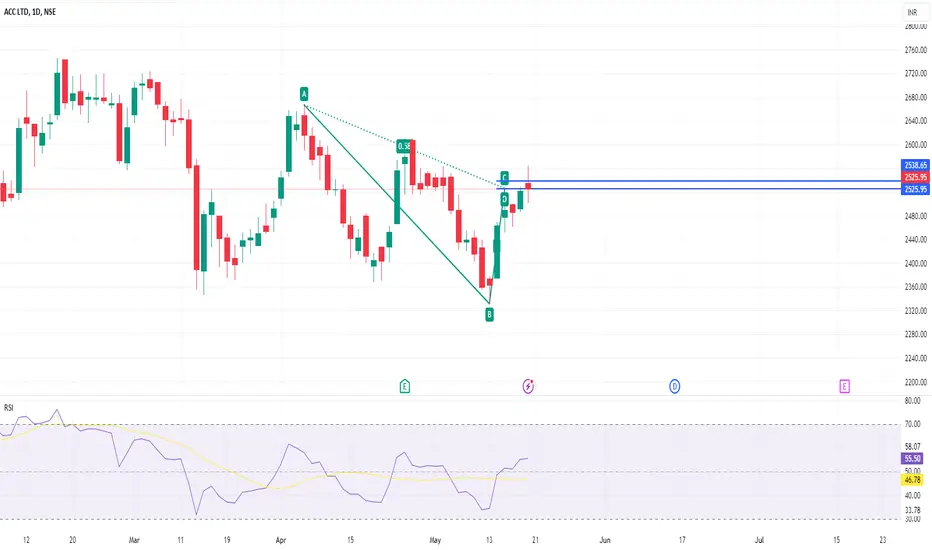
do intraday, sell at zoneexpecting a small fall in that zone .
- sell entry can be took at 0.58 fib level or look for selling confirmation inside the zone.
- sl is day close above 0.618 level
- expecting a small fall , so its suitable for intraday trade
- pattern becomes invalid if candle is closed above 0.618.
this stock already entered zone ,again entry can be taken if u get sell confirmation inside zone.
ACC is looking good for upmoveAs per the study of demand and supply, acc has shown very good upside strength and it has now started retracement. it should start upmove again if price reaches our entry price.

My view on ACCDouble bottom breakdown possible in ACC.
Looking tgt 2360-2340-2300++
Keeping on radar ACC 2380 PE

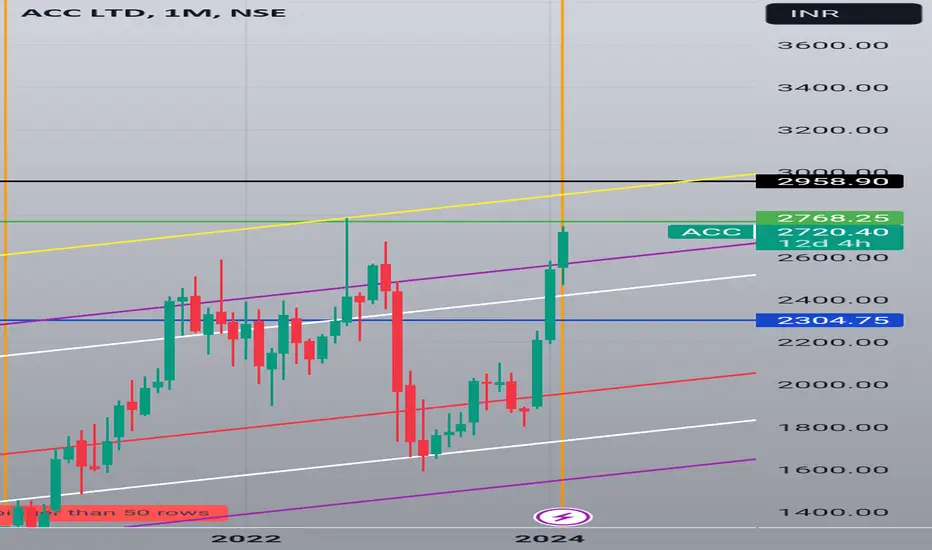
Acc Cement Wait for retracement !!!!Acc Cement Wait for big Move forming Inverted head and shoulder in Monthly time frame !!!!
Wait for good retracements I have mentioned where to buy, keep your trigger
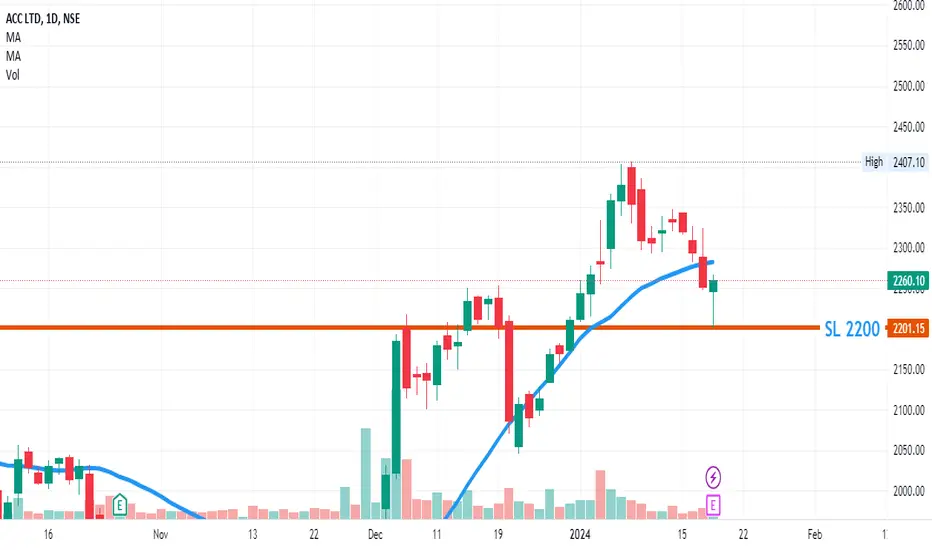
ACC Hammer candle on daily time frame. after touching 2200 (imp support). buying happening on this level and make bullish candle on daily time frame.
buy above today high 2268
SL will be today candle low ----- 2200
First Target will be above 2400
ACC 6000Rs New Ath soonFor option Trader wait for price go down or Take CE poison and hold till March 2024 expiry.
Technical - breakout done -- best opportunity to CE in march month or buy n 2500-2600 range
For more chart analysis comment me in this Post.
ACC will reach 2500 ? cmp 2241ACC broke the weekly resistance levels and trading higher levels
cmp 2241
holding above levels will lead further move upto 2300, 2407, 2523
Technically Bullish and Strong Breakout seen
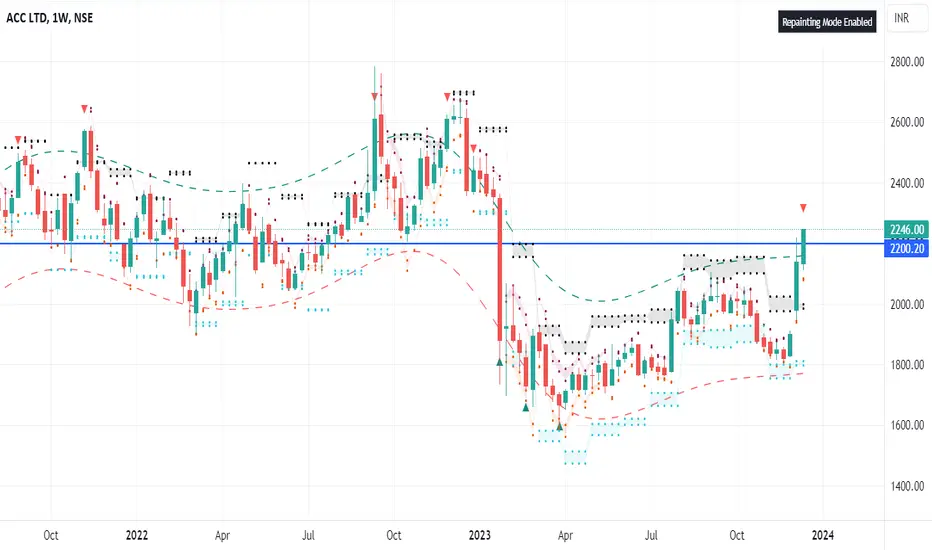
ACC Breakout on weekly chart confirmation in daily chart, retest of old breakout levels
Stoploss : 1950