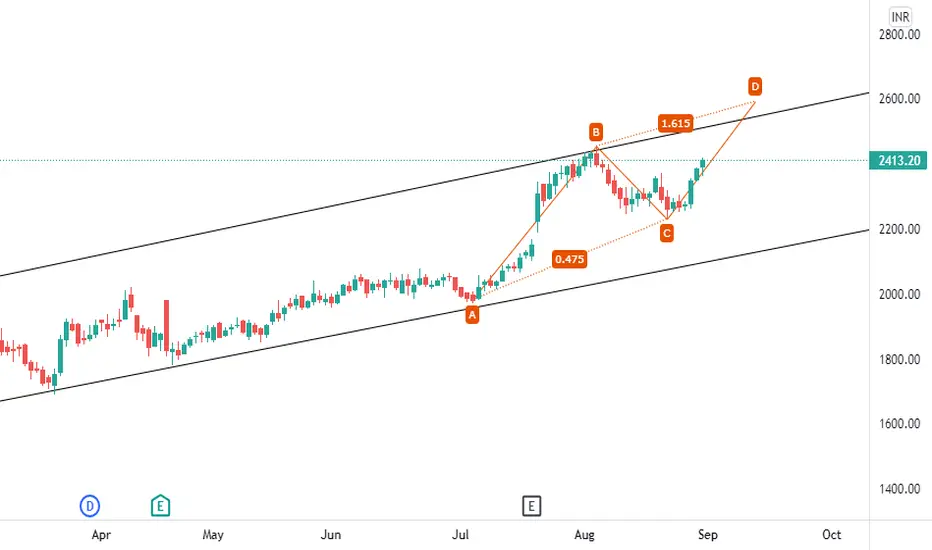
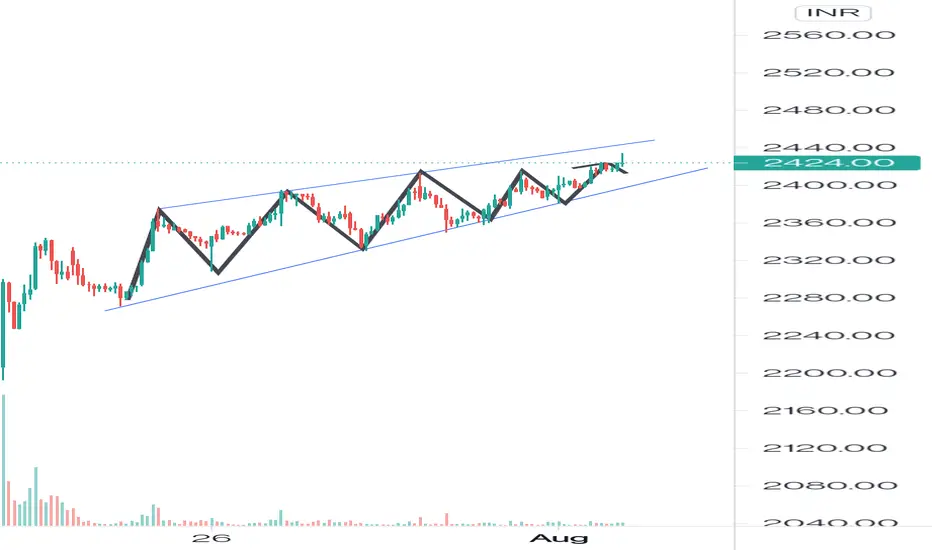
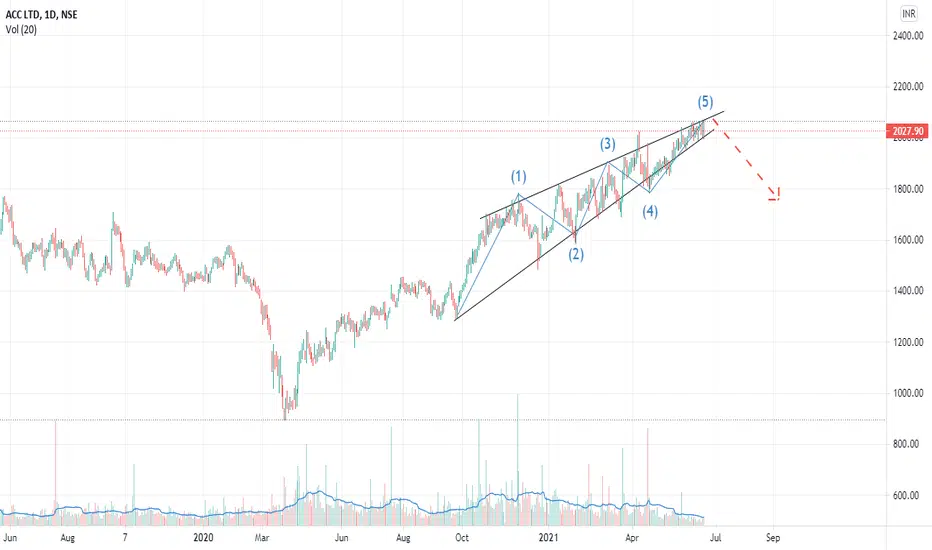
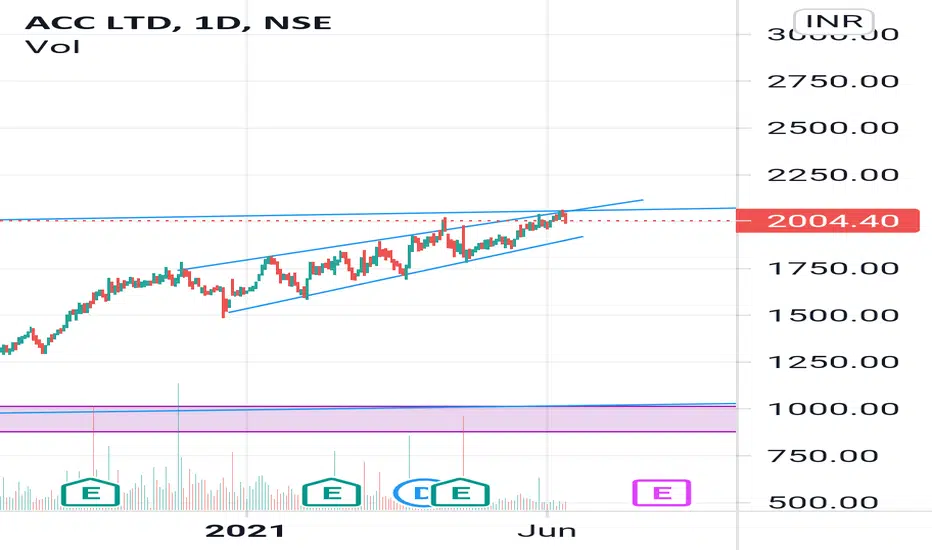
ACC AB=CD PATTERN Hello
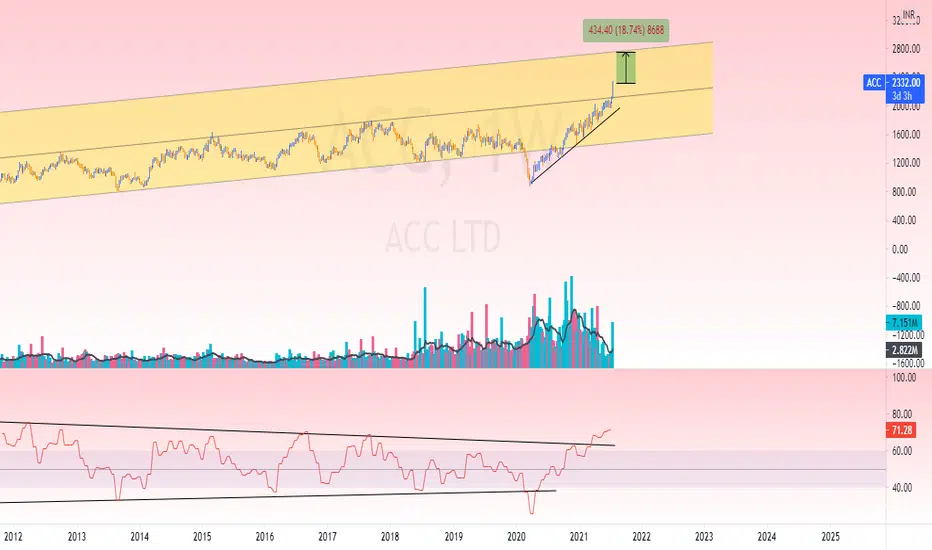
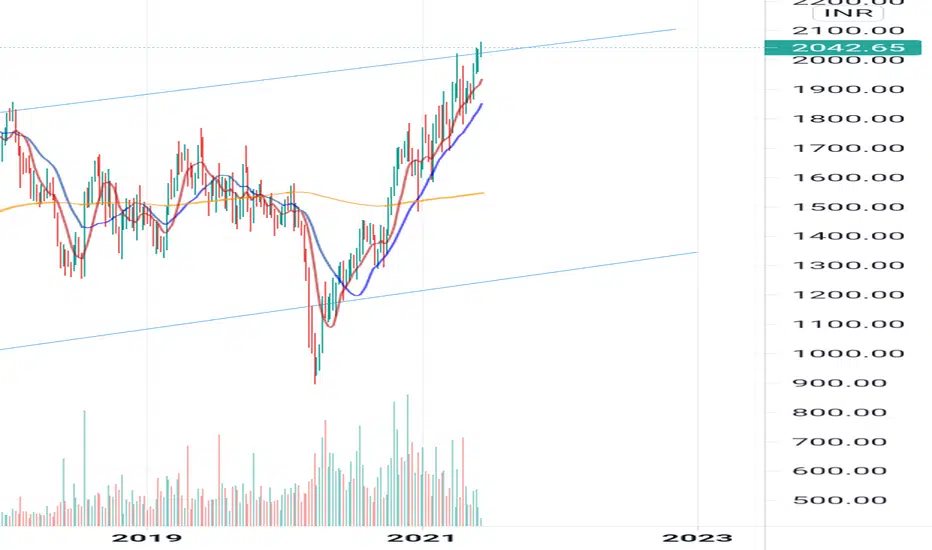
Welcome to this analysis about ACC , we are looking at daily timeframe perspectives. ACC is developing here that will be a decisive factor in the upcoming times. I discovered the main formation ACC is developing here that will be a decisive factor in the upcoming times. As when looking at my chart now we can watch there how ACC has emerged with this key channel pattern & AB=CD pattern marked in my chart with boundaries. which is an important level and also psychological level mark together with the upper-boundary of the channel-formation a pullback
In this manner, thank you for watching my update-analysis about ACCand its major AB=CD pattern with the determining factors we need to consider in upcoming times, support the analysis with a like and follow or comment for more market insight!
ACC trade ideas
Cement Stocks -ACC, ULTRACEMCO, AMBUJACEM -Similar opportunitiesThere seems to be something cooking up in all major cement stocks. Similar opportunities can also be found in related stocks.
One should keep a close watch and can capture short term opportunities.
Do let me know on my social media platforms shared below, which one of them is your favorite.
The above analysis is purely for educational purpose. Traders must do their own study & follow risk management before entering into any trade.
Checkout my other ideas to understand how one can earn from stock markets with simple trade setups.
Feel Free to connect with me for any query or suggestion regarding this stock or Price Action Analysis.

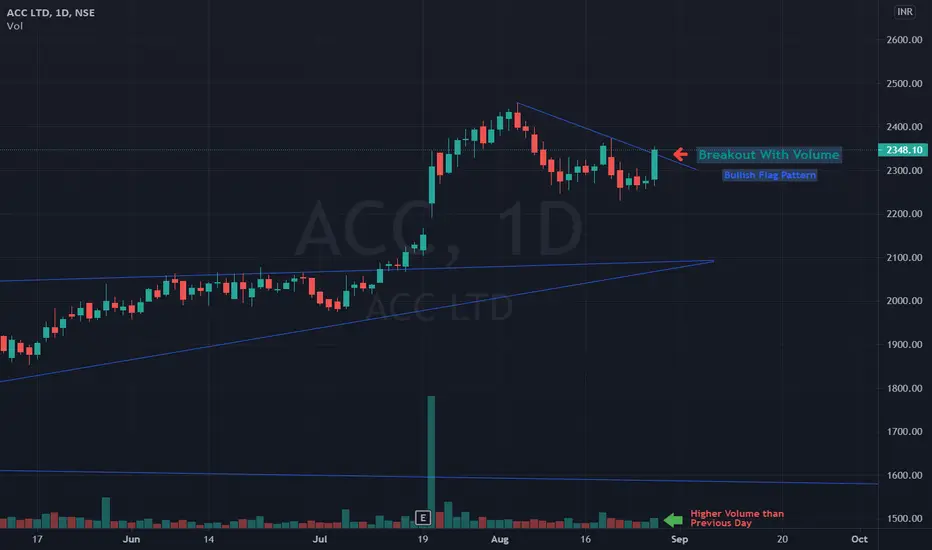
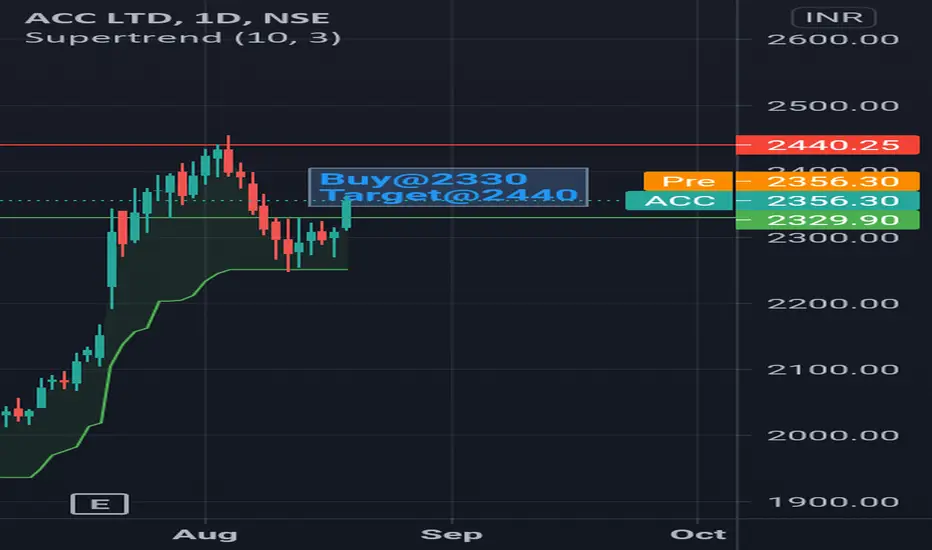
BULLISH FLAG PATTERN: ACC BREAKOUT Hello Traders 😊,
ACC has given a breakout of Bullish Flag Pattern. Its expected for NSE:ACC to move higher in the current Trend.
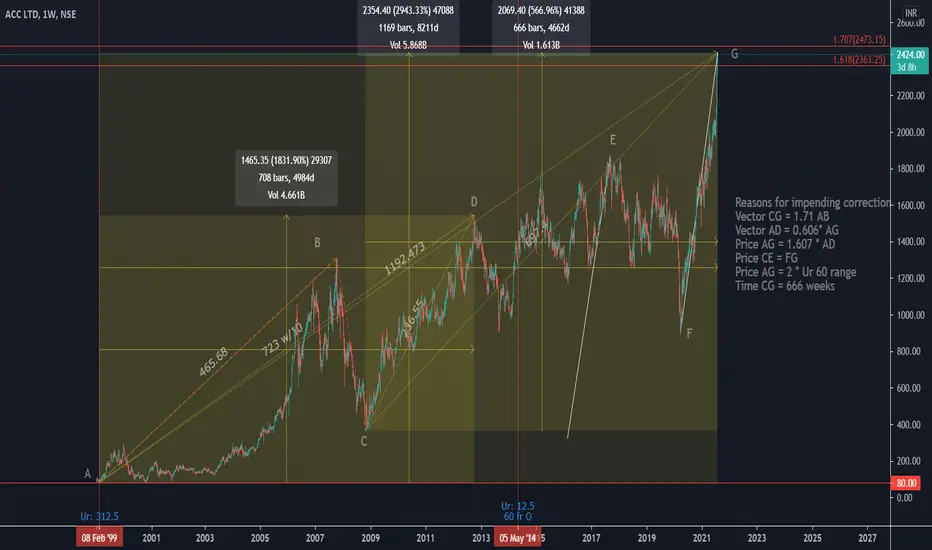
Correction to start in ACC cements this weekHey everyone, As per my analysis, ACC cements is awaiting a good correction. This correction should start by the begining of the coming week or the end of the ongoing week. There are multiple reasons for this which I have documented on the chart itself. In case anyone is interested in knowing the details, please comment and ask. Thanks.
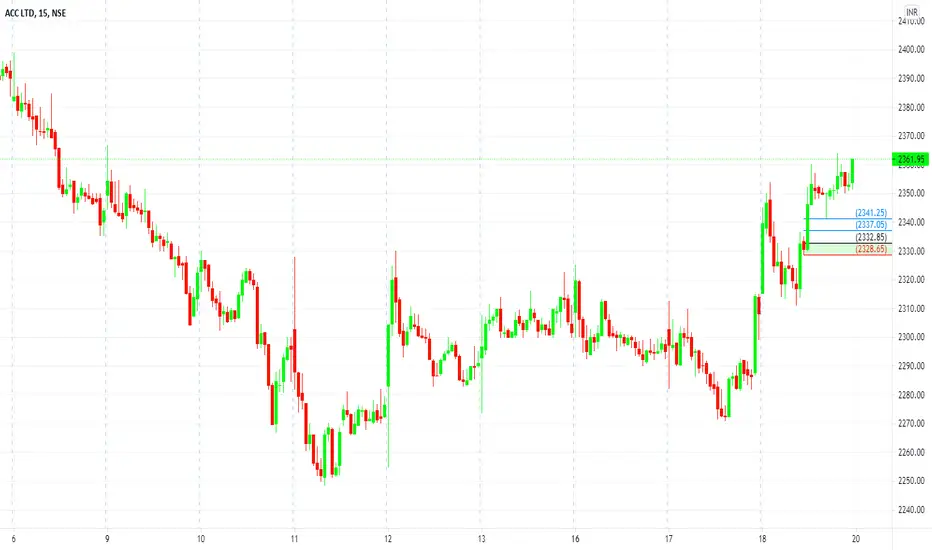
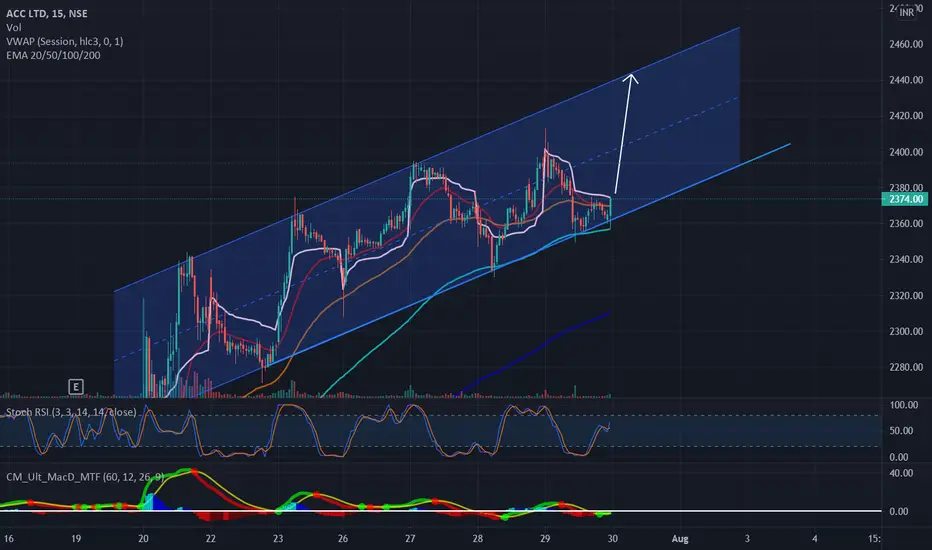
ACC 15 Mins Chart Showing Positive MoveACC is moving in a upward channel. Yes it just hit the lowest point of the channel and bounced back. Today most probably it will be moving up. Even when the market was falling this week, ACC was one of the strong stocks which was giving Green after Green Candle. Wait and watch for first 15 min candle and take your call on Long / Short according to the movement.
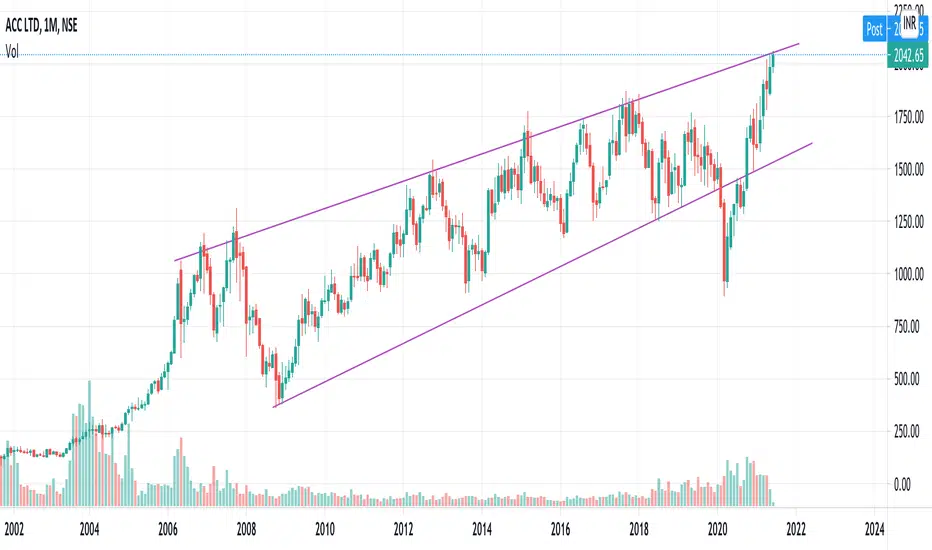
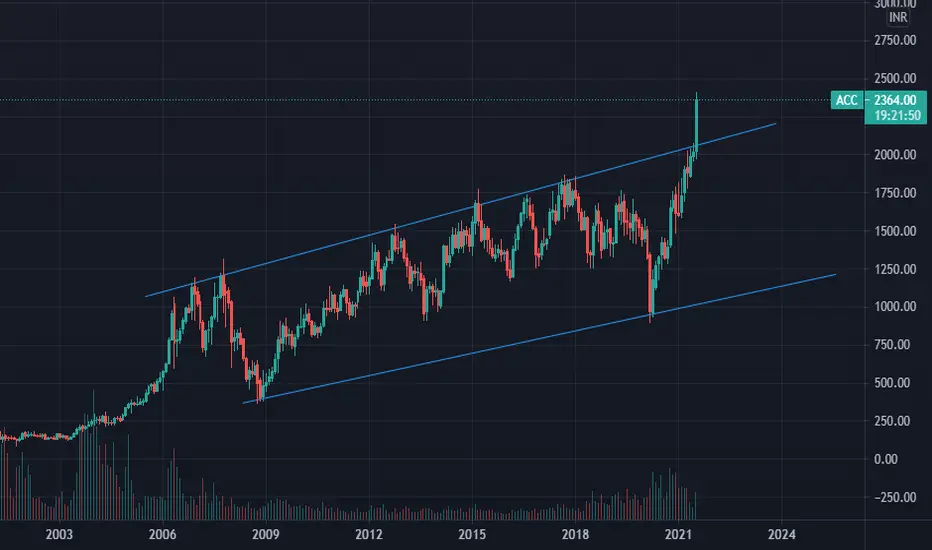
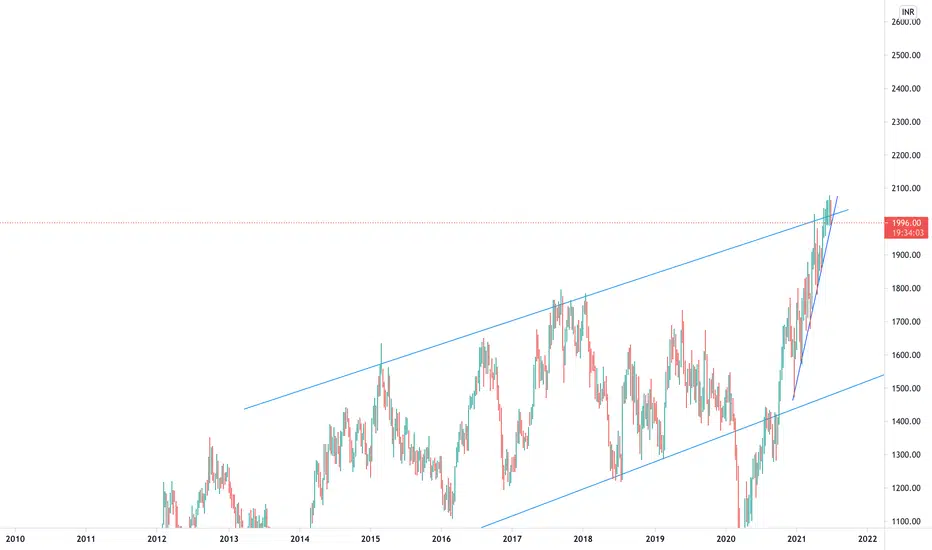
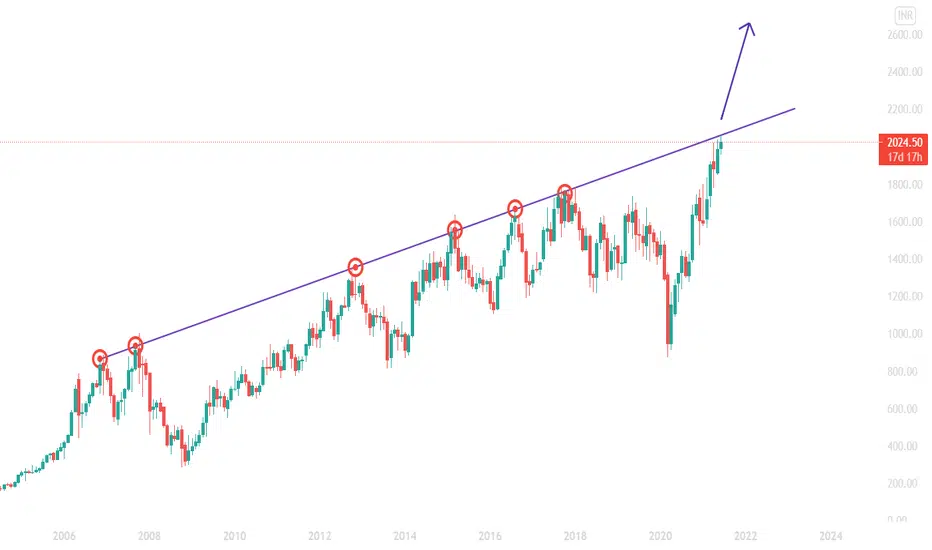
ACC on verge of Multiyear Breakout 1. Multi Year Breakout since since 2006 (15 Years)
2. Two Support at the bottom
3. Multiple Resistance at the top
Wait for 2 days for bullish closing, If it closes without huge wick at the top. Huge move can be expected.
Disclaimer : Just for education Purpose.
Caution before get in to trading.
Thanks Happy Trading :)
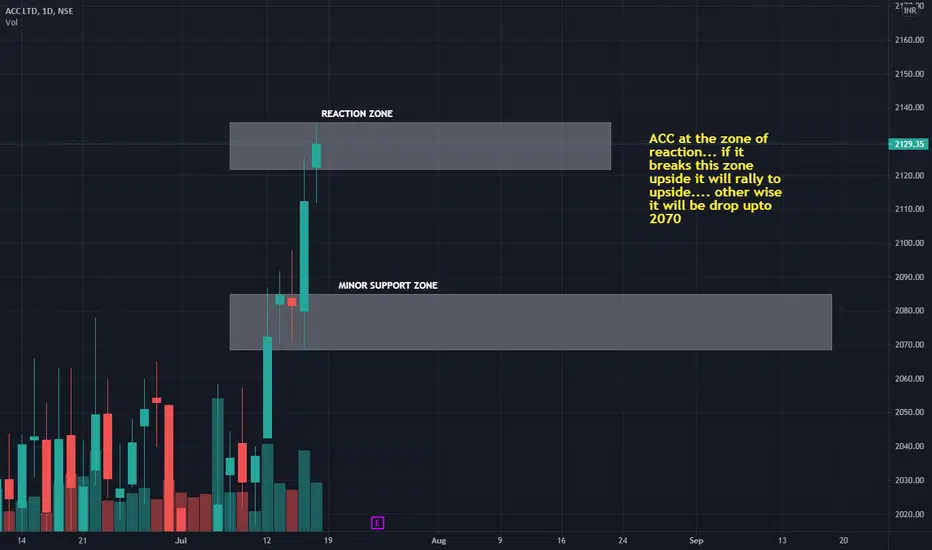
ACC shortACC at reaction zone :
if it breaks the upper zone may be bullish...
But my view is short term bearish : 2070
CMP 2129 / trgt 2070
ACC Look like a break out failure ...
But if you see in daily time frame it is going to touch a trend line...
Once its touches a trend line then there will be a high chances of pull back... If not we can go for short.
Strict SL 1975 , Target 2700..
tradingview.sweetlogin.com
Disclaimer: I am not SEBI registered analyst.My studies are Educational purpose only.Please consult with your Financial advisor before trading or investing..
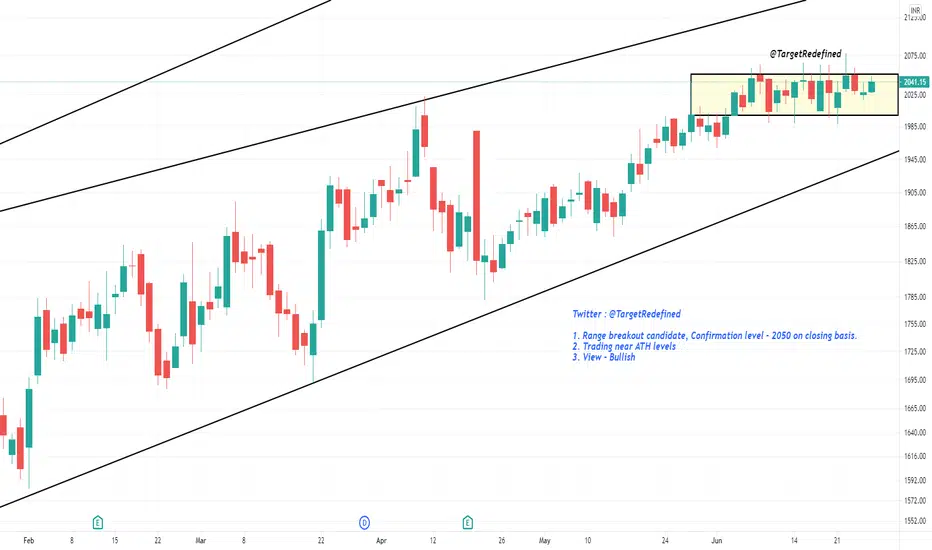
ACC - Range breakout candidate, Confirmation level - 2050 OCB1. Consolidation range breakout candidate, Confirmation level - 2050 on closing basis.
2. Trading near ATH levels
3. View - Bullish
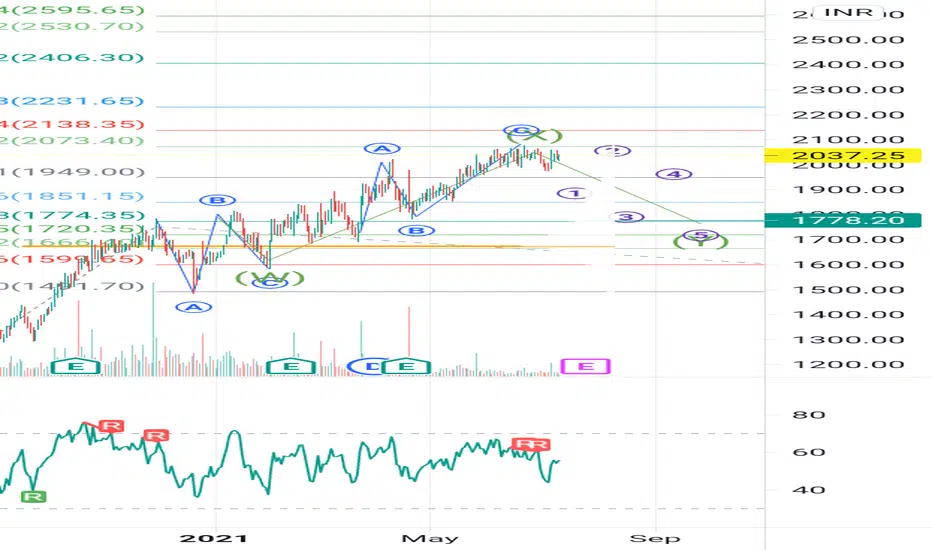
ACC is it time for correction ?ACC: seems like it is finishing last wave of motive wave and formed ending diagonal. Is it ready for correction ???
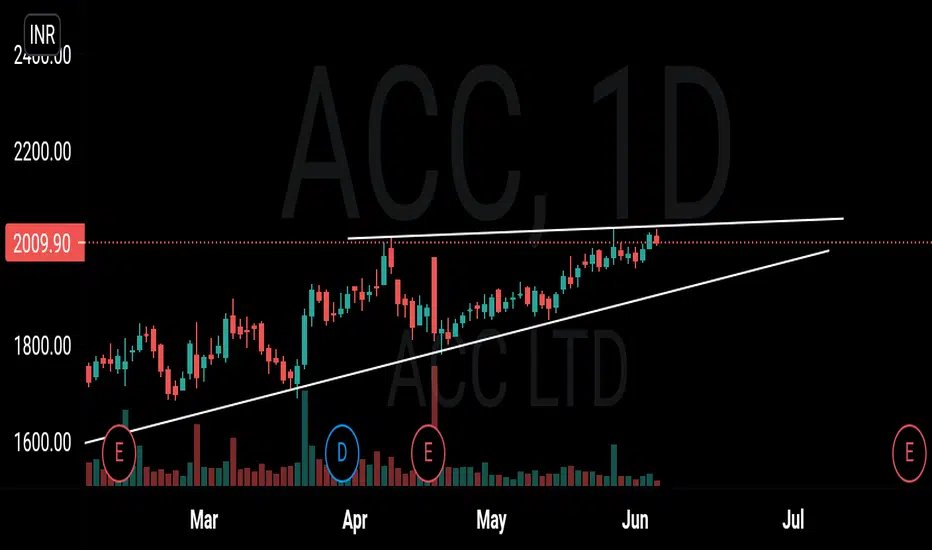
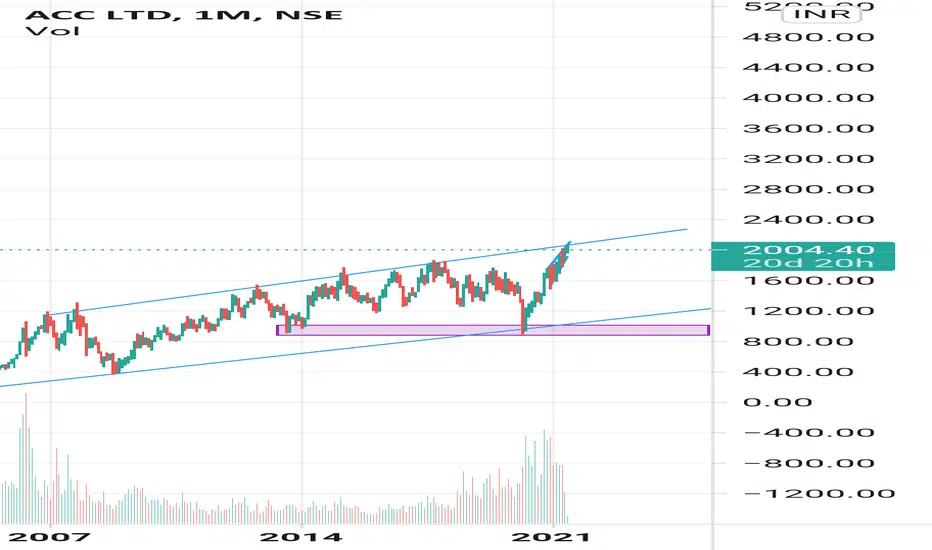
ACC - on the verge of breakout after many yearsACC taking the resistance for many years in the Trendline.
can go for buy when Price closed above the trendline.
MULTI-YEAR BREAKOUT
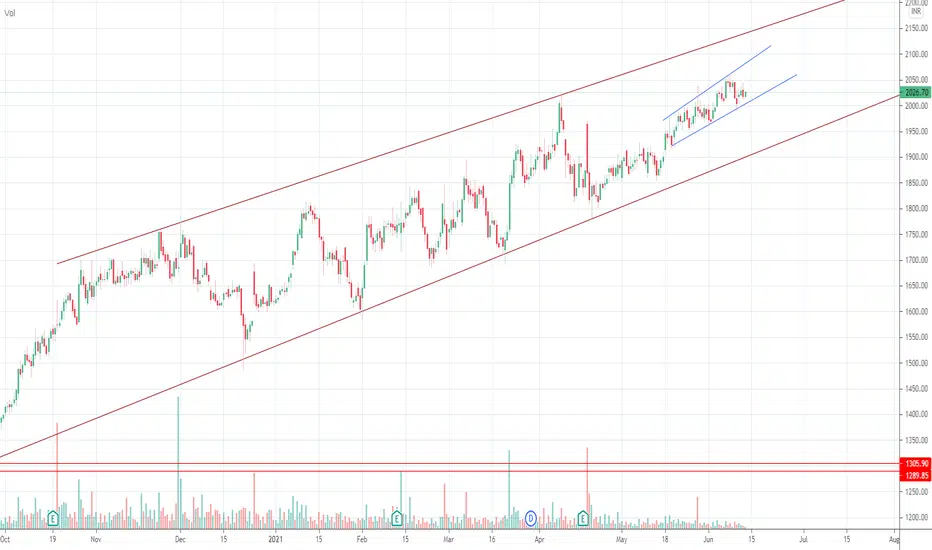

Bullish on ACCACC is working in this channel for the past 10 or more years, now the breakout happened and it has retested as well from that channel, we can expect a big move. Buy if two 15 min candles closes above 2060. The price is above the 8, 20, 200 SMA. There is no particular target, do the trailing stoploss. If the price goes down from the moment u buy, the stoploss will be 2010. Please do your analysis before you buy and think twice before you invest. Thank You.
ACC BreakthroughACC looks awaiting for a trend breakout on the larger timeframe. If it can cross Rs 2100 with velocity and a stop loss of Rs 2000 might, the risk:reward management is decent enough.