Asian paint looking good for shortingafter consistent up rally stock should take a pause between 3000 to 3200, I don't think stock could go up from here because its already been stretch a lot its been five days stock is going up And now fed report came and its slightly negative so my view is downward for some days until its beaks 3200 because here resistance on weekly chart I know crude prices are falling but that not how market should work right, commodities are different its take time commodities supply and demand gap can not fill in just week it takes time that is reason why prefer selling position in intraday btst for monday . FOR swing traders its great opportunity to add if its retrace to 200 ema and got support at 3000 u can add some qt to your account for long term the long term view of this stock is bullish as per its fundamental and past history chart analysis i think its better to avoid building new bullish position unless its retrace a little bit thank you
ASIANPAINT trade ideas
BUYING OPPORTUNITY Buy 2670-2680 target 2750 SL 2645- DKM SIR
I can see the bounce back from here
Buy and hold as per your risk
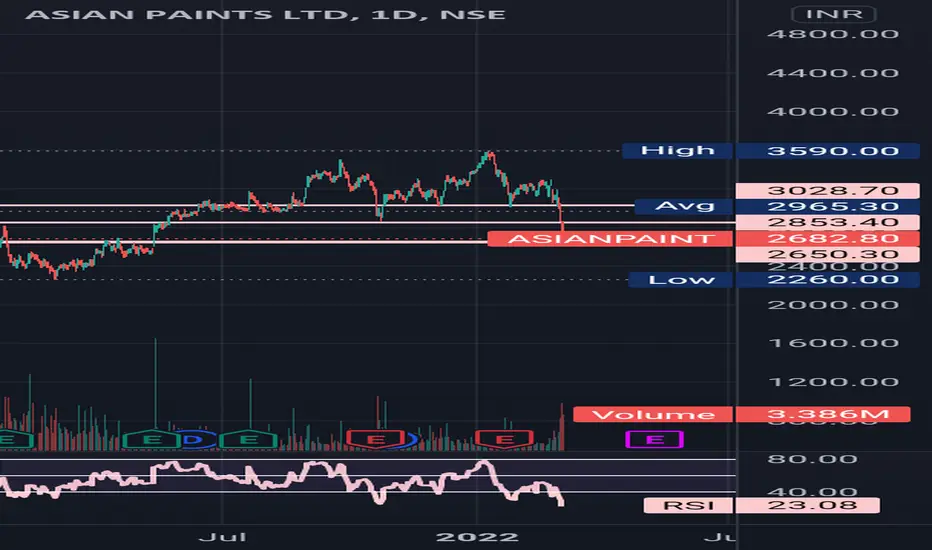
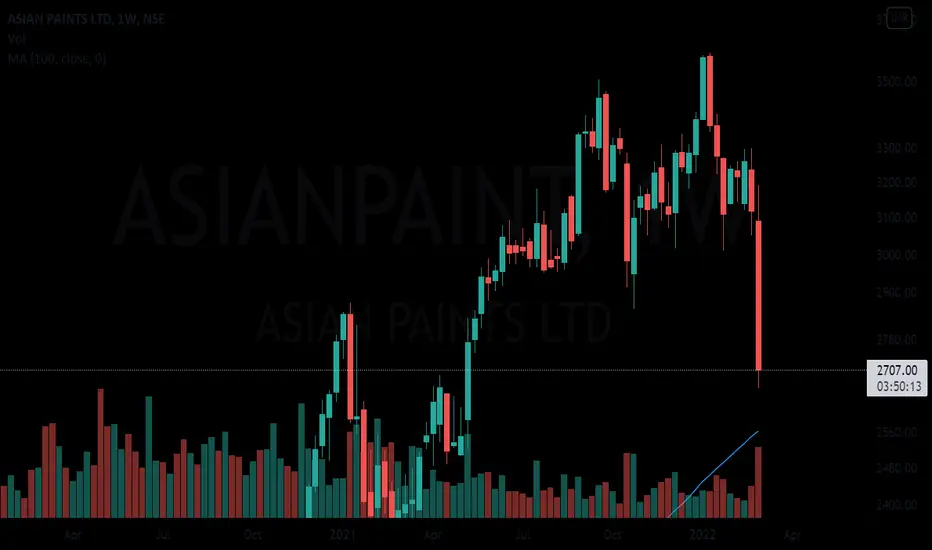
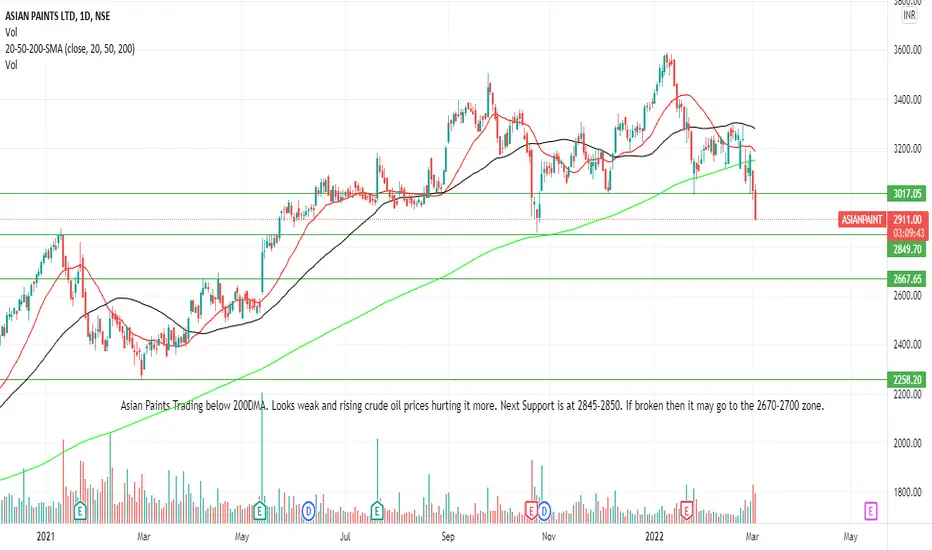
ASIAN PAINTS WEAK - Broken Key LevelsAsiab Paints have broken all its key moving averages levels. Rising Crude Oil prices hurting it more. No fresh buy is recommended at this level. No, Any Strength was seen. keep an eye on the 2845-2850 zone.
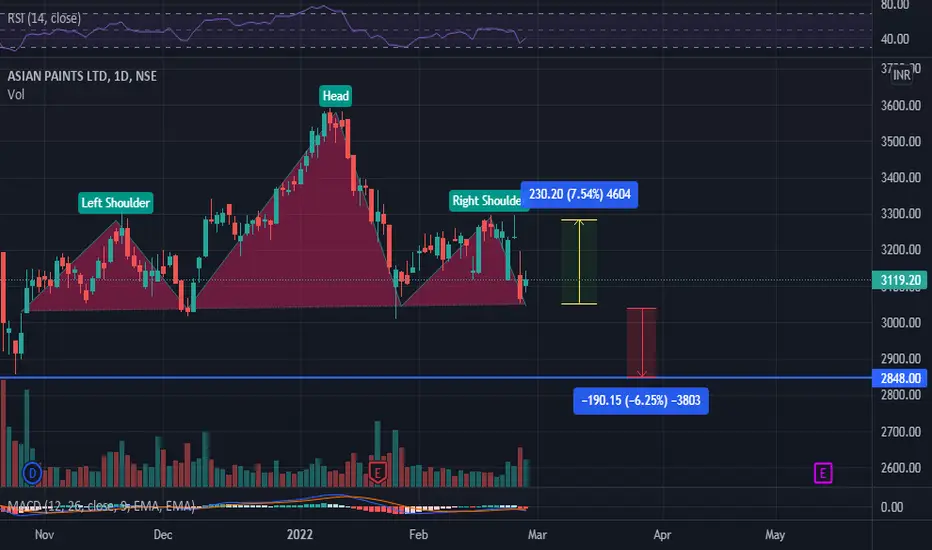
Asian Paint's next movement As per my view 2840 will be the next target... Because Head and solders pattern create at day time frame...
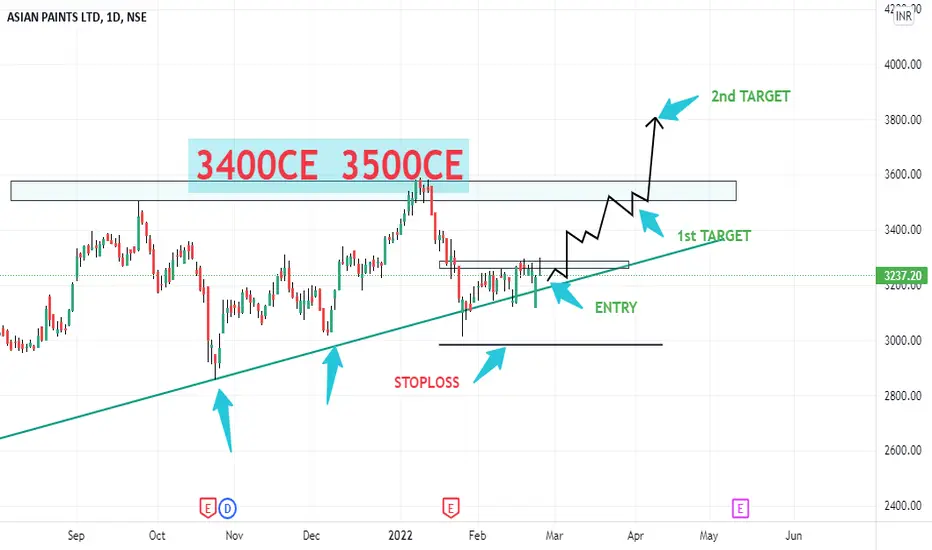
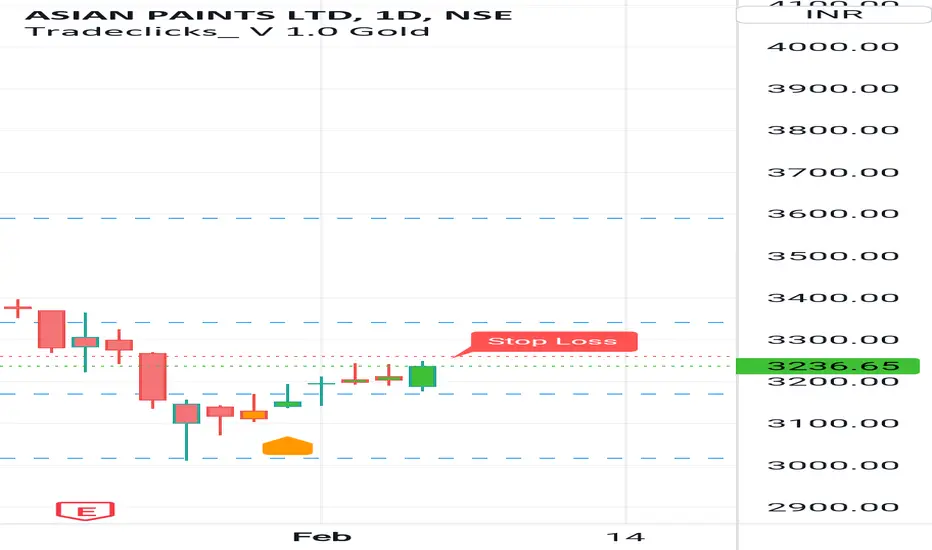
Asianpaint 3400CE 3500CEAs of 23 February ASIANPAINT closed at 3237. If you look at the chart the stock is trading above the TRENDLINE. There is small RESISTANCE area between the price of 3262-3282.If it consolidate between the TRENDLINE and the RESISTANCE area for next 2-3 days then after that it can give a UP side momentum.
If we look at the price of March 3400CE is trading at 40 and 3500CE is trading at 21. Adding one lot each which will cost around (6000+3135) 9135. It can give more than 100% return.
STOPLOSS- If the main TRENDLINE broken exit the position
TARGET- If the spot gives a high of 3% exit the 3500CE and book profit and hold 3400 CE
DISCLAMIER-
THIS IS JUST FOR EDUCATIONAL PURPOSE,DO CONSULT YOUR FINANCIAL ADVISOR BEFORE TAKING POSITION
WILL KEEP UPDATING.......KEEP FOLLOWING...
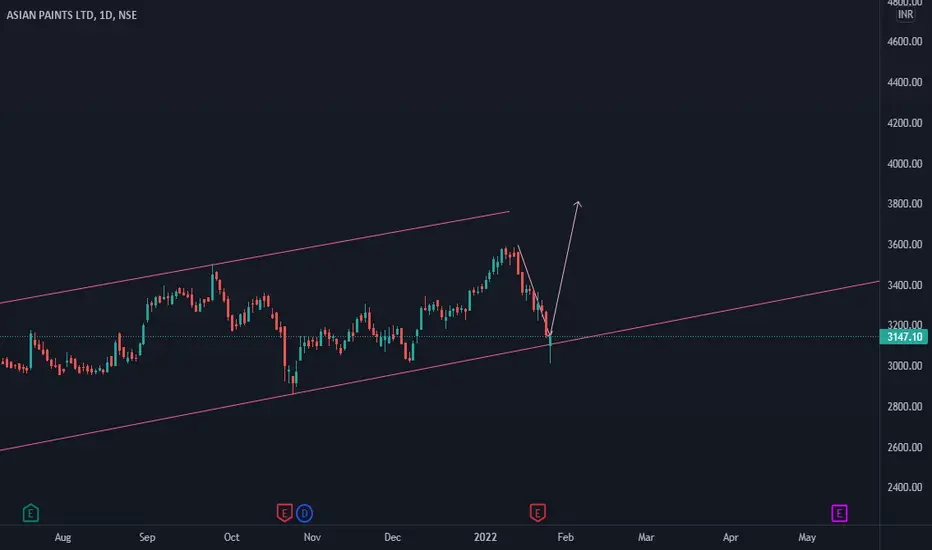
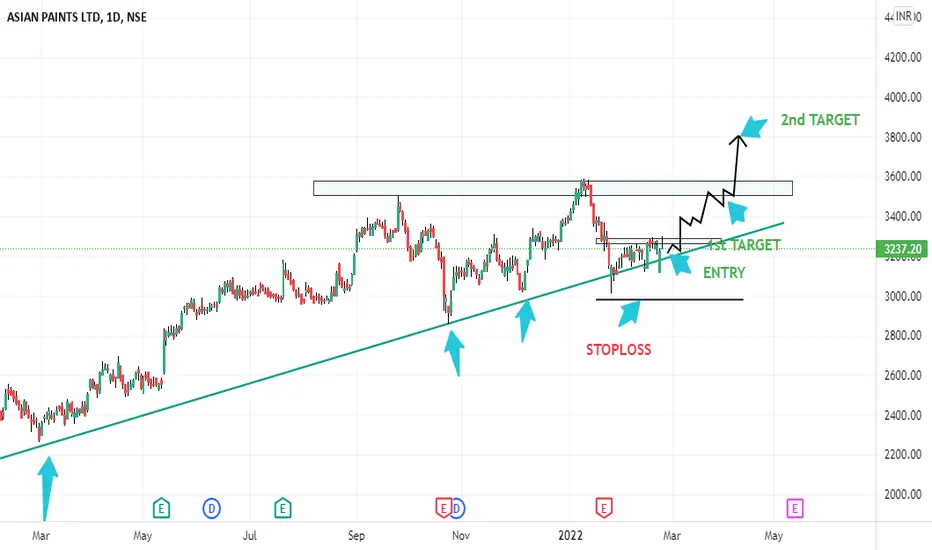
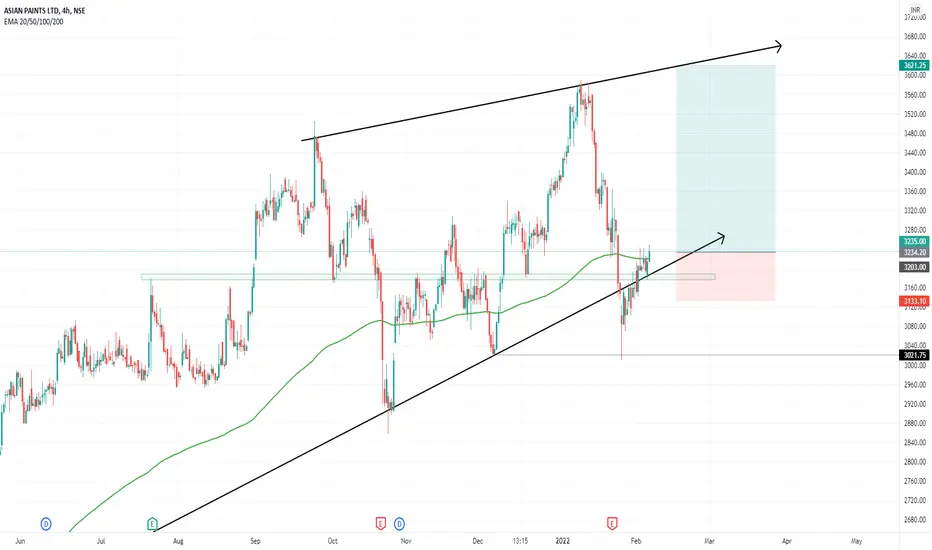
ASIANPAINT Trade OpportunityAs of 23 February ASIANPAINT closed at 3237. If you look at the chart the stock is trading above the TRENDLINE. There is small RESISTANCE area between the price of 3262-3282.If it consolidate between the TRENDLINE and the RESISTANCE area for next 2-3 days then after that it can give a UP side momentum.
NOTE-
ENTRY-3190-3264
STOPLOSS- 2980
1st TARGET- 3470 (8%)
2nd TARGET- 3800(16%)
DISCLAMIER-
THIS IS JUST FOR EDUCATIONAL PURPOSE,DO CONSULT YOUR FINANCIAL ADVISOR BEFORE INVESTING.
ASIANPAINT buy for intraday tradingASIANPAINT buy for intraday trading if stock break the channel...........
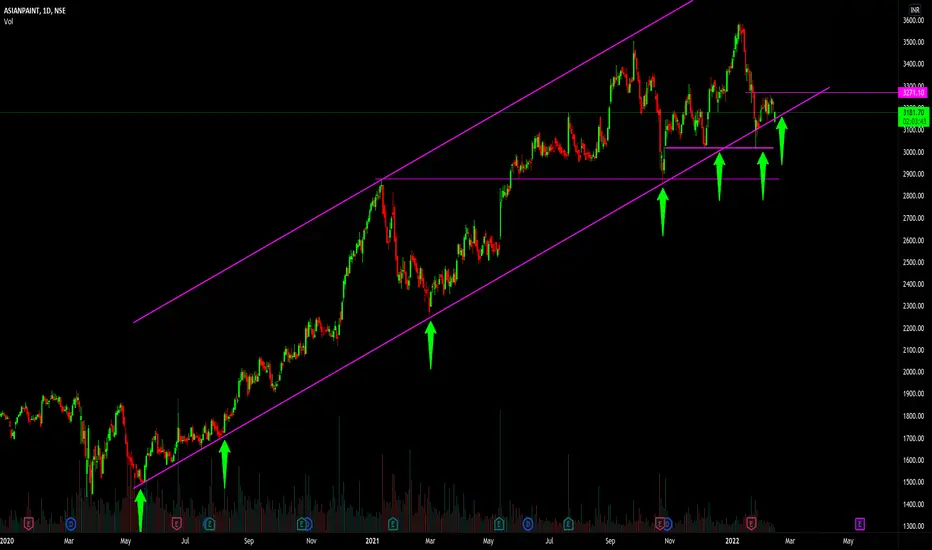
Asian paint buy and hold Asian paints chart
The stock is supporting the lower channel from long time.
Few days back the stock traded below the channel but we have seen a sharp bounce next day.
Today again the stock open gap down due to global sell off.
As long as today low holds we can see 327, 3340, 3480 level.
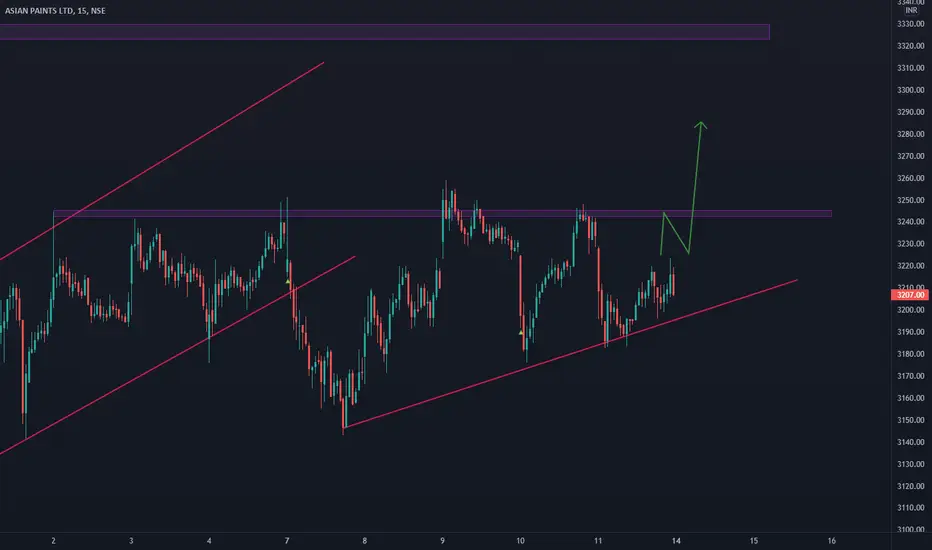
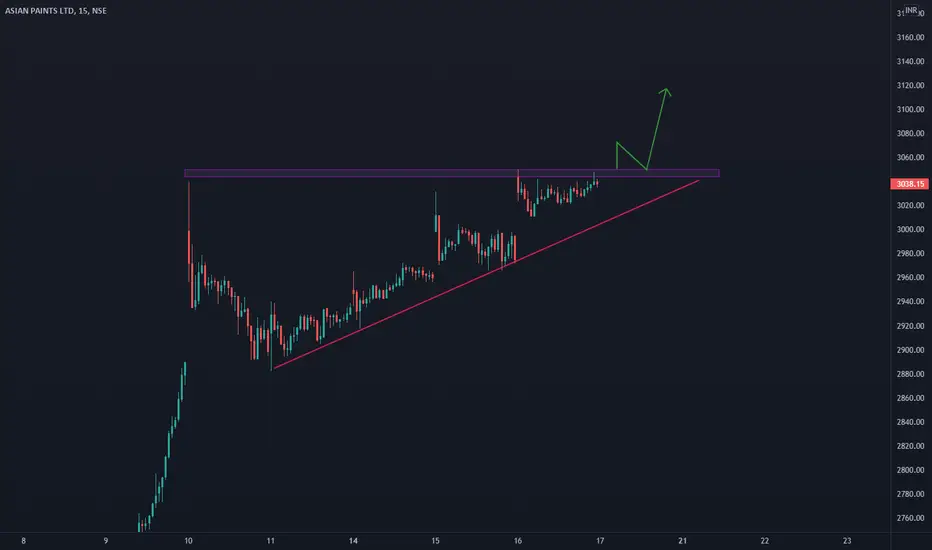
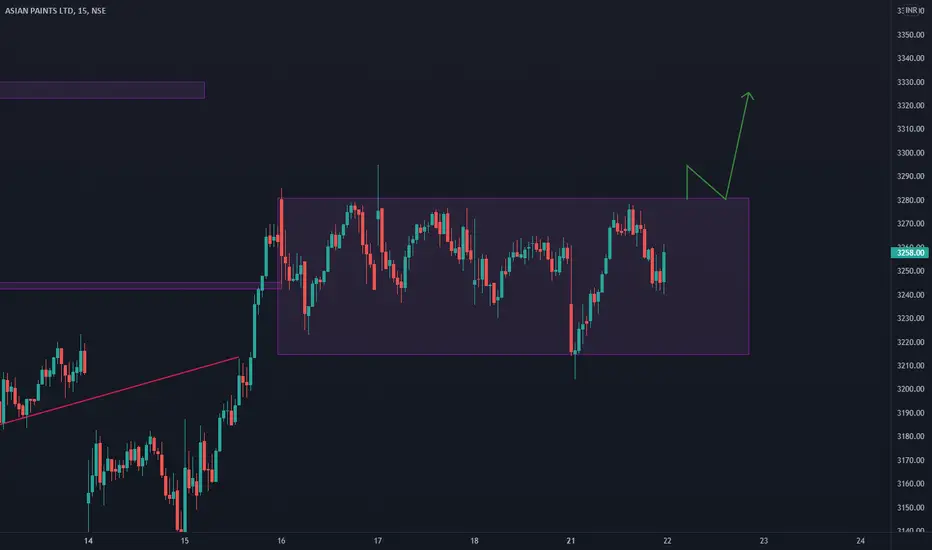
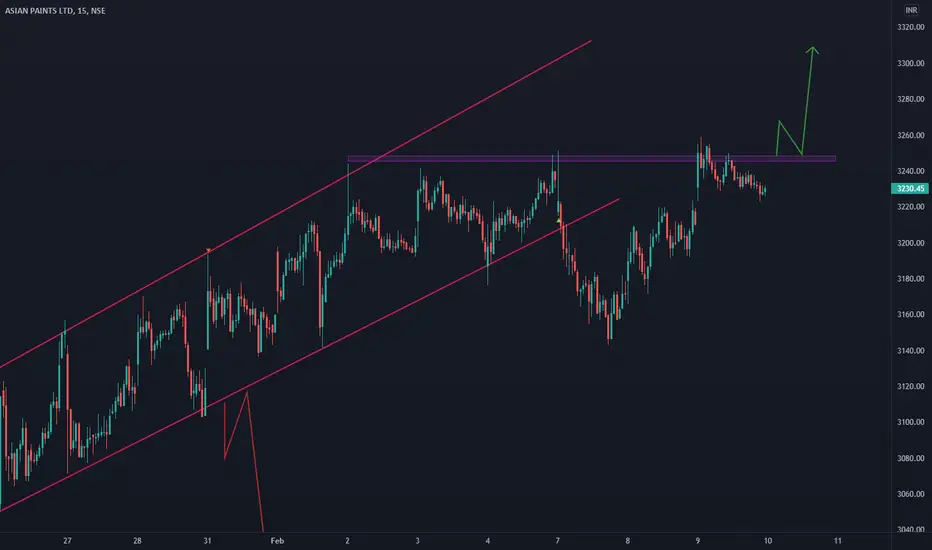
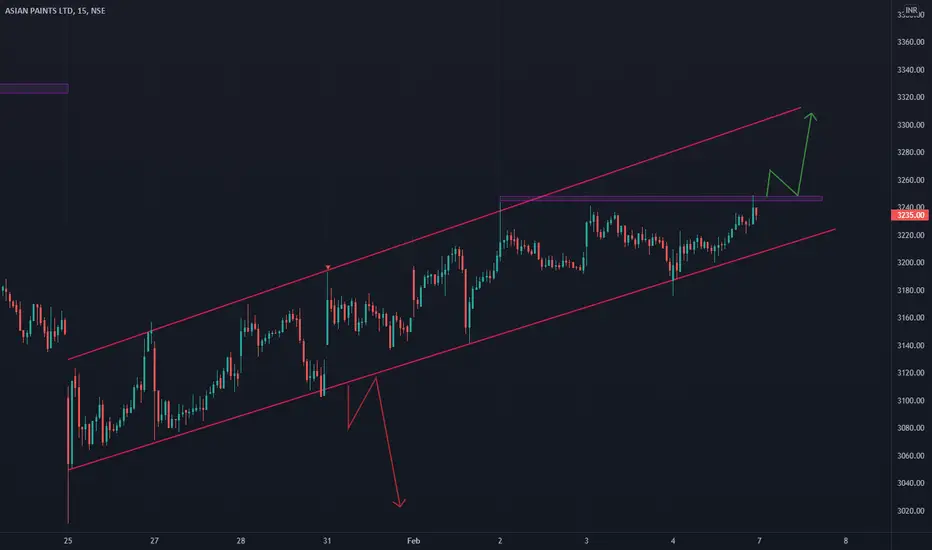
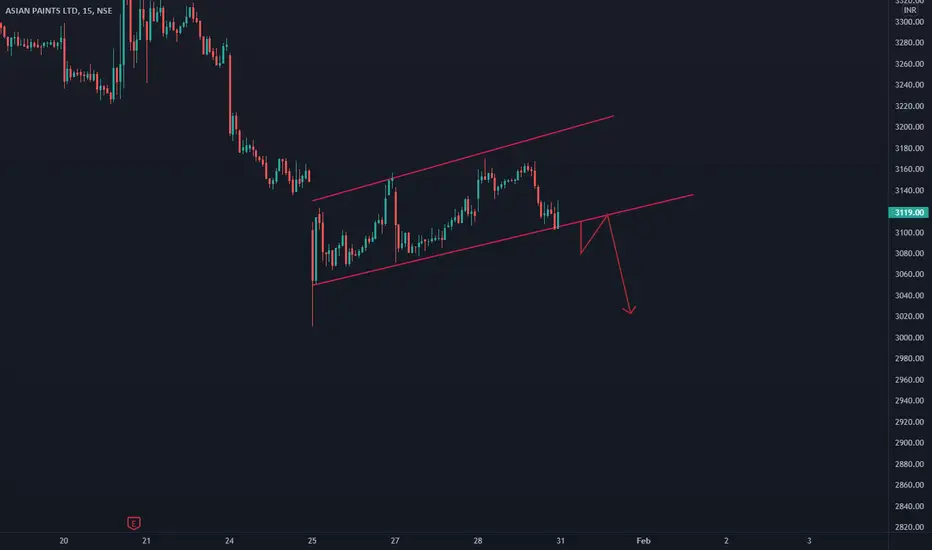
Wait for breakoutin 1 Hr TF, if price break trendline and give hard close after breakout we can see nice movement...
This means if the orange line breaks and make a complete white candle after breaking, the orange trend line then we can expect a nice upward movement.. or we can test pink or orange trending before a big upmove and similarly, if pink break and nice blue candle formed outside it then we can expect nice down movement, or before move down we may test pink or orange trend...
ASIANPAint buy for intraday tradingASIANPAint buy for intraday trading if market open in green...........
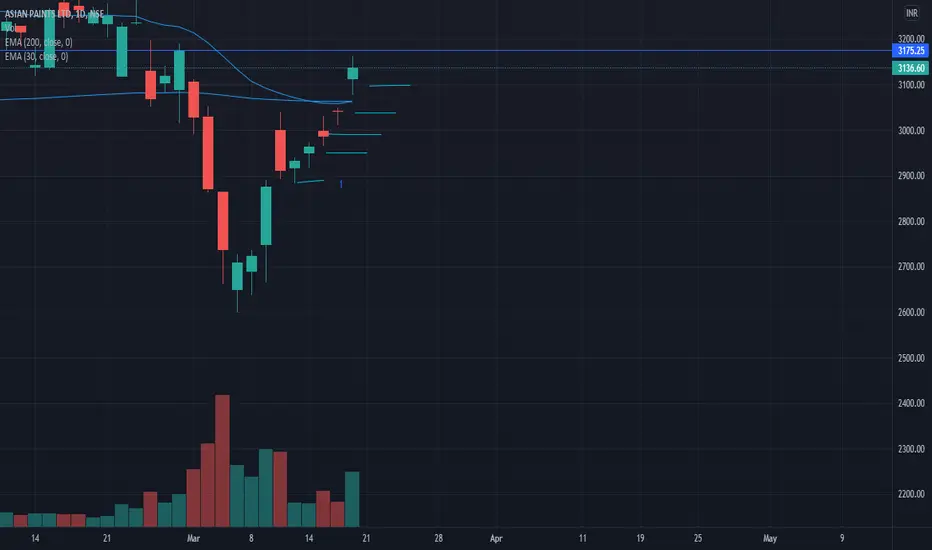
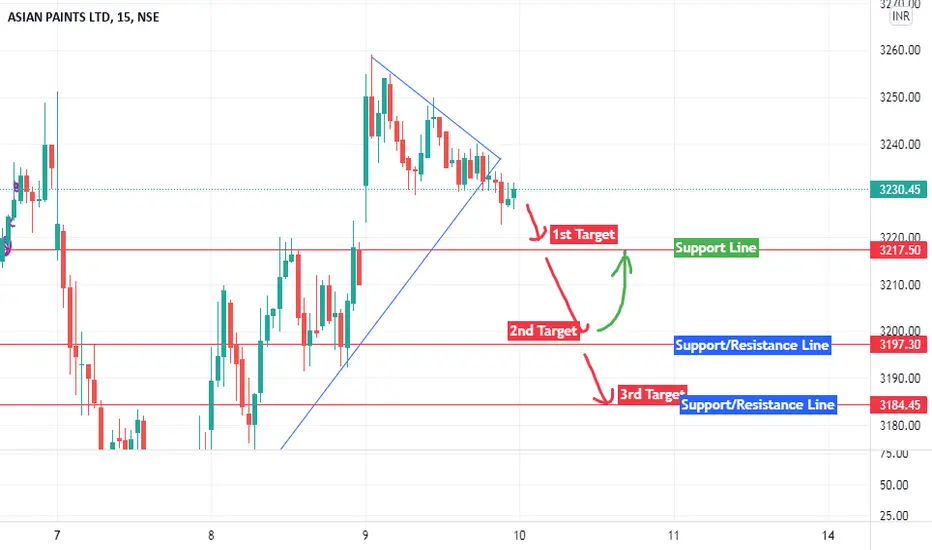
Asian Paint Intra Day Trading StragetyAsian Paint Intra Day Trading Stragety
Asian Paint Stock is falling down
Bajaj Fiserv will go BOOM!hey guys you can buy Bajaj Fiserv at 15180 and can do long in intraday if the day give confirmation. #GoSelfMade
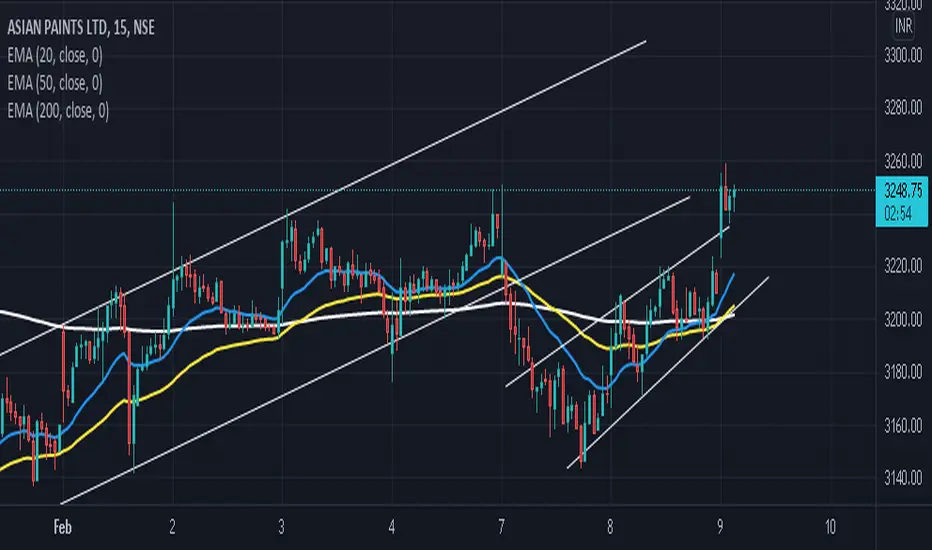
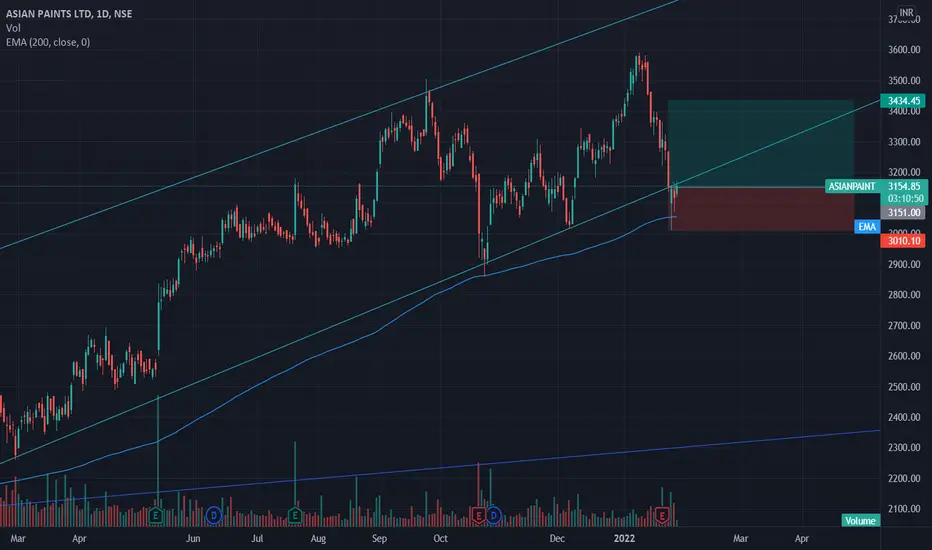
#ASIANPAINTSHello,
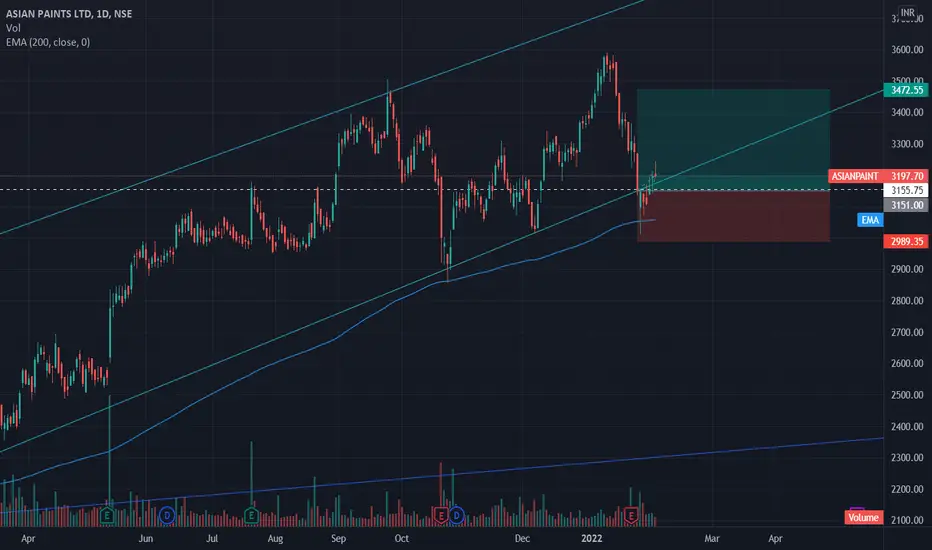
Here I found A beautiful swing trade on Asian paints on a daily time frame. Lets see my trading setup
1-) the stock is in strong uptrend so I'm going in right direction
2-)A good support area plus a trend following 200 day moving average on which price closed yesterday
3-| A fake breakdown which means who ever shorted Asian paints their stop loss has been Triggered.
Pidilight buy @ 3260 Target 3600Pidilight buy @ 3260 Target 3600.
Hello Traders, its an idea to get education purpose only
Asian Paints ReversalThe stock has reached lower trendline and may undergo a reversal rally. Trade is supported by brokerage calls and Supports Nearby.
Risk Reward Ratio - 2:1
SL is placed below support zone & the lower trendline. The target is placed near resistance.
Asian Paints ReversalThe stock has reached lower trendline and may undergo a reversal rally. Trade is supported by brokerage calls and Supports Nearby.
Risk Reward Ratio - 3:1
SL is placed below support zone & the lower trendline. The target is placed near resistance.
Market is bearish, so take positions carefully.