Ather Energy Breaks Out! What's Fueling the 13% Surge..?Since its stock market debut, Ather Energy had been gliding within a smooth upward channel until something major shifted this week. On the back of stellar Q1 FY26 results, the stock did something bold:
✅ Broke the channel
✅ Shot up 13% in a single day
✅ Hit a fresh 52-week high near ₹394
So, what’s driving this electric rally? And more importantly, what’s the next smart move for investors ?
🔍 Q1 Results: Narrower Loss, Explosive Growth
On August 4, 2025, Ather Energy dropped its first earnings report post-listing, and the numbers turned heads:
* 📉 Net loss trimmed to ₹178.2 crore (vs. ₹182.9 crore YoY)
* 🚀 Revenue surged 79% YoY to ₹645 crore
* 🔋 Vehicle sales jumped 97% YoY to 46,078 units
* 🛵 Family scooter “Rizta” became a hit, now 60% of total sales!
Management also highlighted better cost control, improved operating efficiency, and a margin boost of nearly 1,700 basis points YoY — a sign the business is scaling fast without burning as much cash.
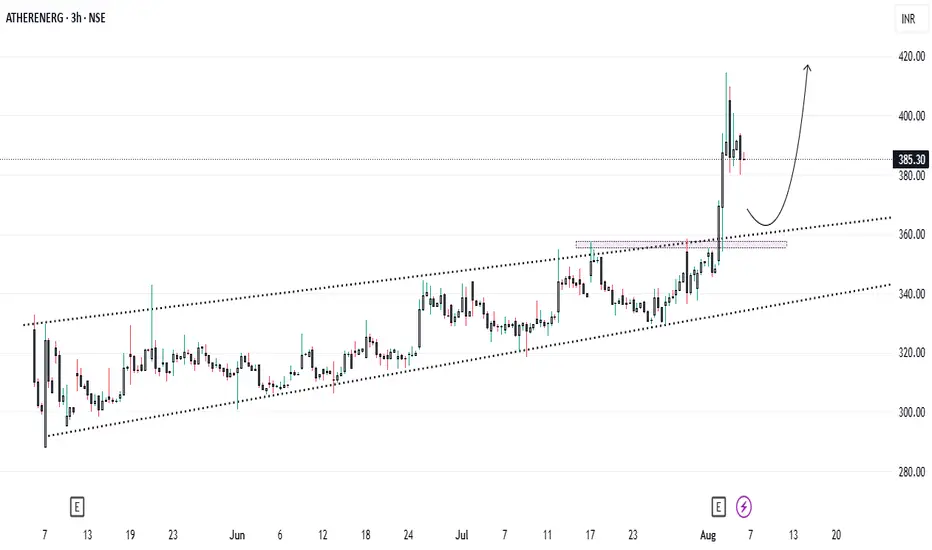
📈 Chart Talk: Breakout Confirmed, Entry at ₹357 ?
Technically speaking, Ather had been moving in a classic ascending channel since its listing. But the Q1 numbers triggered a powerful breakout:
* ✅ Channel resistance broken
* ✅ Huge bullish volume
* ✅ Momentum carried the stock to ₹394 intraday
Now, for those waiting on the sidelines, the ideal entry opportunity could come around ₹357, where:
* The previous resistance could act as new support
* It aligns with 38–50% Fibonacci retracement
* A healthy pullback may offer a low-risk, high-reward setup
📊 Analyst View & Expansion Strategy
* 🏬 **95 new experience centers opened in Q1
* 🌍 Market share expanded to 14% pan-India, 22% in South India
* 🏦 HSBC initiated coverage with a ‘Buy’ rating and ₹450 target
Even amidst tough EV competition (Ola Electric, TVS, Bajaj), Ather is building a tech-driven moat with strong brand equity, energy-efficient performance, and now promising financials.
⚠️ What to Watch Out For
* 🔧 A temporary rare-earth supply disruption due to China’s export policy — management says risk is under control.
* 🧾 Still **not profitable, so long-term earnings trajectory needs close tracking.
* 🔋 EV sector competition remains fierce; execution will be key.
📌 Final Word: Wait for the Dip ?
Ather’s breakout is backed by both strong fundamentals and a bullish technical setup. If the stock pulls back to the ₹357 zone, it could present an excellent opportunity for those who missed the initial run.
📍Plan:
* ✅ Add to watchlist
* 🔁 Wait for pullback
* 🛑 Stop-loss below ₹340 (if entering at ₹357)
* 🎯 Short-term targets: ₹394 (previous high), ₹420+, ₹450 (HSBC target)
Ather is charging ahead. Are you ready to plug in ?⚡
ATHERENERG trade ideas
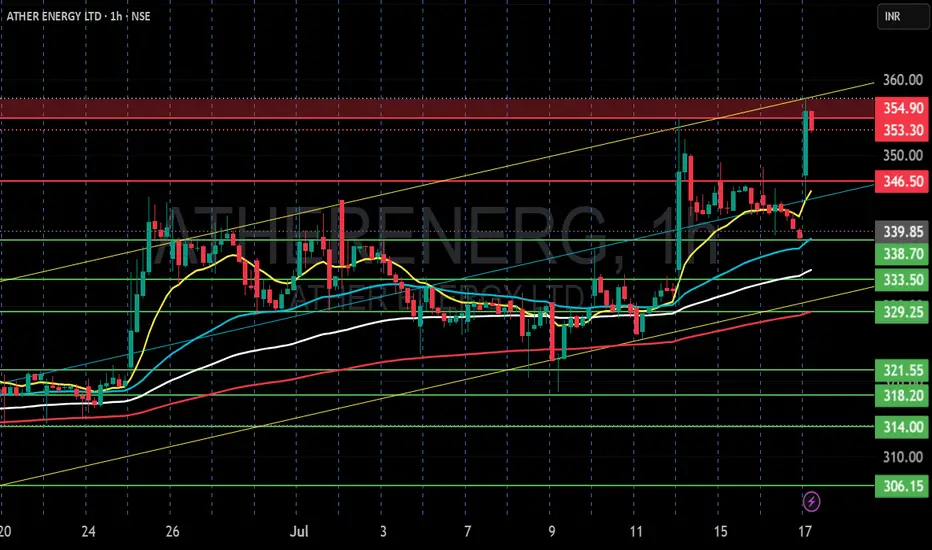
ATHER ENERGY LTD S/R Support and Resistance Levels:
Support Levels: These are price points (green line/shade) where a downward trend may be halted due to a concentration of buying interest. Imagine them as a safety net where buyers step in, preventing further decline.
Resistance Levels: Conversely, resistance levels (red line/shade) are where upward trends might stall due to increased selling interest. They act like a ceiling where sellers come in to push prices down.
Breakouts:
Bullish Breakout: When the price moves above resistance, it often indicates strong buying interest and the potential for a continued uptrend. Traders may view this as a signal to buy or hold.
Bearish Breakout: When the price falls below support, it can signal strong selling interest and the potential for a continued downtrend. Traders might see this as a cue to sell or avoid buying.
MA Ribbon (EMA 20, EMA 50, EMA 100, EMA 200) :
Above EMA: If the stock price is above the EMA, it suggests a potential uptrend or bullish momentum.
Below EMA: If the stock price is below the EMA, it indicates a potential downtrend or bearish momentum.
Trendline: A trendline is a straight line drawn on a chart to represent the general direction of a data point set.
Uptrend Line: Drawn by connecting the lows in an upward trend. Indicates that the price is moving higher over time. Acts as a support level, where prices tend to bounce upward.
Downtrend Line: Drawn by connecting the highs in a downward trend. Indicates that the price is moving lower over time. It acts as a resistance level, where prices tend to drop.
Disclaimer:
I am not a SEBI registered. The information provided here is for learning purposes only and should not be interpreted as financial advice. Consider the broader market context and consult with a qualified financial advisor before making investment decisions.
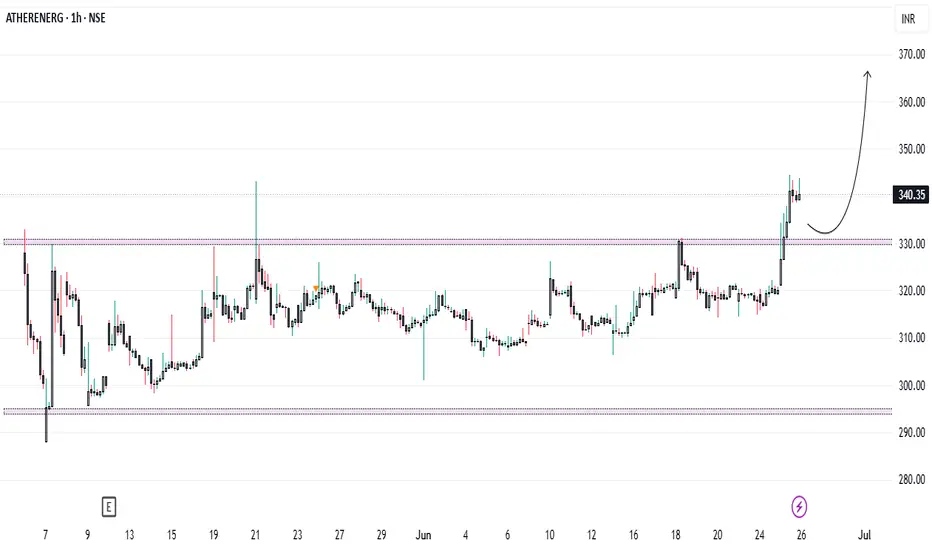
Ather’s Affordable EV Announcement Triggers Market Rally...Technical Analysis:
Ather Energy has successfully broken above the key resistance level of ₹330 and is currently trading around ₹340. This breakout is supported by a noticeable surge in volume, confirming bullish momentum. The ₹330 level, which previously acted as a strong resistance, may now serve as a potential support in the event of a retest. Traders and investors can look for buying opportunities on dips near ₹330, while those already holding the stock are advised to continue holding for further upside.
Fundamental Analysis:
From a fundamental standpoint, Ather’s maiden quarterly results have been encouraging. The company reported a one-third increase in revenue, while its EBITDA loss narrowed to ₹172 crore, down from ₹239 crore in the same quarter last year. This marks a significant step towards operational efficiency and profitability.
Adding to the positive sentiment, Ather recently announced that it will unveil its new EL EV platform and upcoming concept models in August 2025. The highlight of this announcement is that the new scooter will be Ather’s most affordable offering, signaling a strategic push to expand market penetration and compete in the mass segment of the EV market.
Conclusion:
The breakout at ₹330, supported by improving financial performance and strong product pipeline news, suggests a bullish outlook for Ather Energy in the near term. Investors should monitor the ₹330 level for price retest and accumulation opportunities. Holding is recommended for existing investors, while fresh entries can be considered on technical confirmation around support zones.
Note: Due to ongoing global uncertainties, market conditions may remain volatile. Investors are advised to exercise caution and manage risk accordingly.
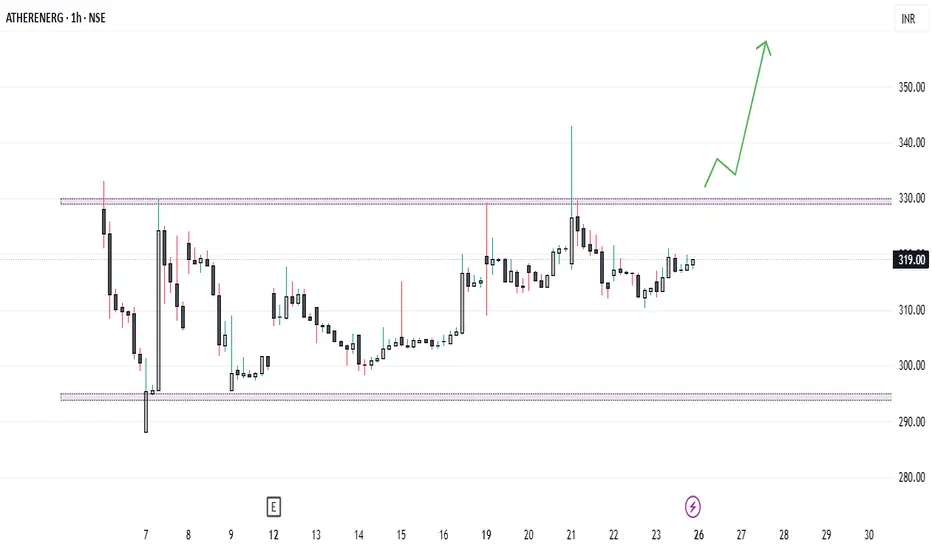
Ather Energy Rangebound, But ₹330 Breakout Could Spark Upside... Ather Energy’s Maiden Quarterly Results Reflect Positive Momentum
Ather Energy recently reported its first quarterly results, showcasing a significant improvement in its financial performance. Revenue surged by approximately one-third, while EBITDA loss contracted to ₹172 crore from ₹239 crore year-on-year, indicating a clear path towards profitability.
On the technical front, Ather Energy’s stock is consolidating within a defined range, with the ₹330 level as a key resistance point. A sustained breakout above ₹330, accompanied by strong volume, could trigger a bullish continuation and offer a potential long trade opportunity. Traders should monitor price action closely around this level and confirm the breakout before entering long positions.