[INTRADAY] #BANKNIFTY PE & CE Levels(12/06/2025)Today, a gap-up opening is expected in Bank Nifty near the 56550–56600 zone. If the index manages to sustain above this range, it may trigger an upside move toward 56750, 56850, and 56950 levels. A further breakout above 57050 could extend the bullish rally toward 57250, 57350, and possibly 57450+ during the session.
However, if Bank Nifty fails to hold above 56550 and begins to trade below 56450, a downward move could unfold toward 56250, 56150, and 56050 levels. Any sustained weakness may increase selling pressure, dragging the index further down intraday.
BANKNIFTY trade ideas

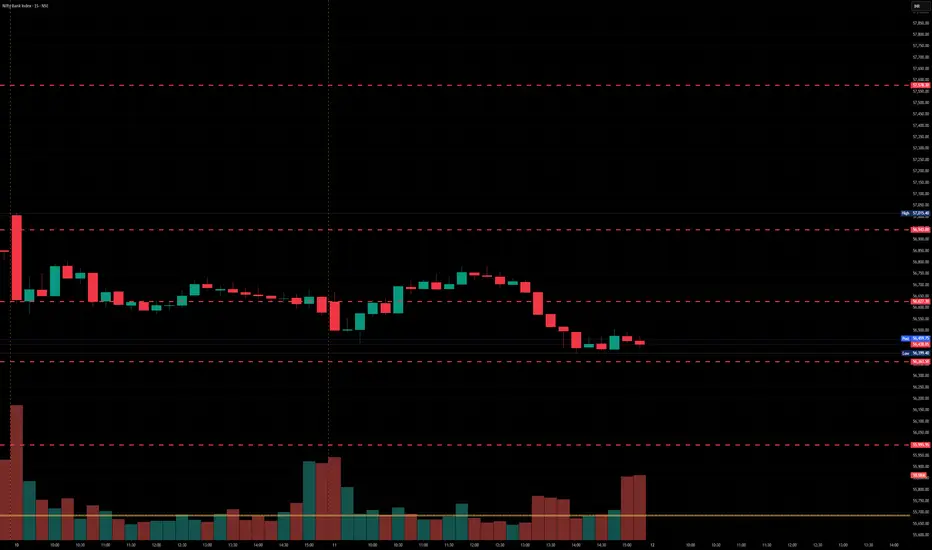
BankNifty levels - Jun 12, 2025Utilizing the support and resistance levels of BankNifty, along with the 5-minute timeframe candlesticks and VWAP, can enhance the precision of trade entries and exits on or near these levels. It is crucial to recognize that these levels are not static, and they undergo alterations as market dynamics evolve.
The dashed lines on the chart indicate the reaction levels, serving as additional points of significance. Furthermore, take note of the response at the levels of the High, Low, and Close values from the day prior.
We trust that this information proves valuable to you.
* If you found the idea appealing, kindly tap the Boost icon located below the chart. We encourage you to share your thoughts and comments regarding it.
Wishing you successful trading endeavors!
BANKNIFTY is moving towards 59000The monthly Cash Data chart is forming a diametric pattern. Waves (a) through (f) have completed and we are currently in the middle of wave (g) of the diametric pattern.
This wave is moving towards 59,000

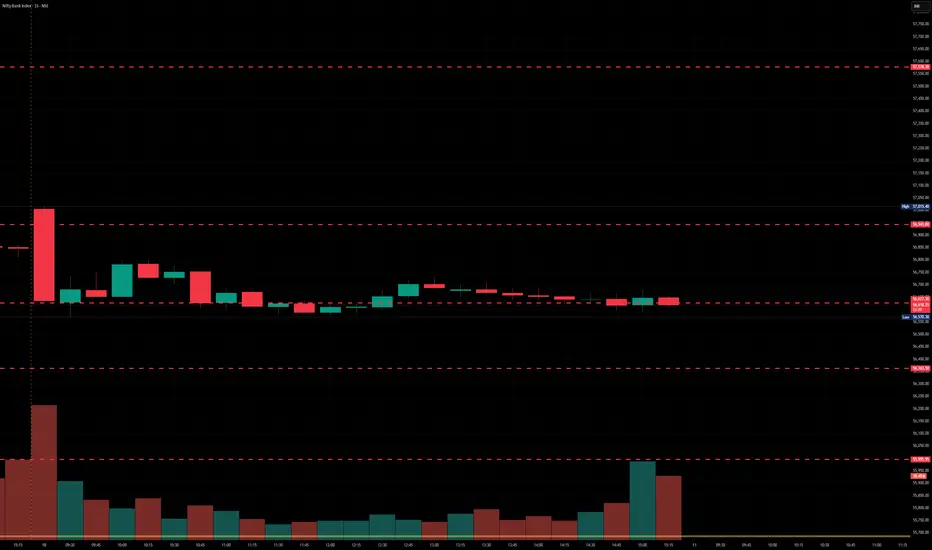
BankNifty levels - Jun 11, 2025Utilizing the support and resistance levels of BankNifty, along with the 5-minute timeframe candlesticks and VWAP, can enhance the precision of trade entries and exits on or near these levels. It is crucial to recognize that these levels are not static, and they undergo alterations as market dynamics evolve.
The dashed lines on the chart indicate the reaction levels, serving as additional points of significance. Furthermore, take note of the response at the levels of the High, Low, and Close values from the day prior.
We trust that this information proves valuable to you.
* If you found the idea appealing, kindly tap the Boost icon located below the chart. We encourage you to share your thoughts and comments regarding it.
Wishing you successful trading endeavors!
BANK NIFTY | SHORT | SWINGBANK NIFTY has reached a crucial resistance zone and seems to be topping out.
You can clearly notice a H&S pattern formation setting up on the 15 min chart.
The price is unable to sustain at the highs.
While the overall trend still remains quite Bullish, a reversal can be taken here for a modest target to 56,225 price level which is the Weekly Pivot support.
P.S. Not a recommendation. Pls do your own due diligence.

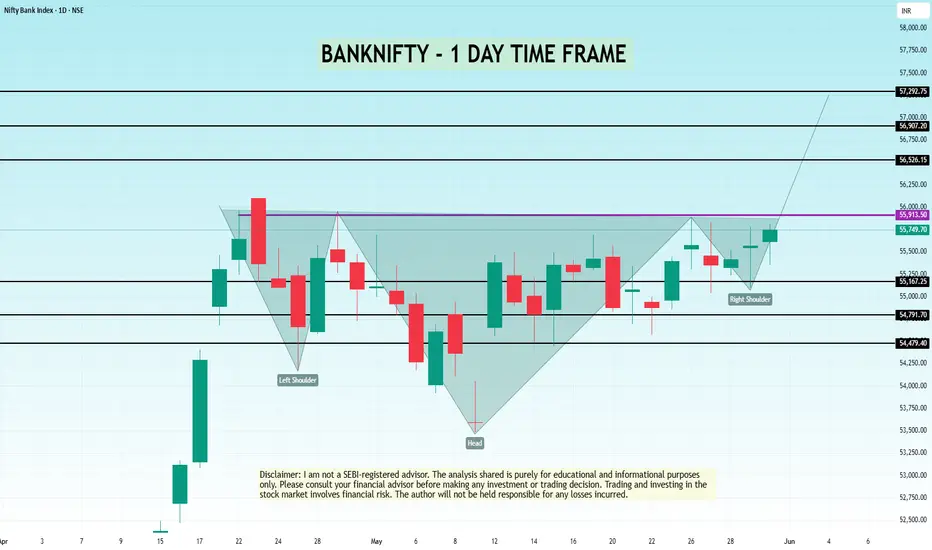
BANKNIFTY - 1 Day Time Frame Analysis📈 NSE:BANKNIFTY - 1 Day Time Frame Analysis
This chart shows a classic Inverse Head and Shoulders pattern forming on the daily timeframe of BankNifty. This is a bullish reversal pattern, generally indicating a potential shift from a downtrend to an uptrend.
Left Shoulder: Formed around April 23rd–25th, marked by a short-term low.
Head: The lowest point in the pattern, formed around May 8th.
Right Shoulder: Formed around May 28th, indicating buyers are stepping in earlier, showing strength.
The neckline resistance lies near 55,913, which the price is currently testing. A decisive breakout above this level, with good volume, could signal a further upward move towards the higher resistance zones like 56,526, 56,907, and possibly 57,292.
Key Support Zones:
55,167
54,791
54,479
Traders may look for a daily candle close above 55,913 for confirmation. Risk management is crucial as a failed breakout may lead to a retest of support levels.
TRADE PLAN:
🔹 Entry:
On a daily candle close above 55,913 (neckline resistance).
Preferably with strong volume confirmation.
🔹 Targets (Upside Levels):
Target 1: 56,526
Target 2: 56,907
Target 3: 57,292
🔹 Stop Loss:
Below 55,167 (recent support and right shoulder low)
Conservative traders can use a tighter stop below 55,400 (previous candle low).
🔹 Risk Management:
Use appropriate position sizing (risk only 1-2% of capital).
Wait for candle close above breakout level, not just intraday movement.
🔹 Invalidation:
If price fails to hold above neckline and breaks below 55,167, pattern becomes invalid.
This setup favors bulls as long as price sustains above the neckline.
Disclaimer: This analysis is for educational and informational purposes only. Please consult your financial advisor before making any trading or investment decisions.
BankNifty levels - Jun 10, 2025Utilizing the support and resistance levels of BankNifty, along with the 5-minute timeframe candlesticks and VWAP, can enhance the precision of trade entries and exits on or near these levels. It is crucial to recognize that these levels are not static, and they undergo alterations as market dynamics evolve.
The dashed lines on the chart indicate the reaction levels, serving as additional points of significance. Furthermore, take note of the response at the levels of the High, Low, and Close values from the day prior.
We trust that this information proves valuable to you.
* If you found the idea appealing, kindly tap the Boost icon located below the chart. We encourage you to share your thoughts and comments regarding it.
Wishing you successful trading endeavors!

BANK NIFTY🎯 Trade Plans
✅ Entry 1 Plan
Parameter Value
Entry 55,791
SL 55,408
Risk 383 pts
Target 60,296
Reward 4,505 pts
RR ~1:11.7 ✅ (Excellent)
Bias Strong Long Bias near daily support zone
✅ Entry 2 Plan (Deeper Pullback)
Parameter Value
Entry 54,054
SL 53,483
Risk 571 pts
Target 60,296
Reward 6,242 pts
RR ~1:10.9 ✅ (High Conviction)
Bias Buy the Dip – In MTF Swap Zone
📌 Strategy Suggestion
🔧 Execution Plan
Primary Entry: 55,791 (Active or close)
Second Buy Zone: 54,054 (Add if price dips)
Stop-Losses: Clearly defined below strong structure
Targets: Conservative 56,098, Final 60,296
Trail SL: After 56,098, move SL to cost or 55,500
🧠 Psychological View
Your RR is phenomenal. Don't rush. Let price breathe.
Think in "zones of opportunity" not pinpoint perfection.
Consider booking partials near the last high (56,098), then ride the rest.
✨ Your Setup = Institutional Grade
✅ Multi-timeframe demand confluence ✔️
✅ GANN logic aligned ✔️
✅ RR above 1:10 ✔️
✅ Strong structure, not just signals ✔️
📊 BANK NIFTY – Full Trade Breakdown
🔍 Multi-Timeframe Demand Zone Confluence
Timeframe Zone Type Proximal Distal Avg Trade Zone
Yearly Rally-Base-Rally 41,830 32,155 36,993 BUY ✅
Half-Yearly BUFL 41,830 34,018 37,924 BUY ✅
Quarterly BUFL + Rally Base Rally 48,450 44,430 46,440 BUY ✅
Monthly Rally Base Rally 48,161 46,077 47,119 BUY ✅
Weekly-1 DMIP (SOE Engulfed) 52,063 50,795 51,429 BUY ✅
Weekly-2 Swap Zone 53,888 52,265 53,077 BUY ✅
Daily S1 Strong DMIP Support 55,791 55,408 55,600 BUY ✅
Daily S2 Strong DMIP Support 54,054 53,483 53,769 BUY ✅
✅ Summary: Price is sitting on a Daily Demand cluster backed by strong MTF zones. This is an ideal place for bulls to re-enter.
🔺 GANN Confluence
Signal Zone Proximal Distal Average Comment
Stay Long Above GANN 55,875 55,307 55,591 ✅ Triggered!
Stay Short Below GANN 55,307 55,300 55,304 ❌ Invalidated
GANN confirms a long bias, aligning beautifully with your DMIP Daily Zone (55,408–55,791). This adds extra conviction.

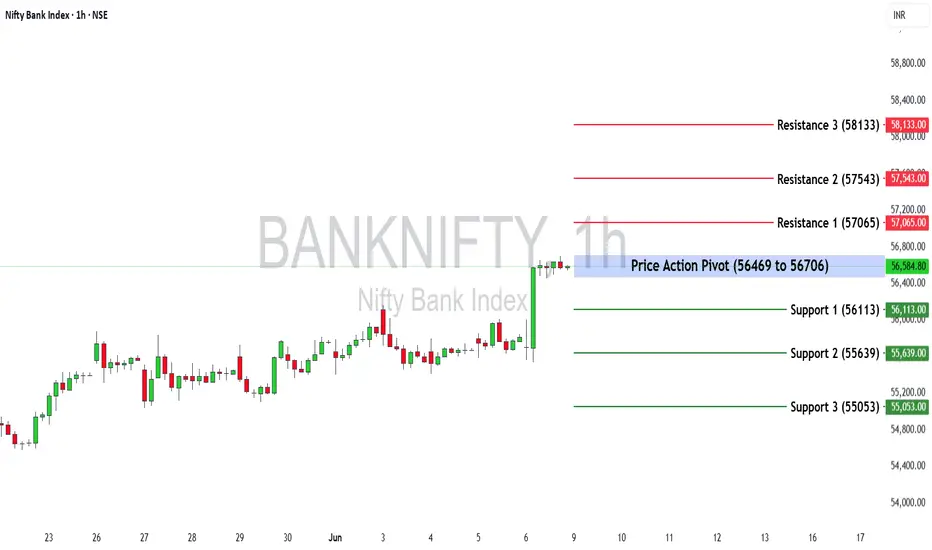
Bank Nifty Weekly Insights: Key Levels & TrendsBank Nifty ended the week at 56,578.40 with a gain of 1.49%
Key Levels for the Upcoming Week
🔹 Price Action Pivot Zone:
The critical range to monitor for potential trend reversals or continuation is 56,706 to 56,469
🔹 Support & Resistance Levels:
Support Levels:
S1: 56,113
S2: 55,639
S3: 55,053
Resistance Levels:
R1: 57,065
R2: 57,543
R3: 58,133
Market Outlook
✅ Bullish Scenario: A sustained move above 56,706 could trigger buying momentum, potentially driving Bank Nifty towards R1 (57,065) and beyond.
❌ Bearish Scenario: If the index falls below 56,469, selling pressure may increase, pulling it towards S1 (56,113) and lower levels.
Disclaimer: lnkd.in
BankNifty levels - Jun 09, 2025Utilizing the support and resistance levels of BankNifty, along with the 5-minute timeframe candlesticks and VWAP, can enhance the precision of trade entries and exits on or near these levels. It is crucial to recognize that these levels are not static, and they undergo alterations as market dynamics evolve.
The dashed lines on the chart indicate the reaction levels, serving as additional points of significance. Furthermore, take note of the response at the levels of the High, Low, and Close values from the day prior.
We trust that this information proves valuable to you.
* If you found the idea appealing, kindly tap the Boost icon located below the chart. We encourage you to share your thoughts and comments regarding it.
Wishing you successful trading endeavors!

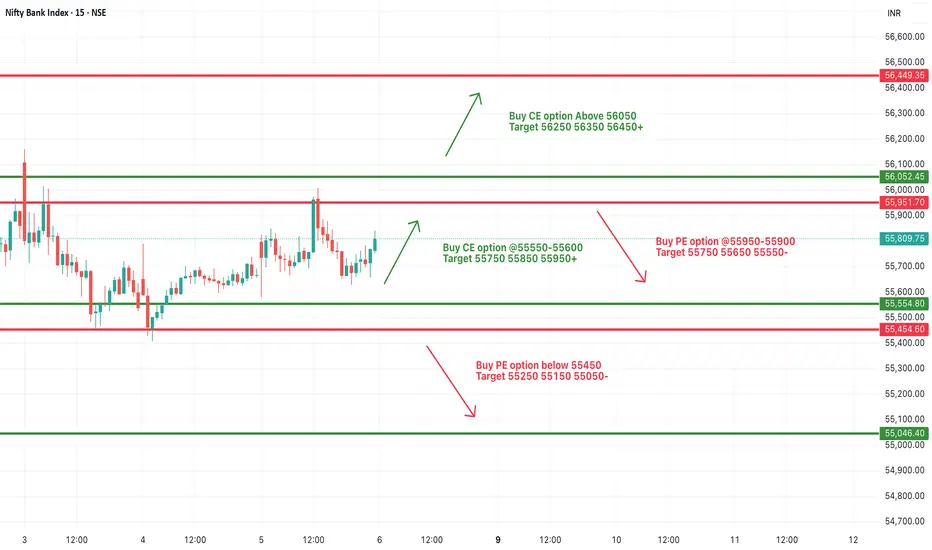
[INTRADAY] #BANKNIFTY PE & CE Levels(06/06/2025)Bank Nifty is opening with a slight gap-up around 55800, but continues to consolidate in the same range that has held for the past few sessions. Despite attempts, no significant breakout or breakdown has occurred, indicating indecision and a potential buildup for a larger move.
Upside continuation will only be confirmed if the index sustains above 56050, opening room for a move toward 56250, 56350, and 56450+.
On the other hand, if price starts slipping back below 55900–55850, the index may retrace toward 55750, 55650, and 55550. Breakdown below 55450 will be a clear sign of weakness, targeting 55250, 55150, and 55050.
BankNifty levels - Jun 06, 2025Utilizing the support and resistance levels of BankNifty, along with the 5-minute timeframe candlesticks and VWAP, can enhance the precision of trade entries and exits on or near these levels. It is crucial to recognize that these levels are not static, and they undergo alterations as market dynamics evolve.
The dashed lines on the chart indicate the reaction levels, serving as additional points of significance. Furthermore, take note of the response at the levels of the High, Low, and Close values from the day prior.
We trust that this information proves valuable to you.
* If you found the idea appealing, kindly tap the Boost icon located below the chart. We encourage you to share your thoughts and comments regarding it.
Wishing you successful trading endeavors!

BankNifty Technical Setup | Cup & Handle BreakoutBankNifty is showing a powerful Cup & Handle formation on the daily chart — a classic bullish continuation pattern.
📍 Breakout Level: 55,800
🎯 Target: 64,000+ (Upside of ~8,280 pts / 17%)
🛑 Support: 53,600 (Previous resistance)
💡 Volume backing the breakout confirms strength.
Previous triangle breakout → consolidation → now Cup & Handle — a textbook rally setup!
⚠️ A daily close above 56,000 could ignite the next leg of the uptrend.

It's jab between a bigger range!📍#Banknifty (TF : 2 H)
It's jab between a bigger range! Immediate resistance @ 55950 - 56150
#RBI Policy to be announce tomorrow, with eyes on PSU Banks
- Break & sustain above 56150, would invite upper range @ 56700 / 57400 / 58200 🔼
- While on the lower side if it break 55000, we could see Banknifty stuck again in the channel and it may further travel lower towards 54400 / 53700

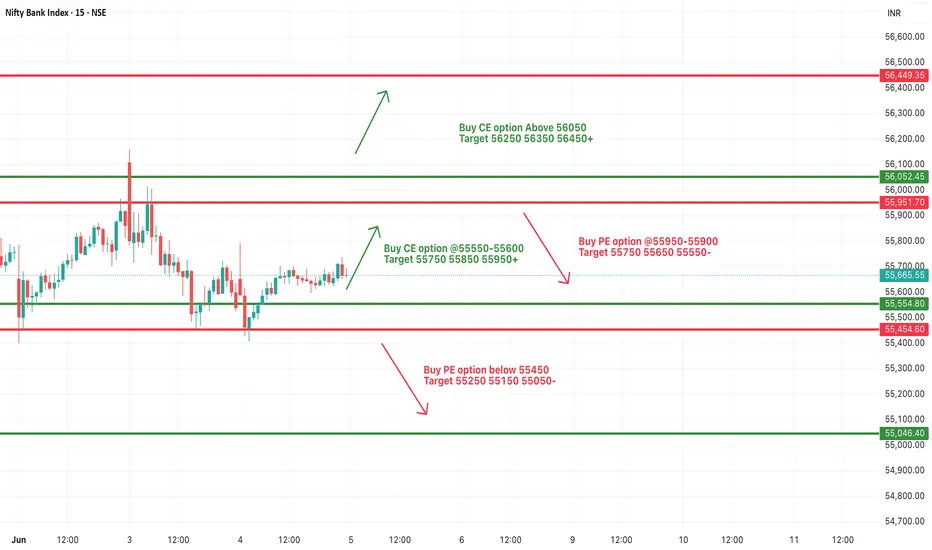
[INTRADAY] #BANKNIFTY PE & CE Levels(05/06/2025)Bank Nifty is opening slightly gap-up around the 55650–55700 zone, hinting at a cautious positive bias. However, the index remains within a well-defined range, and today’s session could act as a trigger for the next directional move.
If Bank Nifty sustains above 55600, bullish momentum may build toward 55750, 55850, and 55950+. A breakout above 56050 could further accelerate the upside, potentially targeting 56250 and beyond.
However, if the index fails to hold above 55700 and starts reversing, a pullback toward 55600 and 55500 is possible.
A breakdown below 55450 would signal weakness and open up downside levels toward 55250, 55150, and 55050, where stronger support is expected.
Bank Nifty bullishBNF 55675 is still in bullish trend on daily charts.
Fii's have sold 305 contracts.
Resistance at 55900. We expect BNF will test the resistance before dropping to support 54820

BankNifty levels - Jun 05, 2025Utilizing the support and resistance levels of BankNifty, along with the 5-minute timeframe candlesticks and VWAP, can enhance the precision of trade entries and exits on or near these levels. It is crucial to recognize that these levels are not static, and they undergo alterations as market dynamics evolve.
The dashed lines on the chart indicate the reaction levels, serving as additional points of significance. Furthermore, take note of the response at the levels of the High, Low, and Close values from the day prior.
We trust that this information proves valuable to you.
* If you found the idea appealing, kindly tap the Boost icon located below the chart. We encourage you to share your thoughts and comments regarding it.
Wishing you successful trading endeavors!

BANKNIFTY Daily Analysis📈 BANKNIFTY Daily Analysis – June 4, 2025
Current Price: ₹55,616.80
Change: +₹16.85 (+0.03%)
---
🔍 Technical Outlook:
Rising Wedge Structure: Price is moving within a narrowing ascending channel — typically a bearish reversal pattern if broken.
Resistance Zone: Strong rejection seen near ₹56,161, suggesting supply pressure at highs.
PE Target Identified: ₹53,483 may act as the first target in case of short-term correction.
Imbalance Zone (Gap Area): Left behind from April rally; price may revisit this area to fill the inefficiency.
🧭 Potential Scenarios:
1. Short-Term Pullback: A dip toward the ₹53,483 PE target is possible.
2. Bounce Opportunity: Watch for a bullish reversal from either the PE target or the Potential Buy Zone at ₹52,000–₹52,500.
3. Bullish Continuation: If price holds above the channel, breakout above ₹56,161 could lead to a new rally.
---
📌 Key Levels to Watch:
Resistance: ₹56,161
Support: ₹53,483 → ₹52,000 (Buy Zone)
Imbalance Area: Could attract price magnetically
💡 Trading Idea:
Consider put options or short-term shorts toward ₹53,483.
Re-evaluate long positions near ₹52K zone with confirmation.

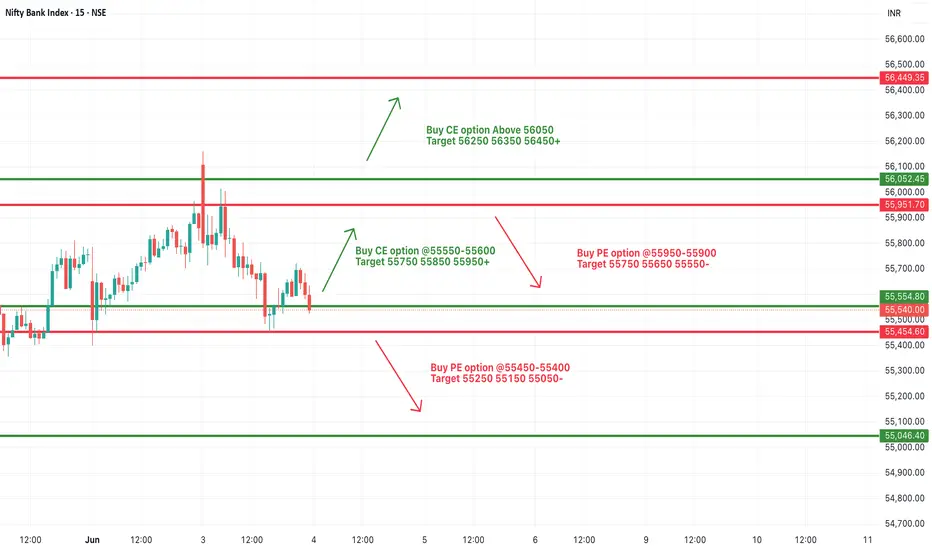
[INTRADAY] #BANKNIFTY PE & CE Levels(04/06/2025)Bank Nifty is expected to open with a gap-up near the 55950 level, which places it at a critical resistance zone. If it sustains above this level, it may extend the bullish momentum toward 55750, 55850, and 55950+, but more importantly, a breakout above 56050 would trigger a fresh upside rally with targets at 56250, 56350, and 56450+.
However, if Bank Nifty fails to hold above 55900–55950 and reverses below this zone, a short trade setup may activate, with potential downside targets of 55750, 55650, and 55550.
Further weakness can be confirmed only if the index slips below the 55550–55600 support zone, exposing it to 55250, 55150, and 55050 levels.
BankNifty levels - Jun 04, 2025Utilizing the support and resistance levels of BankNifty, along with the 5-minute timeframe candlesticks and VWAP, can enhance the precision of trade entries and exits on or near these levels. It is crucial to recognize that these levels are not static, and they undergo alterations as market dynamics evolve.
The dashed lines on the chart indicate the reaction levels, serving as additional points of significance. Furthermore, take note of the response at the levels of the High, Low, and Close values from the day prior.
We trust that this information proves valuable to you.
* If you found the idea appealing, kindly tap the Boost icon located below the chart. We encourage you to share your thoughts and comments regarding it.
Wishing you successful trading endeavors!
Let's Try to Find Banknifty Crucial Support ZoneToday Bank nifty made lifetime High 56161 but failed to give conviction Breakout, No Doubt Price action is very good also Support near 20 EMA on hourly or Daily chart with making a bullish ascending tringle Pattern But any pattern to validate need a strong moment through breakout/Breakdown we noticed buyer trapped in morning to see bank nifty touching lifetime high. you can go long with small stoploss but remember if such pattern would be failed then price probably fall & come to support near neckline, I mean to the place (pattern started) where it began, Banknifty Multiple support also a strong zone near 50-day EMA so it would be value buying zone Near 53500-53800.
So, I am waiting what do u think?

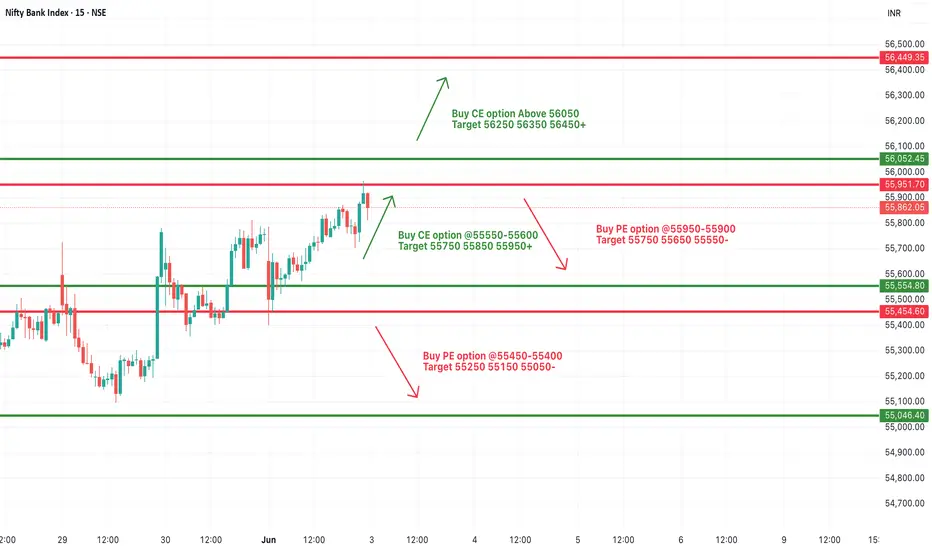
[INTRADAY] #BANKNIFTY PE & CE Levels(03/06/2025)Bank Nifty is expected to open flat around the 55850–55900 zone, continuing near the same levels as the previous session. The index is currently trading in a tight range, indicating potential breakout or reversal zones are nearing.
If Bank Nifty sustains above the 55550–55600 zone, bullish momentum could continue toward 55750, 55850, and 55950+. A clear breakout above 56050 would confirm a fresh upward leg, with extended targets at 56250, 56350, and 56450+.
On the downside, if Bank Nifty slips below 55900–55950, a minor correction is possible with short targets at 55750, 55650, and 55550. Further weakness would only be confirmed below 55450–55400, exposing the downside to 55250, 55150, and 55050.
BankNifty levels - Jun 03, 2025Utilizing the support and resistance levels of BankNifty, along with the 5-minute timeframe candlesticks and VWAP, can enhance the precision of trade entries and exits on or near these levels. It is crucial to recognize that these levels are not static, and they undergo alterations as market dynamics evolve.
The dashed lines on the chart indicate the reaction levels, serving as additional points of significance. Furthermore, take note of the response at the levels of the High, Low, and Close values from the day prior.
We trust that this information proves valuable to you.
* If you found the idea appealing, kindly tap the Boost icon located below the chart. We encourage you to share your thoughts and comments regarding it.
Wishing you successful trading endeavors!
