#106 BANKNIFTY option analysis#106 BANK NIFTY OPTION. I'm not a Sebi resisted person. Follow for more updates
BANKNIFTY trade ideas

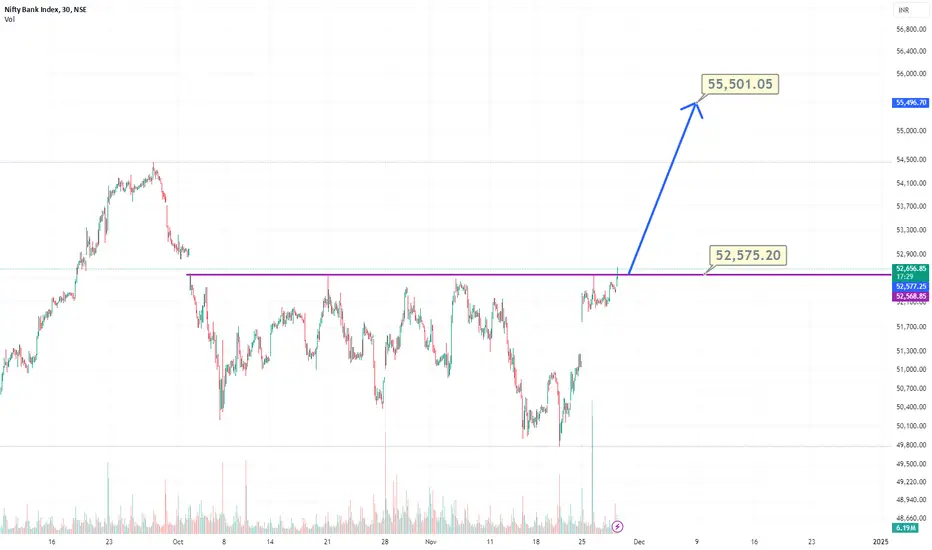
Banknifty Forecast for 2nd Dec'2024The trend is bearish and may follow one of these scenarios:
1. Likely to grab all buy-side liquidity before continuing bearish.
2. Likely to grab available retail liquidity before continuing bearish.
3. Likely to drop aggressively bearish, then reverse bullish to grab buy-side liquidity.

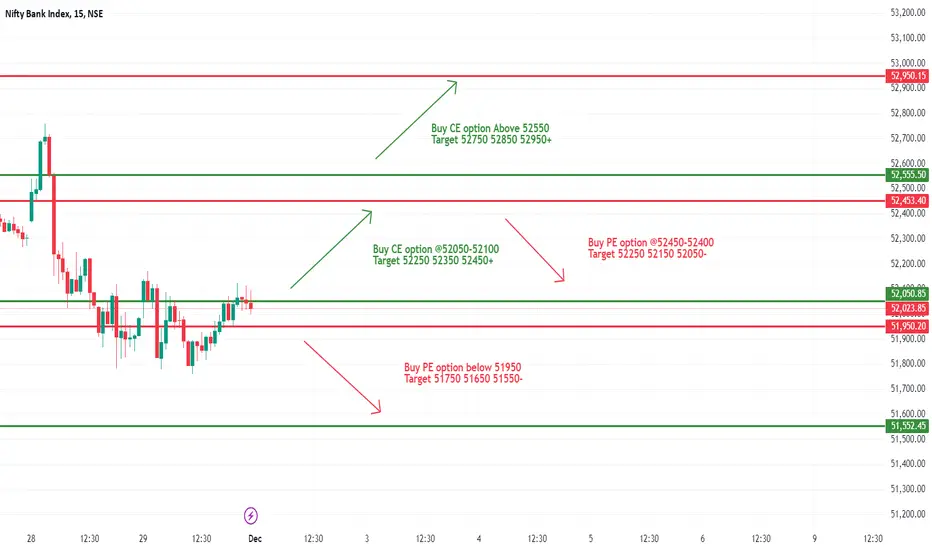
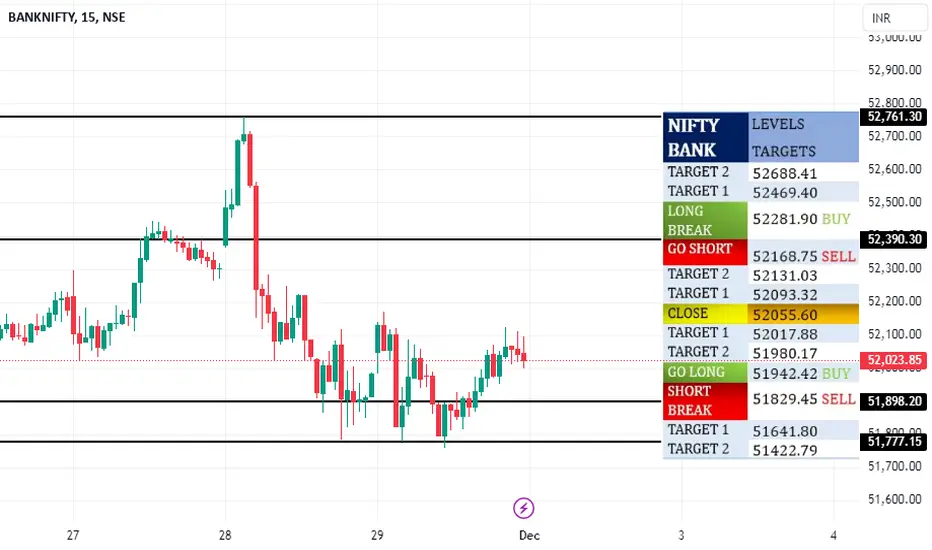
[INTRADAY] #BANKNIFTY PE & CE Levels(02/12/2024)Today will be gap up opening expected in banknifty near 52500 level. After opening if banknifty starts trading above 52550 level then expected further bullish rally towards the 52950 level. After opening it will immediately face resistance at 52500 level if any reversal then possible downside movement upto 52050 and this can be extend for further 400-500 points if banknifty gives breakdown of 51950 level.
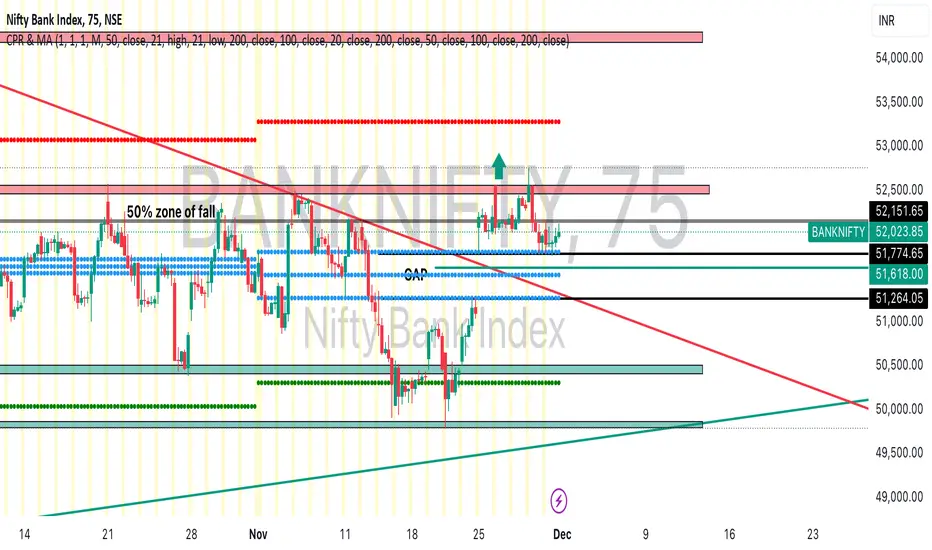
Bank Nifty | Pre-Market | Dec 2024 | Week-1Bank Nifty closed the previous week with some Bullishness breaking out from the trend line resistance forming since 27 Sep 2024.
Last weeks candle was an indecision candle.
It's quite likely that BN fills the gap created by last weeks gap up opening.
Bank Nifty should turn Bullish only once it starts trading above the 50% zone of the previous fall which is above 52,200 level.
For the upcoming week, for now, Bank Nifty is in a trap zone since it is trading above December Monthly Pivot but below next week's Pivot.
Long View ~ Above 52,625
No trade view for any level in between.
BANKNIFTY : Trading levels and plan for 02-Dec-2024Bank Nifty Trading Plan for 02-Dec-2024
On 01-Dec-2024, Bank Nifty exhibited a balanced market structure, fluctuating between the Golden Retracement Zone for sellers (52,221–52,283) and key supports near 51,545 and 51,181. The market witnessed multiple Change of Character (ChoCH) formations, indicating short-term trend reversals. The chart highlighted Yellow Zones for sideways consolidation, Green Zones for bullish trends, and Red Zones for bearish trends. Significant resistance near 52,583 capped the upward moves, while supports near 51,444 and 51,181 limited the downside.
Detailed Trading Plan for 02-Dec-2024
Gap-Up Opening (Above 52,221, up to 200+ points)
If Bank Nifty opens with a gap-up beyond 52,221, it enters the Golden Retracement Zone for sellers (52,221–52,283):
Plan A (Bearish Scenario): Look for a rejection near 52,283. If confirmed, initiate short positions targeting 52,221 first, followed by 52,023 as a second target.
Plan B (Bullish Scenario): If Bank Nifty breaks above 52,283 and sustains for an hourly candle, consider going long with targets of 52,583 and the Last Intraday Resistance at 52,829.
Avoid aggressive buying near 52,283 unless a strong breakout is evident. Let the price action validate the trend.
Flat Opening (Between 52,023 and 51,937)
In the event of a flat opening, focus on the immediate support and resistance levels around 52,023 (Opening Support):
Plan A (Bullish Scenario): If prices hold above 52,023, initiate long positions, targeting 52,221 and 52,283.
Plan B (Bearish Scenario): If Bank Nifty falls below 52,023, expect a move toward the No Trade Zone near 51,937–51,840. Breach of 51,840 could lead to a test of 51,545.
Monitor momentum indicators closely during flat openings, as they often provide early signals for directional bias.
Gap-Down Opening (Below 51,840, down to 200+ points)
A gap-down opening below 51,840 signals bearish sentiment:
Plan A (Bullish Reversal): Observe if buyers defend 51,545 or 51,444. If a reversal pattern emerges, go long, targeting 51,840 and 51,937.
Plan B (Extended Bearish Move): If 51,444 is decisively broken, expect further downside toward 51,181 and 51,081, which are the extended retracement levels for buyers.
In gap-down scenarios, trade smaller lot sizes initially to manage risk effectively in volatile conditions.
Risk Management Tips for Options Traders
Avoid overtrading near critical levels like 52,283 or 51,545 without clear confirmation.
Use strategies such as Iron Condors or Straddles to capitalize on range-bound movements in Yellow Zones.
Always hedge directional trades, especially near volatile zones like the Opening Resistance or Support.
Summary and Conclusion
Bank Nifty’s key levels for 02-Dec-2024 include 52,283 (Opening Resistance), 51,937–51,840 (No Trade Zone), and 51,545 (Support for Consolidation). Yellow zones indicate potential sideways action, while Green and Red zones guide bullish and bearish trends. Exercise caution around high-impact levels and focus on hourly candle closures for trend validation.
Disclaimer
I am not a SEBI-registered analyst. This analysis is for educational purposes only. Please consult your financial advisor before making trading decisions.

VIEW ON NIFTY AND BANKNIFTYNifty and Bank nifty view for coming weeks.
Dollar Index, Gold, US market and 10 year US Gsec
Disclaimer -
The information provided herein is for educational purposes only. It does not constitute financial, investment, or trading advice and should not be construed as such. Consult a qualified financial advisor before making any financial decisions.
We are not liable for any monetary loss, that may arise directly or indirectly from the use of or reliance on the information provided.

BANK NIFTY @ 52055 Analysis 01-DEC-2024BANK NIFTY @ 52055 Analysis 01-DEC-2024
Supports: 49755/47370
Resistance: 54555
As long as 49755 holds support, I expect to see 55000, 58000, 64000, 67800
Long term targets: 73600, 77500, 83500, 92000, 103000, 109000

BANK NIFTY S/R for 2/12/24Support and Resistance Levels:
Support Levels: These are price points (green line/shade) where a downward trend may be halted due to a concentration of buying interest. Imagine them as a safety net where buyers step in, preventing further decline.
Resistance Levels: Conversely, resistance levels (red line/shade) are where upward trends might stall due to increased selling interest. They act like a ceiling where sellers come in to push prices down.
Breakouts:
Bullish Breakout: When the price moves above resistance, it often indicates strong buying interest and the potential for a continued uptrend. Traders may view this as a signal to buy or hold.
Bearish Breakout: When the price falls below support, it can signal strong selling interest and the potential for a continued downtrend. Traders might see this as a cue to sell or avoid buying.
MA Ribbon (EMA 20, EMA 50, EMA 100, EMA 200) :
Above EMA: If the stock price is above the EMA, it suggests a potential uptrend or bullish momentum.
Below EMA: If the stock price is below the EMA, it indicates a potential downtrend or bearish momentum.
Trendline: A trendline is a straight line drawn on a chart to represent the general direction of a data point set.
Uptrend Line: Drawn by connecting the lows in an upward trend. Indicates that the price is moving higher over time. Acts as a support level, where prices tend to bounce upward.
Downtrend Line: Drawn by connecting the highs in a downward trend. Indicates that the price is moving lower over time. It acts as a resistance level, where prices tend to drop.
Disclaimer:
I am not a SEBI registered. The information provided here is for learning purposes only and should not be interpreted as financial advice. Consider the broader market context and consult with a qualified financial advisor before making investment decisions.
Weekly Analysis 30/11/2024. Stocks in watchlist for next weekI have discussed about the stocks that are in my watchlist for next week.

Banknifty moments for option and future trading 02/Dec/2024Nifty moments for option and future trading 02/Dec/2024
follow us for more updates information.
message us for any stocks related information
WELCOME TO ARROWINDEX
We're dedicated to providing you the best of Finance stock market , with a focus on dependability and Investment. We're working to turn our passion for Finance stock market into a booming online.We analyze Live Market and try to Provide learning information Content. All the Live Market views and charts .We hope you enjoy our Finance stock market as much as we enjoy offering them to you.Support and offering
Effective online education modules for all segments of traders
Customized portfolio tracker Online research & trading guidance
Entry and Exit support for:-
Intraday trading,Swing trading,Scalping,Position trading
Future & Delivery trading
Technical analysis
Fundamentals analysis
Fii & Dii data and reports
Understanding ICT Classic Weekly Profile on BANKNIFTYICT weekly profiles are conceptual frameworks that describe typical patterns of price behavior during a trading week.
Each ICT weekly profile has unique characteristics that can hint the traders in anticipating potential market movements.
However, it is important to note that these profiles are not fixed predictions but rather frameworks to understand market tendencies and works with Higher Time Frame PD arrays confluences.
ICT weekly profile is explained below with BANKNIFTY Chart analysis
Classing Thursday High of Week (Bearish Setup)
Key element to focus :
Higher Time Frame Premium array (Weekly Buy Side Liquidity) for bearish setup
Time Frames alignment :
HTF --> W1 (PD Arrays)
LTF ---> H4 (Market Structure)
ETF --> M15 (Entry)
Process :
1. Market offers Liquidity from Monday to Wednesday
2. Market seeks Liquidity on Thursday
3. Market rebalances on Friday

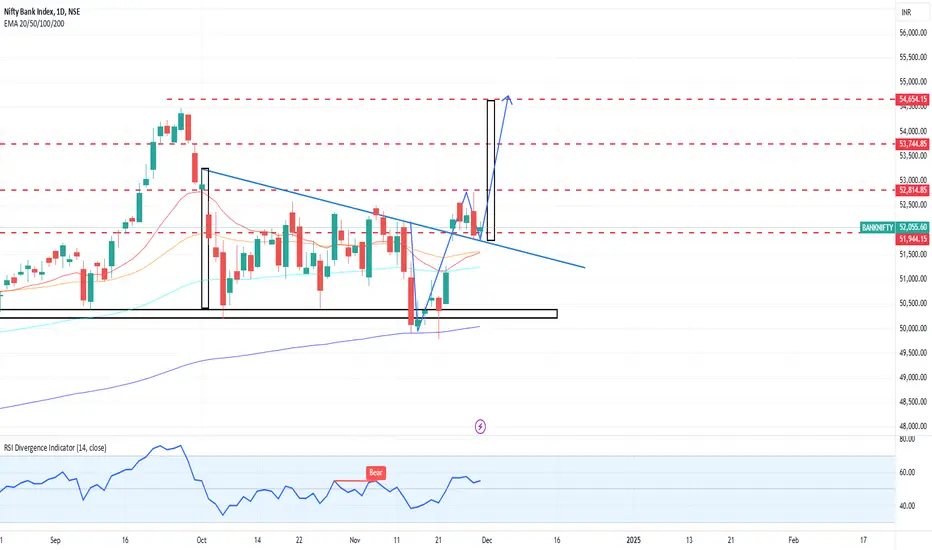
Is BankNifty Going to make a fresh ATH?Looks like after a false breakdown, banknifty have made a fresh breakout in daily charts and retested the breakout. Now continuation is anticipated. So if continues, 54600 maybe the next target.
BANKNIFTY will go upwards a little moreDESCENDING RECTANGLE BREAKOUT -
Banknifty has broken ou t of a strong rectangle pattern on 15 min chart with good confirmation
GAP-UP BREAKOUT -
The breakout occurred with a gap-up indicating strong upwards momentum
SUPPORT FROM 30D SMA -
apartfrom this it had also taken support from 30D SMA during the closing of the previous day indicating there is potential for upward momentum
5-MIN TIMEFRAME -
the pattern and the breakout is even more clear on 5-min timeframe

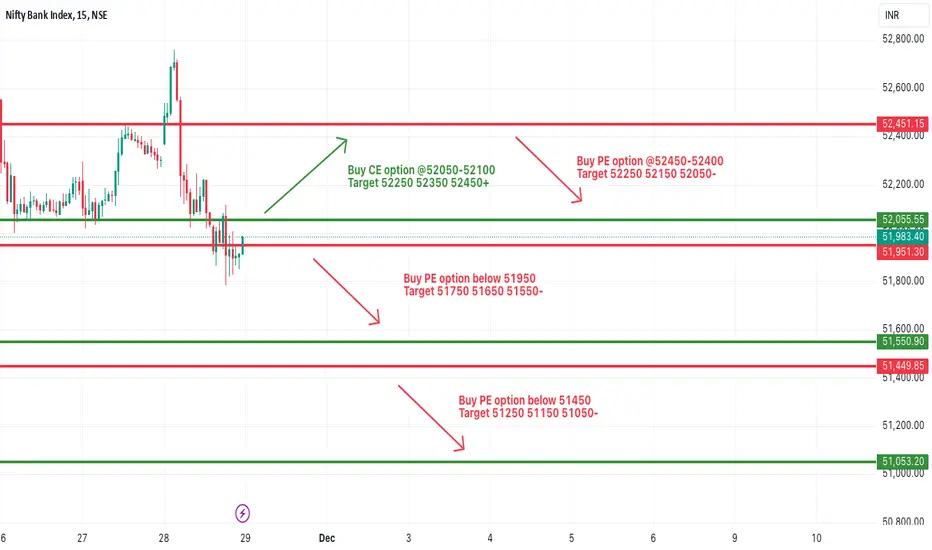
[INTRADAY] #BANKNIFTY PE & CE Levels(29/11/2024)Today will be slightly gap up opening expected in banknifty. After opening if it's sustain above 52050 level then expected upside rally upto 52450 level. Expected strong rejection from this resistance level. Downside huge rally expected in case banknifty starts trading below 51950 level in today's session. This rally can goes upto 51050 level.
BankNifty Intraday Support & Resistance Levels for 29.11.2024On Thursday, BankNifty started on a positive note, reaching a high of 52760.20, but heavy selling pressure dragged it down by almost 1000 points, hitting a low of 51782.90. It ended the day at 51906.85, losing 395 points from the previous close.
Although BankNifty initially broke above the daily supply zone, it failed to sustain and reversed sharply. If it breaches the 51750 level, further downside toward 51270 or below could unfold. The Weekly Trend (50 SMA) and Daily Trend (50 SMA) remain sideways.
Demand/Support Zones
Near Demand/Support Zone (30m): 51040.05 - 51271.50
Far Small Demand/Support Zone (15m): 50609.75 - 50824.55
Far Support: 49282.65 (61.8% FIBO Level)
Far Demand/Support Zone (Daily): 44633.85 - 45750.40
Supply/Resistance Zones
Near Supply/Resistance Zone (Daily): 51294.20 - 52493.95 (current price inside the zone)
Far Supply/Resistance Zone (Daily): 52817.80 - 53235.25
Far Supply/Resistance Zone (Weekly): 53741.40 - 54467.35

banknifty forecast | 29th Nov'2024Price is at a strong support zone, likely to turn bullish to grab buy-side liquidity, then may turn bearish or consolidate. Enter only after confirmation.
Nifty bank levels and targets for tomorrow 29/Nov/2024Nifty Bank Prediction for 29th November 2024
Nifty bank levels and targets for tomorrow.
follow for more update and information
The Bank Nifty experienced a pullback, relinquishing early gains and failing to sustain its upward trajectory, closing at 51,906.85 with a 0.76% decline.
On the daily chart, the index struggled after breaching the 52,600 level, reversing gains and engulfing the momentum of the last two sessions. This weakness was largely driven by private banking stocks, as the Nifty Private Bank Index fell by 1.11% for the day. Despite forming a bearish reversal pattern, the Bank Nifty remains above its 50- and 100-day exponential moving averages (DEMA), indicating strong support around the 51,500 level. A breach below this could extend the correction to 51,000 & 50700 levels.
Traders are advised to adopt a stock-specific strategy within the banking sector and consider a "buy-on-dips" approach for the near term.

BANKNIFTYHi guys,
In this chart i Found a Demand Zone in BANKNIFTY CHART for Positional entry,
Observed these Levels based on price action and Demand & Supply.
*Don't Take any trades based on this Picture.
... because this chart is for educational purpose only not for Buy or Sell Recommendation..
Thank you

BANKNIFTY : Analysis, Levels and trading Plan
On the previous trading day, Bank Nifty exhibited significant volatility with a Change of Character (ChoCH) around ₹51,904, highlighting a potential shift in market structure. The index hovered near the Extended Retracement Zone and tested liquidity areas multiple times. Sellers maintained control near ₹52,342 (Golden Retracement Zone), while the buying attempts around ₹51,816 indicated weakening demand. Yellow represents a sideways trend, green indicates bullish potential, and red signals bearish sentiment.
Here’s the detailed plan for all opening scenarios (Gap Up, Flat, and Gap Down):
Gap Up Opening (+200 points or more above ₹51,983)
Resistance Zone Focus (₹52,342-₹52,583): A gap-up opening above ₹51,983 would push Bank Nifty closer to the Golden Retracement Zone for sellers. Watch for bearish patterns like bearish engulfing or evening stars in this area.
Action Plan:
Entry: Short near ₹52,342 after bearish confirmation.
Target: ₹51,924 (support zone) and ₹51,816 (extended retracement).
Stop Loss: Above ₹52,600 to manage risk effectively.
Breakout Potential (Above ₹52,583): If the index sustains above ₹52,583 with strong volume, it could signal bullish momentum toward higher levels.
Action Plan:
Entry: Long above ₹52,583 after confirmation with a 15-minute candle close.
Target: ₹52,800-₹53,000.
Stop Loss: Below ₹52,400 to avoid false breakouts.
Flat Opening (Near ₹51,983)
Opening Support/Resistance Zone (₹51,924-₹51,983): If the market opens flat, the initial focus will be on whether Bank Nifty holds above ₹51,924. A decisive break above or rejection from this zone will guide further action.
Action Plan for Bullish Scenario:
Entry: Long above ₹51,983 with strong buying momentum.
Target: ₹52,342 and ₹52,583.
Stop Loss: Below ₹51,900 to limit downside risk.
Action Plan for Bearish Scenario:
Entry: Short below ₹51,924 after confirming selling pressure.
Target: ₹51,816 and ₹51,571.
Stop Loss: Above ₹52,000 for safety.
Extended Retracement Zone (₹51,816): If the index drifts below ₹51,924, monitor the demand zone near ₹51,816 for potential buying interest.
Look for bullish candlestick patterns like hammers or morning stars.
Gap Down Opening (-200 points or more below ₹51,983)
Failure of Demand (₹51,571-₹51,499): A gap-down opening below ₹51,816 will test lower retracement zones. If buyers fail to hold at ₹51,571, the bearish trend may intensify.
Action Plan:
Entry: Short below ₹51,571 with bearish confirmation.
Target: ₹51,274 (key buyer support).
Stop Loss: Above ₹51,700 to minimize risk.
Buyers’ Support (₹51,274): If Bank Nifty approaches the buyers' support zone near ₹51,274, look for reversals as this is a historically strong support level.
Action Plan:
Entry: Long near ₹51,274 after bullish reversal patterns form.
Target: ₹51,571 and ₹51,816.
Stop Loss: Below ₹51,150 to manage risk.
Risk Management Tips for Options Trading
Position sizing is key: Do not risk more than 2% of your trading capital on any single trade.
Avoid over-leveraging by sticking to liquid options with balanced premiums.
Use defined strategies like debit spreads or credit spreads to cap losses.
Focus on the implied volatility (IV) and avoid trading options with extremely high or low IV.
Avoid trading in the first 15 minutes, as the market is prone to excessive volatility during this period.
Summary and Conclusion
The Bank Nifty is poised to trade within well-defined zones, with ₹51,924 as the immediate pivot level. A breach of ₹52,342 could lead to a bullish rally, while failure at ₹51,571 would extend the bearish momentum. Stick to the plan and use confirmation patterns before entering trades.
Disclaimer:
I am not a SEBI-registered analyst. This analysis is for educational purposes only. Please consult your financial advisor or do your research before taking any trading positions.

BANK NIFTY S/R for 29/11/24Support and Resistance Levels:
Support Levels: These are price points (green line/shade) where a downward trend may be halted due to a concentration of buying interest. Imagine them as a safety net where buyers step in, preventing further decline.
Resistance Levels: Conversely, resistance levels (red line/shade) are where upward trends might stall due to increased selling interest. They act like a ceiling where sellers come in to push prices down.
Breakouts:
Bullish Breakout: When the price moves above resistance, it often indicates strong buying interest and the potential for a continued uptrend. Traders may view this as a signal to buy or hold.
Bearish Breakout: When the price falls below support, it can signal strong selling interest and the potential for a continued downtrend. Traders might see this as a cue to sell or avoid buying.
20 EMA (Exponential Moving Average):
Above 20 EMA(50 EMA): If the stock price is above the 20 EMA, it suggests a potential uptrend or bullish momentum.
Below 20 EMA: If the stock price is below the 20 EMA, it indicates a potential downtrend or bearish momentum.
Trendline: A trendline is a straight line drawn on a chart to represent the general direction of a data point set.
Uptrend Line: Drawn by connecting the lows in an upward trend. Indicates that the price is moving higher over time. Acts as a support level, where prices tend to bounce upward.
Downtrend Line: Drawn by connecting the highs in a downward trend. Indicates that the price is moving lower over time. It acts as a resistance level, where prices tend to drop.
RSI: RSI readings greater than the 70 level are overbought territory, and RSI readings lower than the 30 level are considered oversold territory.
Combining RSI with Support and Resistance:
Support Level: This is a price level where a stock tends to find buying interest, preventing it from falling further. If RSI is showing an oversold condition (below 30) and the price is near or at a strong support level, it could be a good buy signal.
Resistance Level: This is a price level where a stock tends to find selling interest, preventing it from rising further. If RSI is showing an overbought condition (above 70) and the price is near or at a strong resistance level, it could be a signal to sell or short the asset.
Disclaimer:
I am not a SEBI registered. The information provided here is for learning purposes only and should not be interpreted as financial advice. Consider the broader market context and consult with a qualified financial advisor before making investment decisions.
BANKNIFTY ANALYSIS - Monthly Expiry Week.BankNifty appears to be exhibiting bullish momentum for the upcoming week. Should it successfully surpass and maintain a position above 51500, we anticipate potential levels to reach 52500-52800. However, the current view remains invalidated if BankNifty experiences a downward breach of 50600.

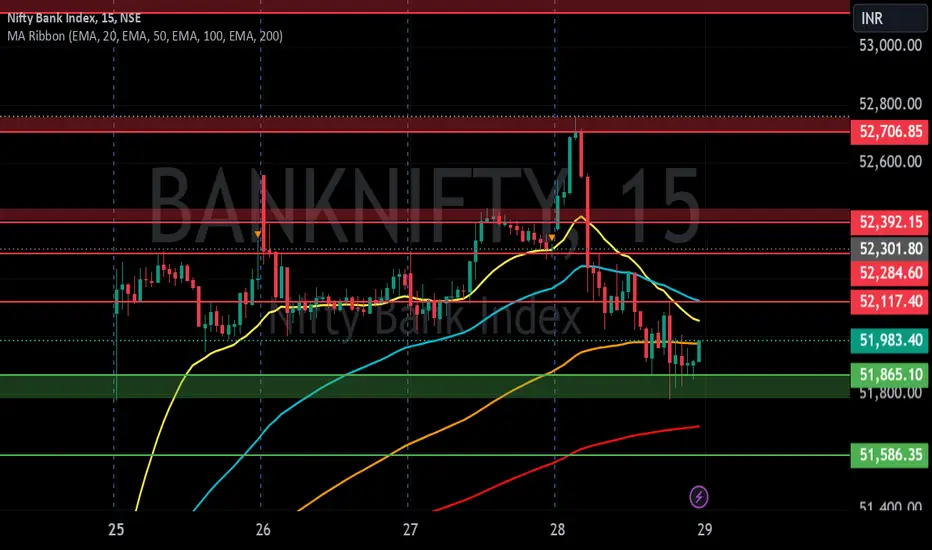
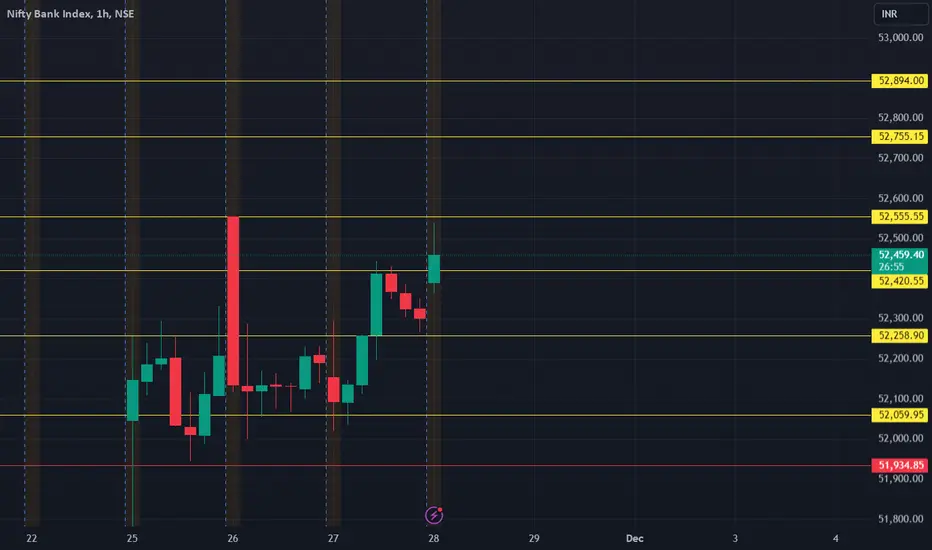
Bank Nifty December 2024 - Analysis### **Bank Nifty Long Position Strategy**
Bank Nifty has achieved an hourly close above the critical resistance level of **52,550**, signaling a potential shift in momentum toward bullish territory. Sustaining a close above this level further strengthens the bullish outlook, while a close below **52,000** would negate this view. The focus now shifts to the following key resistance levels, which serve as potential price targets for this uptrend:
---
#### **1. First Target – 53,100**
The initial resistance level is at 53,100, where Bank Nifty is likely to encounter its first major hurdle. Sustained buying pressure at this level could pave the way for further gains.
#### **2. Second Target – 53,575**
If Bank Nifty breaks through 53,100, the next key target lies at 53,575. This is a critical resistance zone, and a decisive move beyond this level would further validate the bullish momentum.
#### **3. Final Target – 54,500**
A continuation of the uptrend could push Bank Nifty toward the final target of 54,500. This level represents a significant resistance point, and a breakout here would signal broader market strength.
---
### **Stop Loss and Risk Management**
1. **Initial Stop Loss**:
An hourly close below the **52,000–51,900** support zone invalidates the bullish setup and should be used as the initial stop-loss level.
2. **Trailing Stop Loss**:
- Once the first target of **53,100** is reached, consider moving the stop-loss to the breakeven point (**52,550**) to protect capital.
- As Bank Nifty approaches the second target of **53,575**, the stop-loss can be further trailed to **53,000** to lock in profits.
- Upon reaching the third target of **54,500**, adjust the stop-loss to just below the second target (**53,500**) to maximize gains while protecting profits.
---
### **Key Considerations**
- **Closing Above 52,550**: Enhances the bullish outlook and supports the potential for further upward movement.
- **Closing Below 52,000**: Negates the bullish view and may signal a reversal in trend.
---
### **Summary**
- **Trend**: Bullish (above 52,550).
- **Targets**: 53,100, 53,575, and 54,500.
- **Stop Loss**:
- Initial: Hourly close below 52,000–51,900.
- Trailing: Breakeven after T1 (53,100); adjusted progressively as targets are reached.
Traders are encouraged to monitor closing levels closely, as they provide confirmation of trend strength or potential reversals. Employing trailing stop-loss strategies ensures capital protection while capturing maximum potential gains.
---
**Disclaimer**: This is for educational purposes only and should not be considered financial advice or a recommendation to buy or sell.
BANKNIFTY Larger pictureBN is moving into new price space..See chart..That means it will shoot up...tgt roughly calculated and mentioned..This is just a overview..