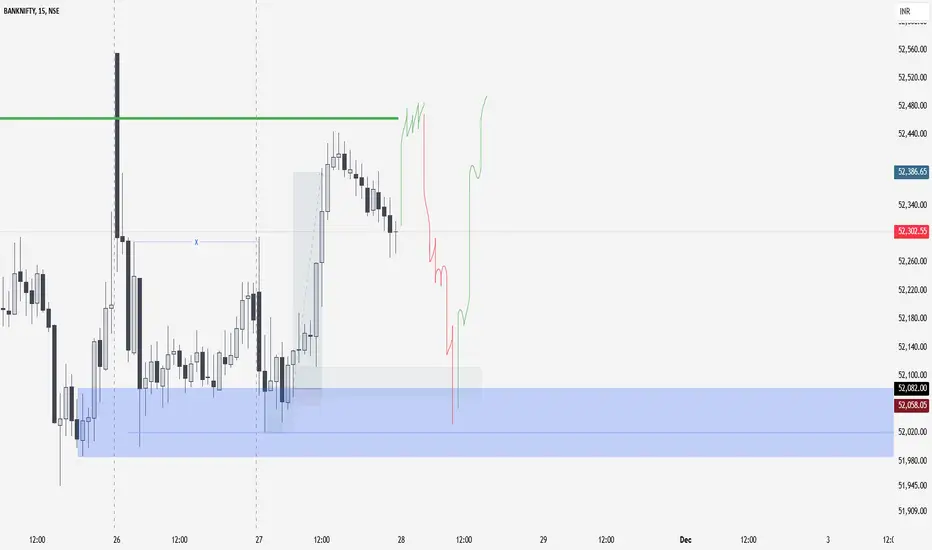
Banknifty | 28th Nov'2024 Forecast | NSEMany retail traders have buy orders (buy-side liquidity) that big players (institutions) can take.
First, they grab all the buy-side liquidity.
Next, they target sell-side liquidity by creating false breakouts.
Then, they push the price down to a strong support or demand zone (bearish move).
After that, they reverse the price up (bullish move) and take any remaining buy-side liquidity.
DM to learn more about liquidity and how big players think in the market!
BANKNIFTY trade ideas
Banknifty Prediction for 28th November 2024Banknifty Prediction for 28th November 2024
Follow for more updates and information.
From a technical perspective, the index continues to face resistance near the 52,600 level while finding strong support around the 50-day exponential moving average at 52,000. Key indicators and oscillators are aligning with the upward trend, suggesting a bullish outlook in the near term. If the Bank Nifty breaks above the critical resistance at 52,600, it is likely to move higher, targeting levels of 53,300 and 53,500.

BANKNIFTY : Trading Levels and Plan for 28-Nov-2024Trading Plan for Bank Nifty - 28th November 2024
Introduction:
On 27th November 2024, Bank Nifty exhibited a choppy session as it oscillated within a tight range, highlighted by the Yellow Zone (52,181–52,282), which served as the "Opening Support / No Trade Zone." The index attempted to breach its "Opening Resistance" at 52,462, but selling pressure pushed it back into consolidation. Key support at 51,903 held firm, aligning with the Green Zone, indicating bullish support levels. For 28th November 2024, critical levels include 52,794 as the last intraday resistance and 51,754 as the support for potential consolidation.
Plan for Different Opening Scenarios:
Gap-Up Opening (200+ Points Above Close):
If Bank Nifty opens between 52,462–52,794, it is crucial to wait for confirmation of bullish momentum. A breakout above 52,794 with an hourly close signals continuation towards 53,232, which serves as the "Profit Booking Zone."
Rejection near 52,794 can lead to a pullback into the "Opening Resistance" zone (52,462), offering a better entry for long positions.
If the market opens directly above 52,794, avoid aggressive longs. Wait for retests towards 52,794 or the "Opening Resistance" for safe entries.
Risk Management Tip: Use trailing stop losses for call options (52,800 CE) to protect profits in a trending market.
Flat Opening (Near Previous Close at 52,302):
If Bank Nifty opens flat, avoid trading immediately within the Yellow Zone (52,181–52,282). Wait for a breakout above 52,282 to initiate long trades targeting 52,462 and 52,794.
A breakdown below 52,181 signals bearish momentum towards 51,967, the "Last Intraday Support Zone." Monitor for reversals or trend continuation.
Intraday traders can use the breakdown below 51,967 for short opportunities targeting 51,754, but ensure confirmation with an hourly close.
Risk Management Tip: Consider deploying iron condors to benefit from limited movement within the range, as flat openings often lead to range-bound trading.
Gap-Down Opening (200+ Points Below Close):
If Bank Nifty opens between 51,903–51,754, watch for bullish reversal patterns in the Green Zone. A strong reversal from 51,903 can offer long opportunities targeting 52,181 and 52,282.
A breakdown below 51,754 could trigger aggressive selling, targeting lower levels near 51,544. Exercise caution while shorting near support zones unless there is decisive volume.
Avoid chasing shorts below 51,754 until a retest of the breakdown level confirms further bearish action.
Risk Management Tip: Opt for buying put spreads (51,800 PE - 51,600 PE) to minimize risk and maximize reward in a bearish scenario.
Tips for Risk Management in Options Trading:
Always use defined stop losses based on hourly candle closures to avoid emotional decisions.
Avoid placing large trades in the "No Trade Zone," as price movements here can be choppy and unreliable.
Opt for hedged positions (like spreads) to protect against time decay in case of low volatility.
Gradually scale into positions rather than committing full capital at once.
Exit trades decisively if the price invalidates the level you're trading around, as sticking to invalid trades can erode capital.
Summary and Conclusion:
For 28th November 2024, the plan revolves around key levels:
Bullish above 52,282, with targets at 52,462, 52,794, and 53,232.
Bearish below 52,181, with targets at 51,967, 51,754, and potentially lower.
Respect the "No Trade Zone" between 52,181–52,282 to avoid getting caught in false moves.
Patience and adherence to the plan will enable you to navigate Bank Nifty's movements confidently.
Disclaimer:
I am not a SEBI-registered analyst. The above analysis is for educational purposes only. Please conduct your own research or consult with a financial advisor before making trading decisions.

BANK NIFTY S/R for 25/11/24Support and Resistance Levels:
Support Levels: These are price points (green line/shade) where a downward trend may be halted due to a concentration of buying interest. Imagine them as a safety net where buyers step in, preventing further decline.
Resistance Levels: Conversely, resistance levels (red line/shade) are where upward trends might stall due to increased selling interest. They act like a ceiling where sellers come in to push prices down.
Breakouts:
Bullish Breakout: When the price moves above resistance, it often indicates strong buying interest and the potential for a continued uptrend. Traders may view this as a signal to buy or hold.
Bearish Breakout: When the price falls below support, it can signal strong selling interest and the potential for a continued downtrend. Traders might see this as a cue to sell or avoid buying.
20 EMA (Exponential Moving Average):
Above 20 EMA(50 EMA): If the stock price is above the 20 EMA, it suggests a potential uptrend or bullish momentum.
Below 20 EMA: If the stock price is below the 20 EMA, it indicates a potential downtrend or bearish momentum.
Trendline: A trendline is a straight line drawn on a chart to represent the general direction of a data point set.
Uptrend Line: Drawn by connecting the lows in an upward trend. Indicates that the price is moving higher over time. Acts as a support level, where prices tend to bounce upward.
Downtrend Line: Drawn by connecting the highs in a downward trend. Indicates that the price is moving lower over time. It acts as a resistance level, where prices tend to drop.
RSI: RSI readings greater than the 70 level are overbought territory, and RSI readings lower than the 30 level are considered oversold territory.
Combining RSI with Support and Resistance:
Support Level: This is a price level where a stock tends to find buying interest, preventing it from falling further. If RSI is showing an oversold condition (below 30) and the price is near or at a strong support level, it could be a good buy signal.
Resistance Level: This is a price level where a stock tends to find selling interest, preventing it from rising further. If RSI is showing an overbought condition (above 70) and the price is near or at a strong resistance level, it could be a signal to sell or short the asset.
Disclaimer:
I am not a SEBI registered. The information provided here is for learning purposes only and should not be interpreted as financial advice. Consider the broader market context and consult with a qualified financial advisor before making investment decisions.
Will Banknifty retest 51000?There is a big gap pending before good times to come. Will banknifty fill the gap? Because without filling the gap chances of breakouts not to sustain is pretty high.
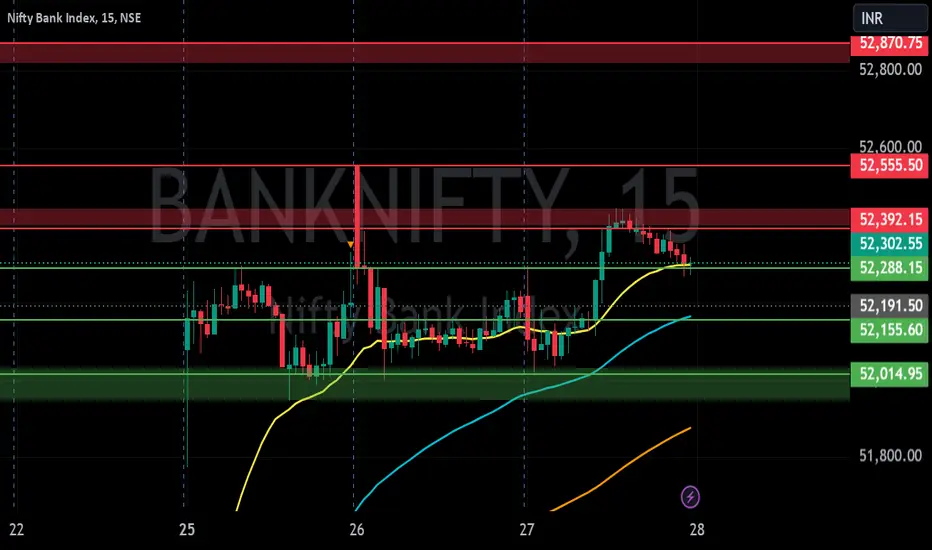
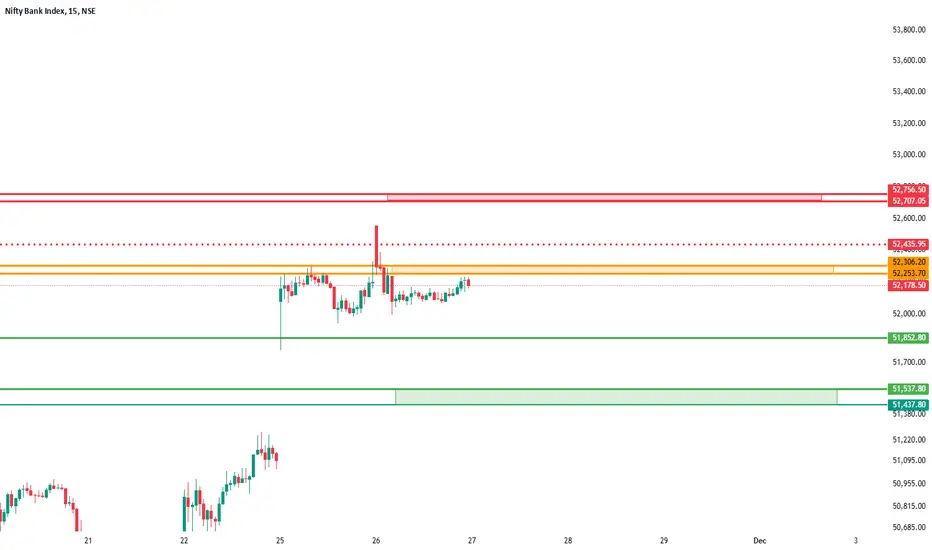
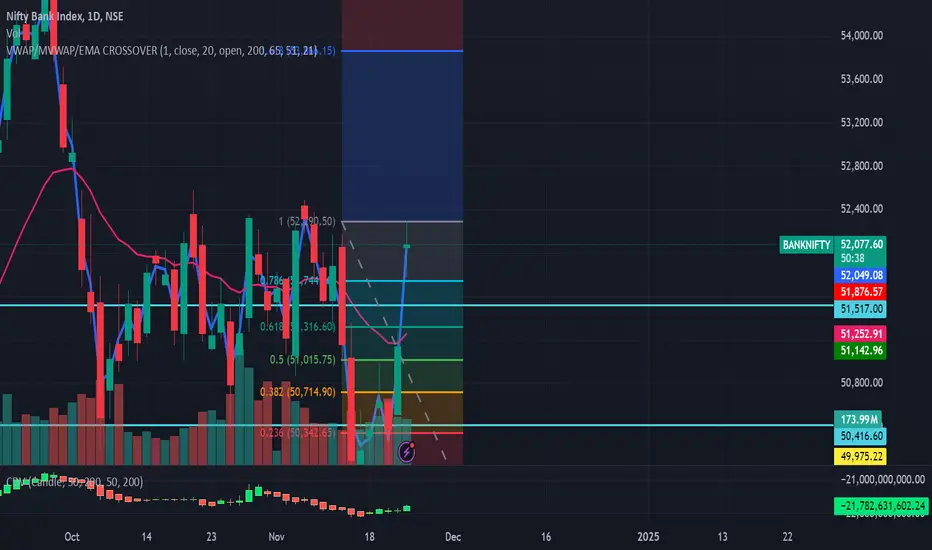
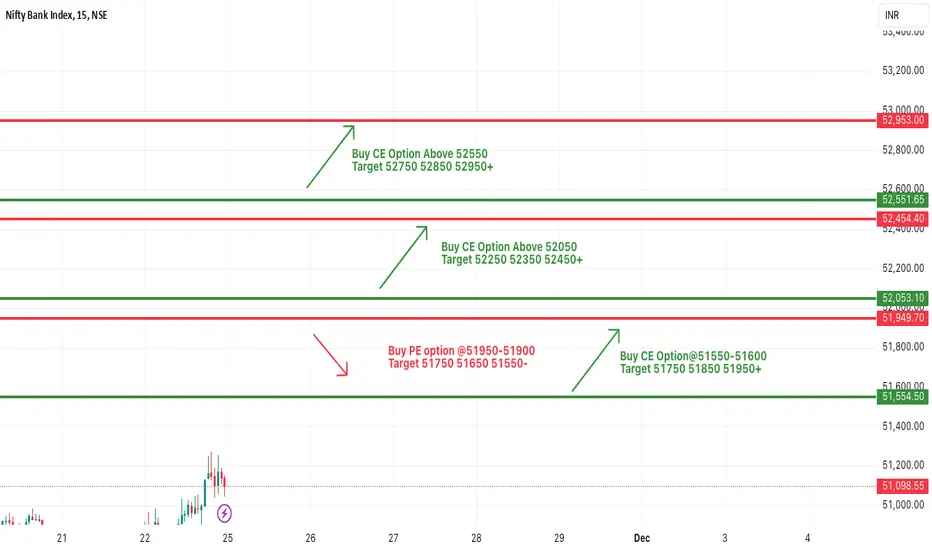
Bank Nifty Monthly Expiry for November 2024 - StudyBank Nifty demonstrates potential for upward movement if it sustains above 52,250 for at least 15 minutes. In such a scenario, the initial target is 52,550, with a subsequent target of 52,750. These levels align with key resistance zones and present an opportunity for traders to capitalize on bullish momentum.
To manage risk effectively, the recommended stop-loss is a 15-minute candle close below 52,000, which signifies a breach of critical support. This strategy provides a well-balanced risk-to-reward ratio, supporting disciplined trading practices. Adhering to the outlined parameters will help maintain consistency in trading decisions.
Disclaimer: This is not a buy/sell recommendation. Shared only for Educational purpose.
BANKNIFTY - 27 SEPTEMEBER 2024 Above the Yellow Zone: Indicates bullish momentum. If the price breaks and sustains above the yellow zone, we can expect upward movement, targeting red resistance zones.
Below the Yellow Zone: Indicates bearish pressure. A breakdown below this zone suggests selling pressure, targeting the green support levels.
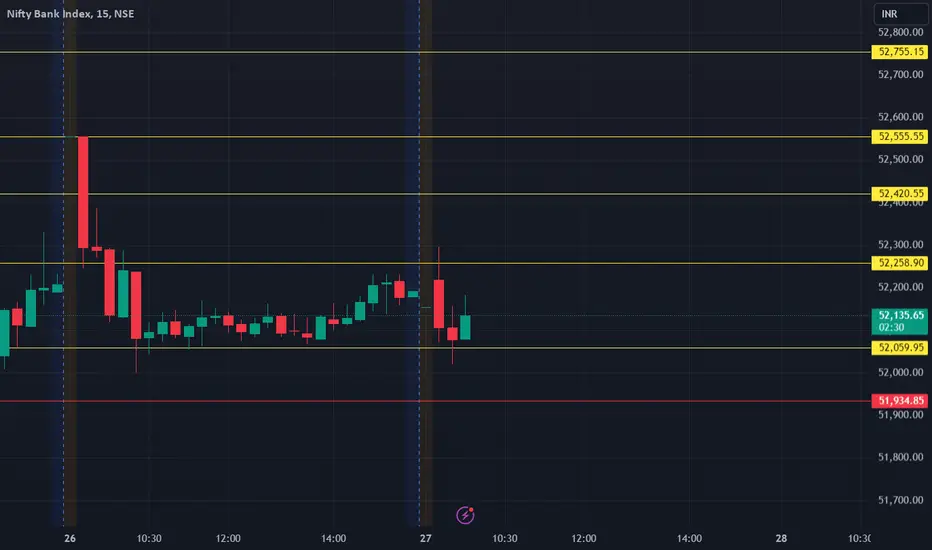
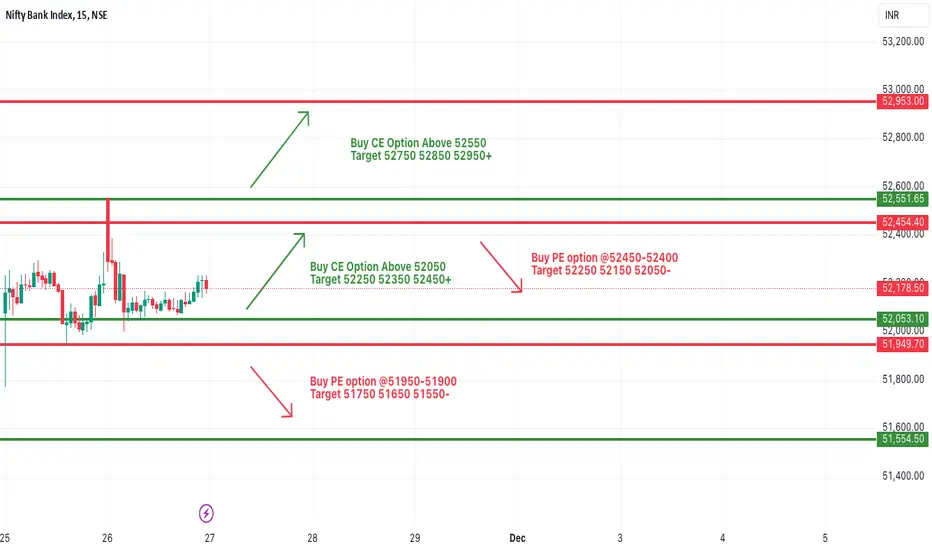
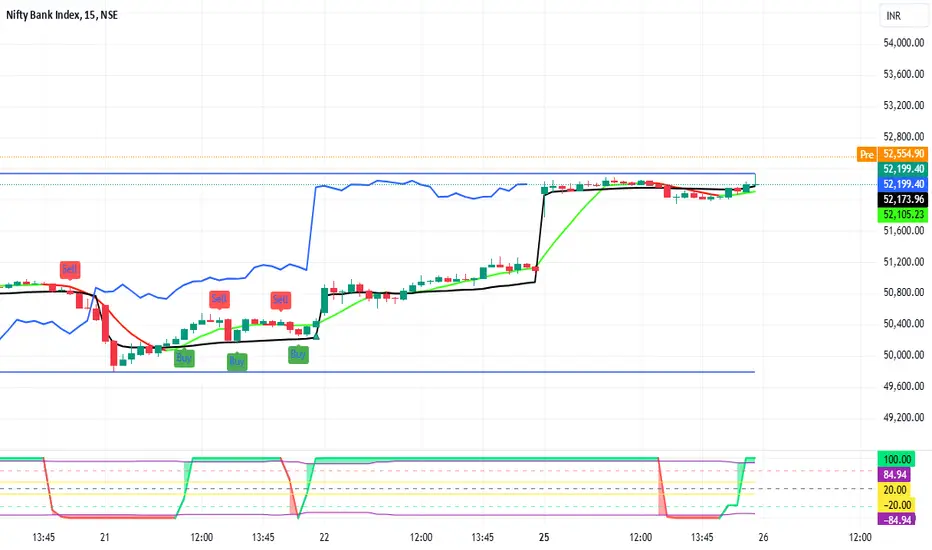
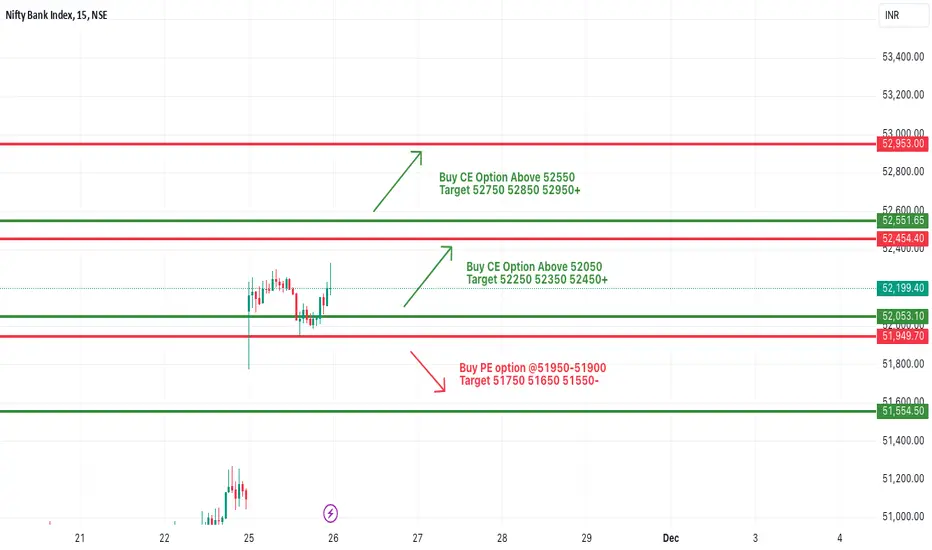
[INTRADAY] #BANKNIFTY PE & CE Levels(27/11/2024)Today will be flat opening expected in banknifty. After opening if banknifty sustain above 52050 level then possible upside movement in market towards the 52450 to 52950+ level in today's session. But in case banknifty starts trading below 51950 level then possible major downside rally in index.
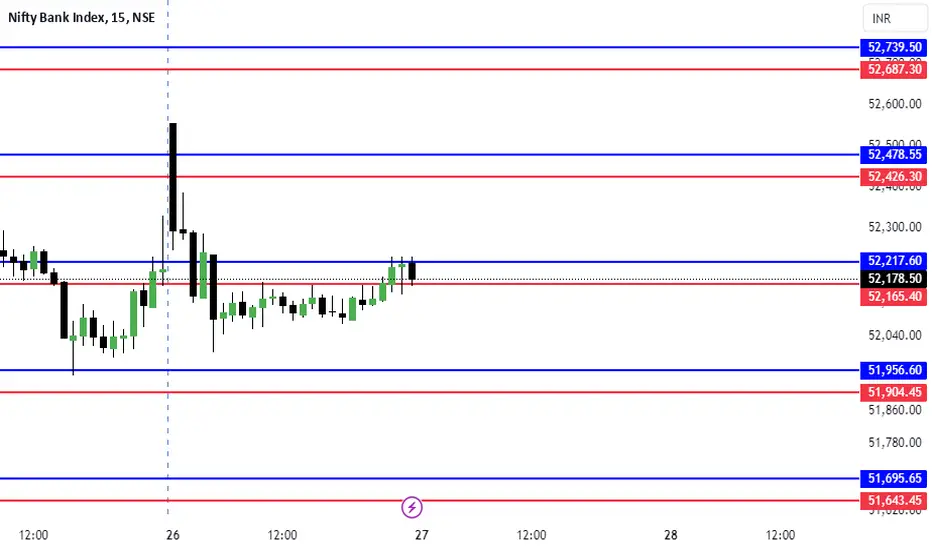
BANKNIFTY: INSTITUTIONAL LEVELS FOR 27/11/2024Overview
This trading system combines simplicity with powerful insights for accurate entries and exits. It is structured for active traders using the 5-minute timeframe who want to make clear, confident trading decisions in fast-moving markets.
Key Strategy Guidelines
Retest Entries : Aim to enter trades on retests rather than breakouts, offering better positioning.
Multiple Confirmations : Use more than one confirmation to validate each trade, helping avoid impulsive decisions.
ATM Options Focus : Stick to at-the-money (ATM) options or above for optimal liquidity and manageable risk.
System Explanation
This setup leverages volume, historical price action, and price ranges to pinpoint high-probability entry and exit points. This methodology is designed to reduce guesswork, allowing traders to manage trades with a consistent approach.
How It Works: Entry/Exit Signals
Blue Line : Signals potential long entry.
Red Line : Indicates potential short entry.
Tip : Align these signals with additional confirmations from your trading strategy for optimal performance.
Stop Loss and Take Profit Levels
Stop Loss:
Long Trades : Set your stop loss at the nearest red line below the entry point, or adjust based on whether the 5-minute candle crosses the red line.
Short Trades : Use the blue line above as the stop loss.
Take Profit:
Long Entries :Target the next red line above or exit if other indicators suggest a prudent exit.
Short Entries :Target the next blue line below following similar guidelines.
Timeframe Recommendation
This system is specifically optimized for the 5-minute timeframe, making it suitable for those trading shorter intervals with precision.
Risk Disclaimer
Trading involves high risk, and rapid price changes can lead to unexpected losses. Only trade with capital you can afford to lose, and carefully assess your financial situation and risk tolerance.
Join the Community Discussion
Engage with other traders to discuss strategies, share insights, and enhance your understanding of the markets. Let’s grow together as a community of traders.
Original Content
This trading system is the product of my own expertise and rigorous testing. It’s a unique approach developed through real market experience to offer a clear edge in trading.
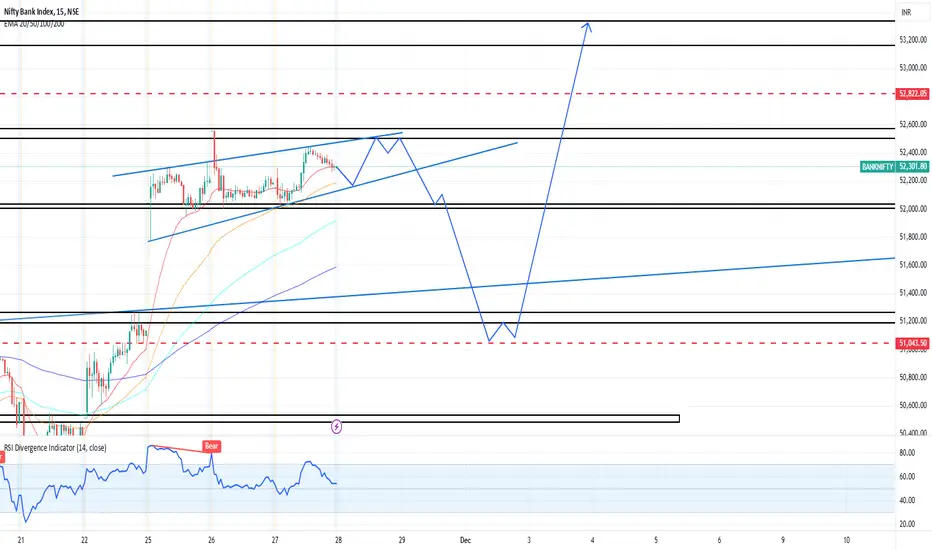
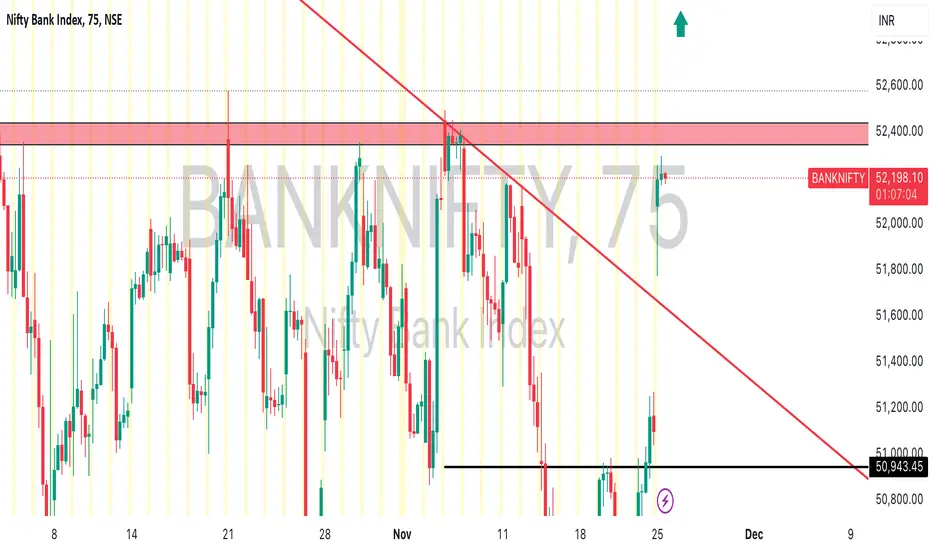
Hello Everyone,Its BANKNIFTY long term chart.I think Banknifty long term channel will breakdown, its just my idea.
I don't recommend and taking trade based on idea, consult your SEBI registered adviser to know the market risk before trade.

Nifty Bank Prediction for 27th November2024Nifty Bank Prediction for 27th November
The Bank Nifty exhibited a mixed trading session on Tuesday, opening strong but later experiencing some volatility throughout the day. It closed at 52,191.50, reflecting minor losses.
Overall, the Bank Nifty demonstrated robust performance in the last two trading sessions and managed to sustain levels above the 52,000 mark. On the daily scale, the index has encountered horizontal line resistance around the 52,600 level and pulled back from there, indicating an immediate hurdle for the index.
Market sentiment appears positive in the short term, while it is essential to keep an eye on the broader market trend. Looking ahead, the index has key support levels at 51,800 and 51,500, while resistance is anticipated around 52,600 and 53,000.
BANKNIFTY : Trading Levels and Plan for 27-Nov-2024Trading Plan for Bank Nifty - 27th November 2024
Introduction:
On 26th November 2024, Bank Nifty traded within a consolidation phase, evident from the "No Trade Zone" (Yellow Trend) between 52,202–52,315. This range indicated indecision, with strong resistance above 52,459 and key support levels below 51,944. The bullish structure (Green Trend) dominates above 52,459, targeting the Profit Booking Zone at 52,794, while bearish momentum (Red Trend) intensifies below 51,870, pushing prices towards 51,544. This framework sets the tone for actionable trading levels.
Plan for Different Opening Scenarios:
Gap-Up Opening (200+ Points Above Close):
If Bank Nifty opens above 52,315 but below 52,459, wait for price action confirmation. A breakout above 52,459 with an hourly candle close indicates bullish momentum targeting 52,794 (Profit Booking Zone).
If the market opens directly near or above 52,459, avoid chasing long trades immediately. Wait for a pullback to 52,315–52,459 for better risk-reward.
Watch for rejection candles near 52,459, signaling potential reversals into the "No Trade Zone."
Risk Management Tip: Consider buying 52,800 CE for bullish scenarios but with a stop loss below 52,315 on an hourly close basis.
Flat Opening (Near Previous Close at 52,178):
If the market opens flat, avoid immediate trades within the No Trade Zone (52,202–52,315). Allow a clear breakout above 52,315 for bullish opportunities or a breakdown below 52,202 for bearish setups.
A breakout above 52,315 targets 52,459, while a breakdown below 52,202 could lead to 51,944 and 51,870 (First Buyer’s Support).
Monitor price action around 51,870, as it serves as critical support for potential reversals or fresh bearish momentum.
Risk Management Tip: Deploy straddles or strangles to capitalize on potential directional moves after the initial range breakout.
Gap-Down Opening (200+ Points Below Close):
If Bank Nifty opens below 51,944, watch for buying interest at 51,870 or the Best Buy Zone at 51,830. Bullish reversal patterns here can offer excellent long opportunities.
A breakdown below 51,870, confirmed by an hourly close, may trigger further bearish momentum towards 51,544 (Last Support Zone).
Avoid aggressive short positions near 51,870–51,830 unless price decisively breaks this zone with volume.
Risk Management Tip: For bearish plays, consider buying 51,600 PE with a strict stop loss above 51,944.
Tips for Risk Management in Options Trading:
Trade with defined stop losses based on hourly candle closures to avoid overtrading.
Use option spreads to manage high premiums during volatile openings.
Focus on liquidity and avoid deep out-of-the-money options.
Gradually scale into positions to manage risk during gap openings.
Avoid holding overnight positions unless they align with the trend and key levels.
Summary and Conclusion:
For 27th November 2024, the key levels to focus on are:
Bullish above 52,315, with targets at 52,459 and 52,794.
Bearish below 51,870, with targets at 51,830 and 51,544.
Avoid trading in the "No Trade Zone" (52,202–52,315) unless a breakout or breakdown is confirmed.
Patience, discipline, and adherence to the plan will help navigate Bank Nifty's movements effectively.
Disclaimer:
I am not a SEBI-registered analyst. The above analysis is for educational purposes only. Please conduct your research or consult with a financial advisor before making any trading decisions.

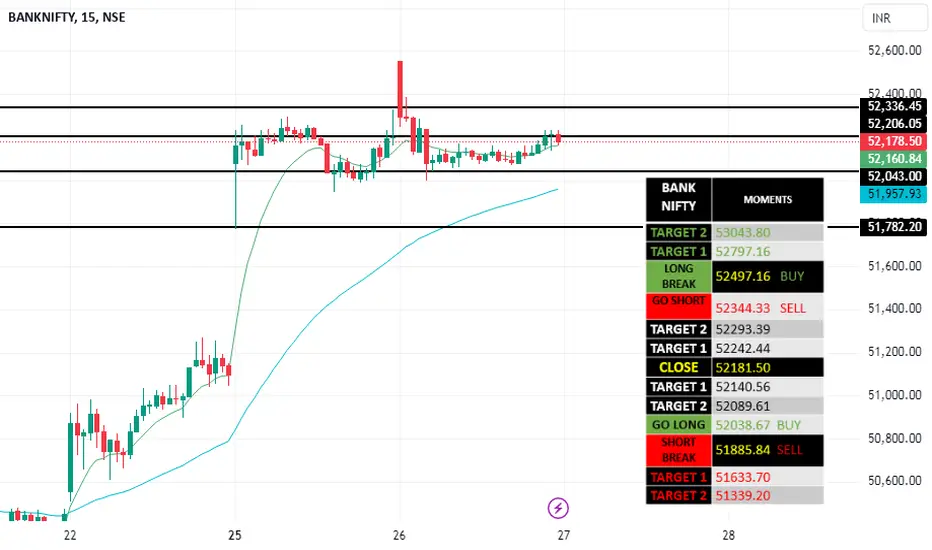
BANKNIFTY NOV 27 EXPIRY52000 CE & PE
TOTAL PREMIUM 600
SL 450
RR 1:2
Trailing 1:1
Target 900
Reason: Market seated at its resistance. Expecting a break in either side.
Bank Nifty Trend Analysis for Today – 26/11/2024Bank Nifty Trend Analysis for Today – "26/11/2024"
Key Levels for Bank Nifty
Average Level: 52,170 – This is the pivot point for today's session and a critical level to watch for market direction.
Upside Potential
If Bank Nifty sustains above the average level of 52,170, it signals bullish momentum.
First Resistance/Target: 52,300
A breakout above this level could indicate further strength in the index.
Second Resistance/Target: 54,300
Strong buying activity could drive the index toward this higher target, representing significant upside potential (+4%).
Downside Risk
If Bank Nifty breaks below 52,170, it may indicate bearish pressure.
First Support/Target: 52,000
A minor dip toward this level could still allow recovery if buying resumes.
Second Support/Target: 49,900
A sustained break below this zone may lead to a deeper correction (-4.3%).
Trend Expectation
Range-Bound or Breakout?
Likely to trade within the range of 52,000–52,300 during initial hours unless external triggers drive a decisive breakout.
A breakout above 52,300 could lead to a 1%–2% rally, while a breakdown below 52,000 could trigger a decline toward 49,900.
Trading Strategy for the Day
Bullish Setup:
Go long above 52,300, targeting 54,300.
Use 52,170 as a trailing stop-loss to manage risk.
Bearish Setup:
Go short below 52,000, targeting 49,900.
Place a stop-loss at 52,170 to protect against reversals.
Conclusion:
The 52,170 level will act as the pivot today. A clear breakout or breakdown will confirm the direction for Bank Nifty. Trade cautiously and follow disciplined risk management.
Bank Nifty 26th Forecast | NSE | Wait for Bearish Confirmationgrabbed max buy-side lq
likely move to bearish in coming days after bearish confirmation
waiting for the bearish confirmation today
market will reach to sell-side demand zone

[INTRADAY] #BANKNIFTY PE & CE Levels(26/11/2024)Today will be flat or slightly gap up opening expected in banknifty. After opening if banknifty starts trading above 52550 level then expected sharp upside rally upto 52950 level in today's session. Downside 52050 level will act as a strong support for today's session. Any major downside only expected below 51950 level.
Nifty Bank Prediction for 26th November 2024Nifty Bank Prediction for 26th November 2024
Nifty bank moments for intraday and option trading.
Bank Nifty opened higher at 52,046.35 on Monday, reaching an intraday high of 52,331.10 during the opening bell, marking a sharp intraday rally of approximately 1,000 points before closing at 52,207.50.
This performance extended Friday's gains, driven by strong buying interest in PSU stocks, which saw the PSU index rise by 7% over the last two sessions. The rally was fueled by positive market sentiment following the BJP's victory in the Maharashtra elections.
On the daily chart, Bank Nifty closed above the 50-day SMA with a gap-up opening, signaling short-term optimism. Looking ahead, the index has key support levels at 51,800 and 51,500, while resistance is anticipated around 52,600 and 53,000.

BANKNIFTY : Trading Levels and Plan for 26-Nov-2024Bank Nifty Trading Plan for 26th November 2024
Intro:
In the previous trading session, Bank Nifty showed a strong upward movement but faced resistance near the 52,200 - 52250 level, forming a consolidation pattern. The chart indicates key levels for the next trading day. Yellow trendlines represent a sideways movement, green trendlines represent a bullish trend, and red trendlines indicate a bearish trend. Based on the chart, here’s a detailed trading plan for 26th November 2024, covering all potential opening scenarios.
Gap Up Opening (200+ Points Above Previous Close):
If Bank Nifty opens above 52,460, the index will enter a key resistance zone (52,460–52,793). Watch for a breakout above 52,793. If it sustains above this level, look for bullish opportunities toward the next target at 53,200. If resistance at 52,460–52,793 holds and Bank Nifty shows signs of rejection, a pullback to 52,337 or even 52,199 is possible. Be cautious about reversals in this zone. Avoid aggressive longs if the price struggles near 52,460 and fails to break out decisively.
Flat Opening (Within ±50 Points):
Monitor price action at 52,337–52,460. This zone will act as the immediate resistance. If Bank Nifty consolidates or shows rejection here, expect a move toward the opening support at 51,936–51,866. For bullish opportunities, wait for a breakout above 52,460 with strong volume confirmation. Targets remain 52,793 and 53,200. If the index breaks below 52,199, the bearish scenario will dominate, and we may see levels around 51,866 or even the last intraday support at 51,649.
Gap Down Opening (200+ Points Below Previous Close):
A gap down below 52,199 will bring the focus to the 51,936–51,866 support zone. Watch for reversal patterns or strong buying cues in this area for a possible upward bounce. If the price breaks below 51,866, the index could slide further to test 51,649. A failure to hold 51,649 may trigger a deeper bearish move toward 51,500 or lower. Any bullish attempts will require the index to reclaim 52,199 with conviction before targeting 52,337 or higher.
Risk Management Tips for Options Trading: Always calculate risk-reward before entering a trade. Avoid taking trades with a risk-reward ratio below 1:2. Keep position size small, especially if trading volatile options or on uncertain days. Use stop-loss orders for every trade and stick to them. For intraday trading, avoid carrying losses into the next day. Avoid chasing trades after a significant move; wait for pullbacks or clear confirmation. Monitor implied volatility (IV) while trading options. High IV means premium decay can occur rapidly if momentum stalls.
Summary and Conclusion:
The 52,460 level remains the critical zone to watch for bullish momentum. A break and sustain above it could take Bank Nifty to 52,793 or higher. Conversely, failure to hold above 52,199 may lead to testing of lower supports at 51,936 and 51,649. Be cautious and wait for clear confirmation before executing trades. Sideways consolidation may occur if Bank Nifty remains stuck in the range of 52,199–52,460.
Disclaimer:
This analysis is for educational purposes only. I am not a SEBI-registered analyst. All views and levels mentioned here are based on personal technical observations. Please consult your financial advisor and perform your own research before trading or investing.

BANK NIFTY S/R for 26/11/24Support and Resistance Levels:
Support Levels: These are price points (green line/shade) where a downward trend may be halted due to a concentration of buying interest. Imagine them as a safety net where buyers step in, preventing further decline.
Resistance Levels: Conversely, resistance levels (red line/shade) are where upward trends might stall due to increased selling interest. They act like a ceiling where sellers come in to push prices down.
Breakouts:
Bullish Breakout: When the price moves above resistance, it often indicates strong buying interest and the potential for a continued uptrend. Traders may view this as a signal to buy or hold.
Bearish Breakout: When the price falls below support, it can signal strong selling interest and the potential for a continued downtrend. Traders might see this as a cue to sell or avoid buying.
20 EMA (Exponential Moving Average):
Above 20 EMA(50 EMA): If the stock price is above the 20 EMA, it suggests a potential uptrend or bullish momentum.
Below 20 EMA: If the stock price is below the 20 EMA, it indicates a potential downtrend or bearish momentum.
Trendline: A trendline is a straight line drawn on a chart to represent the general direction of a data point set.
Uptrend Line: Drawn by connecting the lows in an upward trend. Indicates that the price is moving higher over time. Acts as a support level, where prices tend to bounce upward.
Downtrend Line: Drawn by connecting the highs in a downward trend. Indicates that the price is moving lower over time. It acts as a resistance level, where prices tend to drop.
RSI: RSI readings greater than the 70 level are overbought territory, and RSI readings lower than the 30 level are considered oversold territory.
Combining RSI with Support and Resistance:
Support Level: This is a price level where a stock tends to find buying interest, preventing it from falling further. If RSI is showing an oversold condition (below 30) and the price is near or at a strong support level, it could be a good buy signal.
Resistance Level: This is a price level where a stock tends to find selling interest, preventing it from rising further. If RSI is showing an overbought condition (above 70) and the price is near or at a strong resistance level, it could be a signal to sell or short the asset.
Disclaimer:
I am not a SEBI registered. The information provided here is for learning purposes only and should not be interpreted as financial advice. Consider the broader market context and consult with a qualified financial advisor before making investment decisions.
BN | Short Trade | SwingBN as anticipated has gapped up straight into resistance zone and is struggling to find momentum.
I'm anticipating a failure from the highs through a price action and price to re-test the trend line drawn.
I have taken positions for December month expiry. 51600 PE bought.
I have hedged it with a far OTM PE Sell since I believe in trading only spreads unless it's a short burst trade.
Let's see...
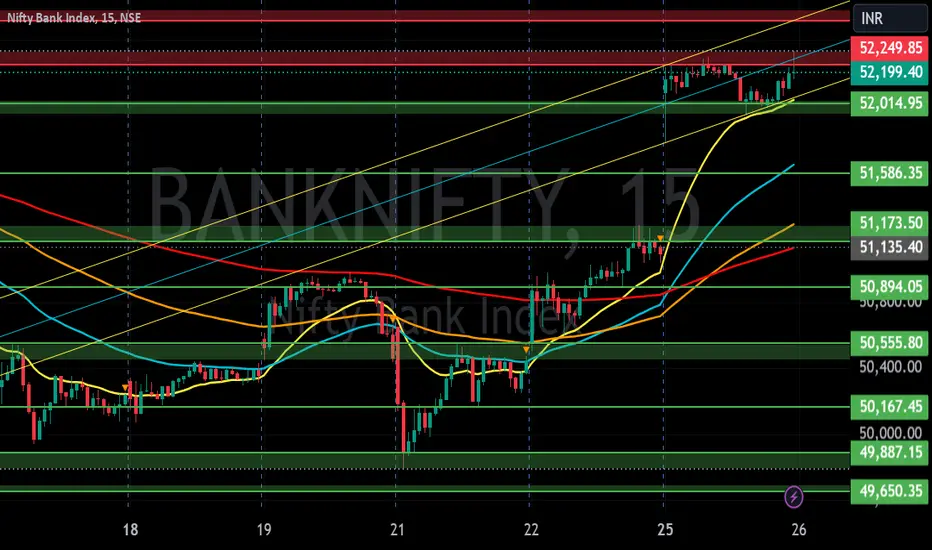
[INTRADAY] #BANKNIFTY PE & CE Levels(25/11/2024)Today will be huge gap up opening expected in banknifty almost near 52000 level. After opening if banknifty starts trading above 52050 level then this gap up bullish rally extend for further 500-1000 points towards to 52450 and 52950 levels. Any correction rally expected below 51950 level.
BANKNIFTY: INSTITUTIONAL LEVELS FOR 25/11/2024Overview
This trading system combines simplicity with powerful insights for accurate entries and exits. It is structured for active traders using the 5-minute timeframe who want to make clear, confident trading decisions in fast-moving markets.
Key Strategy Guidelines
Retest Entries : Aim to enter trades on retests rather than breakouts, offering better positioning.
Multiple Confirmations : Use more than one confirmation to validate each trade, helping avoid impulsive decisions.
ATM Options Focus : Stick to at-the-money (ATM) options or above for optimal liquidity and manageable risk.
System Explanation
This setup leverages volume, historical price action, and price ranges to pinpoint high-probability entry and exit points. This methodology is designed to reduce guesswork, allowing traders to manage trades with a consistent approach.
How It Works: Entry/Exit Signals
Blue Line : Signals potential long entry.
Red Line : Indicates potential short entry.
Tip : Align these signals with additional confirmations from your trading strategy for optimal performance.
Stop Loss and Take Profit Levels
Stop Loss:
Long Trades : Set your stop loss at the nearest red line below the entry point, or adjust based on whether the 5-minute candle crosses the red line.
Short Trades : Use the blue line above as the stop loss.
Take Profit:
Long Entries :Target the next red line above or exit if other indicators suggest a prudent exit.
Short Entries :Target the next blue line below following similar guidelines.
Timeframe Recommendation
This system is specifically optimized for the 5-minute timeframe, making it suitable for those trading shorter intervals with precision.
Risk Disclaimer
Trading involves high risk, and rapid price changes can lead to unexpected losses. Only trade with capital you can afford to lose, and carefully assess your financial situation and risk tolerance.
Join the Community Discussion
Engage with other traders to discuss strategies, share insights, and enhance your understanding of the markets. Let’s grow together as a community of traders.
Original Content
This trading system is the product of my own expertise and rigorous testing. It’s a unique approach developed through real market experience to offer a clear edge in trading.

Bank Nifty 26th Nov 2024Date 26th Nov 2024
Time 9:15 am IST
BIAS
Monthly-Bullish
Weekly-Bearish
Daily-Not Sure
4Hr-Not Sure
1Hr-Not Sure
TRADE
GAP UP- Wat and watch. Look for Put trade after making sure there is no fresh buying
GAP DOWN- Look for Call trade from 50600 levels.
All trades to have small positions and book profits fasters. Dont load up for riding trades.
