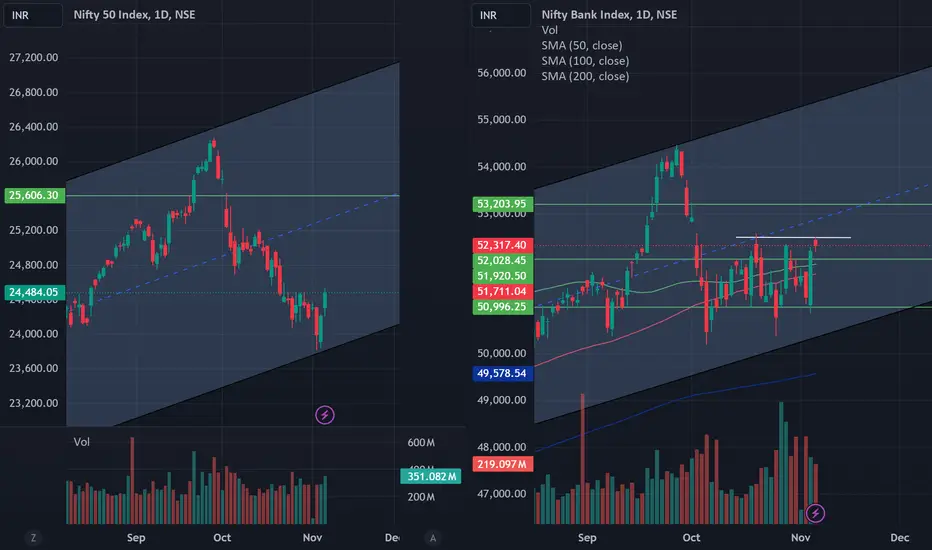
NIFTY 50 & BANKNIFTY Prediction: 07 November 2024Nifty shows the confirmation of a bullish piercing candle. Banknifty forms the like of a doji candle. It is on the trendline from where rejection may be possible. Nifty has big resistance at 24500 and 24800 and it didn't have any strong support nearby ATM. Banknifty has resistance at 52500 and 53000 and support at 52000.
Option Chain: Nifty has resistance at 24500 around 100 Cr contracts exist. Even after yesterday's rally a large amount of contracts have been added in call side at 24500. Which shows bearishness in the market. Banknifty has some resistance at 52500 and 53000. The new fresh contract has also been added at this level.
PCR: The overall PCR of Nifty is 0.85 and the nearby ATM is 0.59 --> Bearish view
Banknifty overall PCR is 0.83 and nearby ATM is 0.73. --> Neutral
OI Data: FII betting on a neutral market.
Pro shorts calls of 4.75 L and shorts puts 3.6 L.
Client shorts put 7.5 L and shorts call of 1.6 L.
Future Data: FII sold 482 Cr future which shows a bearish view.
FII Stock data: Even aftermarket shows a rally, FIIs still sell the future 4450 Cr future which shows that the market may go down. --> Bearish
Trade: A bearish move may be possible and it may be continued.
BANKNIFTY trade ideas
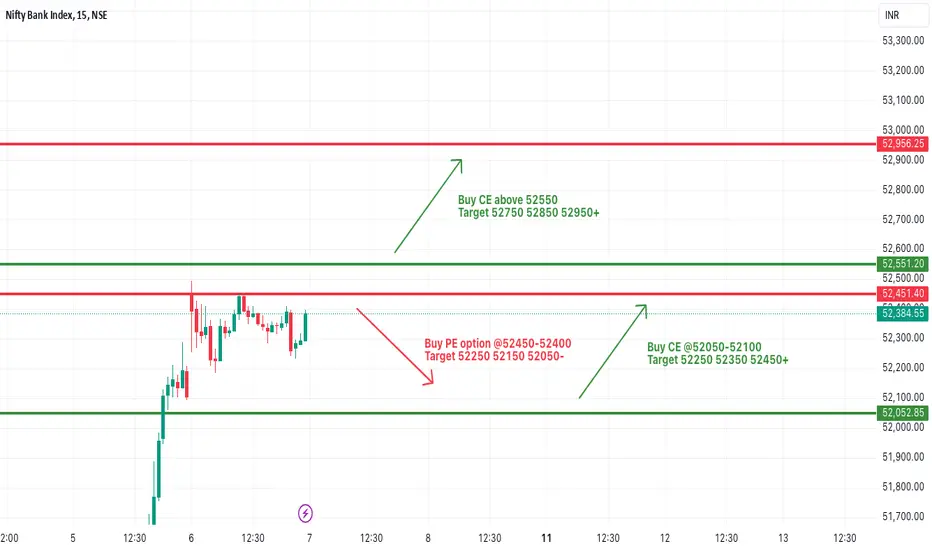
[INTRADAY] #BANKNIFTY PE & CE Levels(07/11/2024)Today will be gap up opening expected in banknifty near 52500 level. After opening if banknifty starts trading above 52550 level then possible strong upside bullish rally upto 52950 level in today's session. Downside 52050 level will act an important support for the session. Any major downside only expected below this level.
BANKNIFTY : Trading Levels and Plan for 07-Nov-2024Intro:
On the previous trading day, Bank Nifty exhibited a sideways trend in the zone that highlighted in yesterday's day plan and could not break that range, reaching resistance levels but pulling back slightly. The chart shows key zones for profit booking at 52,900 , opening resistance around 52,534 , and opening support at 52,109 . The price action at these levels will determine the trend continuation or possible reversal. Yellow lines indicate a sideways trend, green lines indicate bullish momentum, and red lines highlight potential bearish scenarios.
Opening Scenarios:
Gap Up Opening (200+ Points Above):
If Bank Nifty opens above 52,534 , watch for resistance around the 52,758 - 52,900 profit booking zone. A strong breakout above 52,900 can signal bullish continuation, providing entry opportunities for a quick upside trade with a stop-loss below 52,534 .
However, if the index faces resistance at this level, a pullback may ensue, suggesting a reversal towards the opening support at 52,109 . In this scenario, cautious long trades are advisable, targeting small profits while trailing the stop-loss.
Flat Opening:
If Bank Nifty opens around 52,384 , the opening resistance at 52,534 and support at 52,109 become critical zones. Price behavior around these levels will guide the trend:
A break above 52,534 could lead to a test of the profit booking zone ( 52,758 - 52,900 ).
A rejection at 52,534 can lead to a sideways trend, likely oscillating between 52,534 and 52,109 . Consider quick scalping trades with limited risk here.
If the price moves below 52,109 , expect a potential downward move, aiming for the buyer's support at 51,676 .
Gap Down Opening (200+ Points Below):
In the event of a gap-down opening near or below 52,109 , Bank Nifty may seek support at 51,676 . Observe if it finds stability here to confirm a buying opportunity for a potential rebound.
If 51,676 fails to hold, Bank Nifty may trend lower, with bearish momentum potentially extending to the lower support zone.
Conversely, a recovery above 52,109 could lead to a pullback rally towards 52,534 , presenting a quick rebound trade opportunity.
Risk Management Tips for Options Trading:
Use defined stop-losses based on support/resistance levels ( 52,534 , 52,109 , 51,676 ) to manage risk.
Avoid overleveraging, particularly during high volatility zones.
Consider deploying options strategies (e.g., spreads) to reduce premium costs and manage risk exposure.
Trail stop-losses as the price moves favorably to lock in profits.
Summary and Conclusion:
The key levels for Bank Nifty on 07-Nov-2024 are 52,534 (opening resistance), 52,109 (opening support), and 51,676 (buyer’s support). Monitor these zones for potential reversals or breakouts. Follow risk management guidelines strictly, particularly in options trading, to safeguard against adverse moves.
Disclaimer:
I am not a SEBI-registered analyst. The analysis and trading levels shared are based on technical patterns and personal views. Traders are advised to perform their due diligence or consult with a financial advisor before taking any trading action.

BANK NIFTY S/R for 7/11/24Support and Resistance Levels:
Support Levels: These are price points (green line/shade) where a downward trend may be halted due to a concentration of buying interest. Imagine them as a safety net where buyers step in, preventing further decline.
Resistance Levels: Conversely, resistance levels (red line/shade) are where upward trends might stall due to increased selling interest. They act like a ceiling where sellers come in to push prices down.
Breakouts:
Bullish Breakout: When the price moves above resistance, it often indicates strong buying interest and the potential for a continued uptrend. Traders may view this as a signal to buy or hold.
Bearish Breakout: When the price falls below support, it can signal strong selling interest and the potential for a continued downtrend. Traders might see this as a cue to sell or avoid buying.
20 EMA (Exponential Moving Average):
Above 20 EMA(50 EMA): If the stock price is above the 20 EMA, it suggests a potential uptrend or bullish momentum.
Below 20 EMA: If the stock price is below the 20 EMA, it indicates a potential downtrend or bearish momentum.
Trendline: A trendline is a straight line drawn on a chart to represent the general direction of a data point set.
Uptrend Line: Drawn by connecting the lows in an upward trend. Indicates that the price is moving higher over time. Acts as a support level, where prices tend to bounce upward.
Downtrend Line: Drawn by connecting the highs in a downward trend. Indicates that the price is moving lower over time. It acts as a resistance level, where prices tend to drop.
RSI: RSI readings greater than the 70 level are overbought territory, and RSI readings lower than the 30 level are considered oversold territory.
Combining RSI with Support and Resistance:
Support Level: This is a price level where a stock tends to find buying interest, preventing it from falling further. If RSI is showing an oversold condition (below 30) and the price is near or at a strong support level, it could be a good buy signal.
Resistance Level: This is a price level where a stock tends to find selling interest, preventing it from rising further. If RSI is showing an overbought condition (above 70) and the price is near or at a strong resistance level, it could be a signal to sell or short the asset.
Disclaimer:
I am not a SEBI registered. The information provided here is for learning purposes only and should not be interpreted as financial advice. Consider the broader market context and consult with a qualified financial advisor before making investment decisions.
BANKNIFTY Breaks Out! TP1 Achieved—Higher Targets in SightBANKNIFTY Technical Analysis:
BankNifty has demonstrated strong bullish momentum on the 15-minute timeframe, successfully hitting Target 1 (TP1) at ₹52,057.50. The price action suggests a continuation towards the remaining targets, supported by key technical indicators.
BANKNIFTY Trade Summary:
Entry Point: ₹51,733.25
Stop Loss (SL): ₹51,555.40
Targets:
TP1: ₹52,057.50 ✅ Achieved
TP2: ₹52,479.00
TP3: ₹52,900.50
TP4: ₹53,224.75
Key Observations:
Bullish Momentum: The index has broken above significant resistance levels, indicating strong buying pressure.
Risological Dotted Trendline : Price is maintaining above the Risological Dotted Trendline, confirming the upward trend.
Increased Volume: There's a noticeable rise in trading volume, adding confidence to the bullish move.
Market Context:
The positive movement in BankNifty aligns with optimistic market sentiments in the banking sector. Contributing factors may include favorable economic data, strong earnings reports from major banks, or broader market rallies.
Outlook:
With TP1 successfully reached, the focus shifts to the next targets:
TP2 at ₹52,479.00: A break above this level could accelerate bullish momentum.
TP3 and TP4: Achieving these targets would signify a robust uptrend and potential new highs.
Recommendations:
Monitor Price Action: Keep an eye on how the price behaves around TP2. A strong close above this level with sustained volume could indicate a move towards TP3 and TP4.
Risk Management : Maintain the stop loss at ₹51,555.40 to protect against unexpected market reversals.
Stay Informed: Watch for any news or events that could impact the banking sector or overall market sentiment.
Conclusion:
BankNifty's strong breakout and the achievement of TP1 signal a promising opportunity for traders. The alignment of the technical indicator Risological Swing Trader with positive market sentiment increases the likelihood of reaching the remaining targets. As always, prudent risk management and staying updated with market developments are essential for capitalizing on this trade setup.

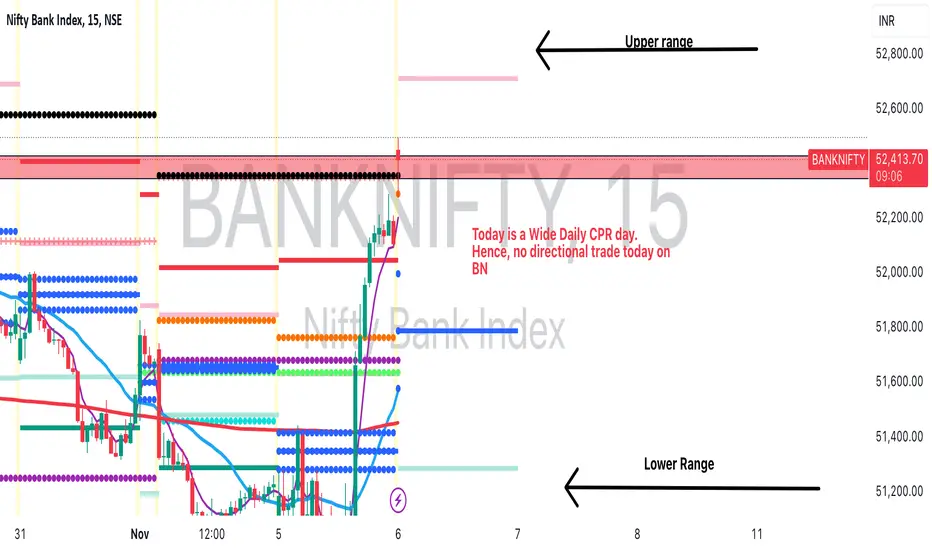
BN is expected to be Range Bound todayThose looking to trade Directionally today can avoid BN today. After the volatile moves today, BN is expected to be sideways for this expiry.
Those who want to play non directionally can create some Strangles.
Upper Range - 52,800
Lower Range - 51,200
BN would most likely expire in this range today.
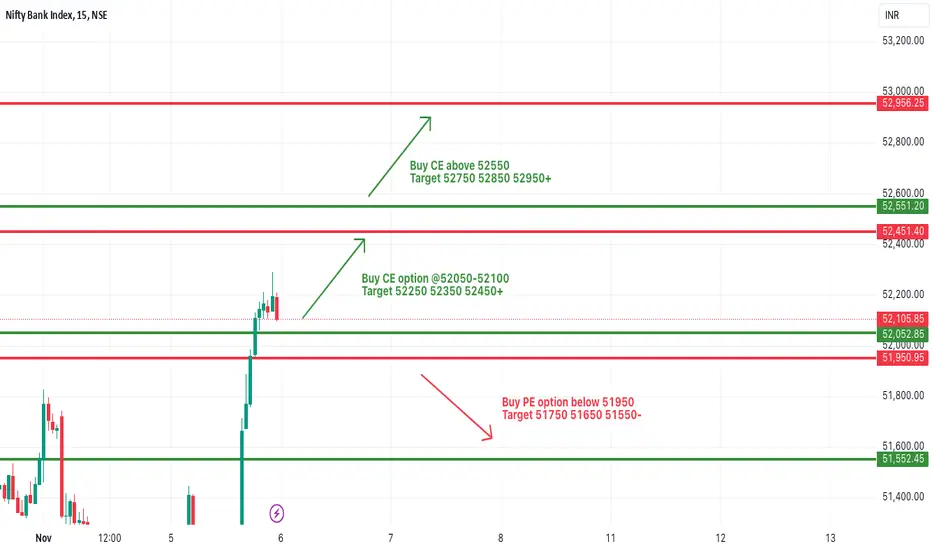
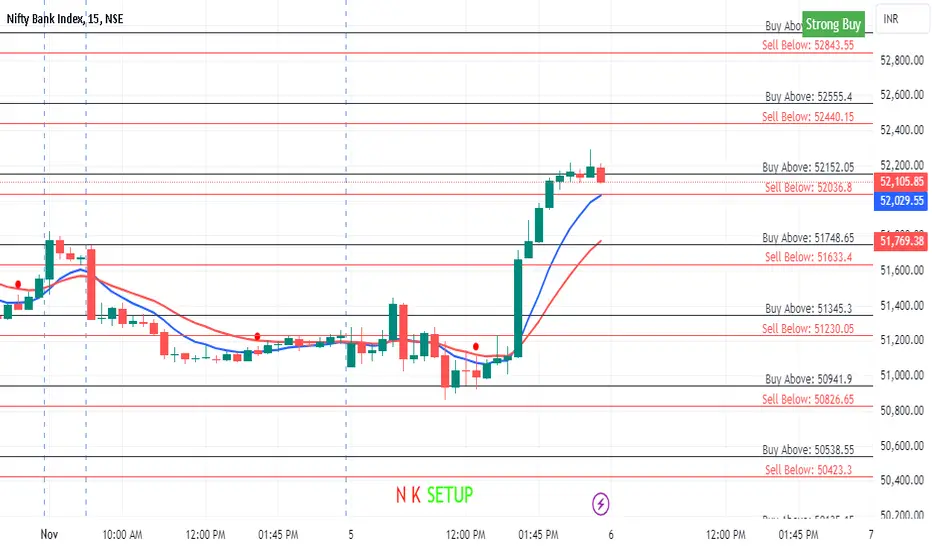
[INTRADAY] #BANKNIFTY PE & CE Levels(06/11/2024)Today will be gap up opening expected in banknifty near 52500 level. After opening if banknifty starts trading above 52550 level then possible strong upside bullish rally of 400-500+ points occurs in index. Downside 52050 will act as a strong support for today's session. Now any major downside only expected below 51950 level.
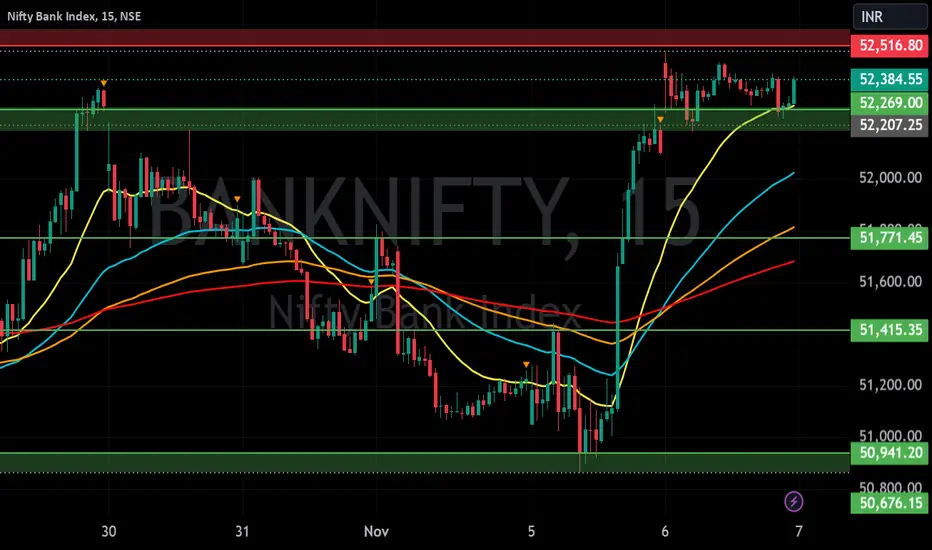
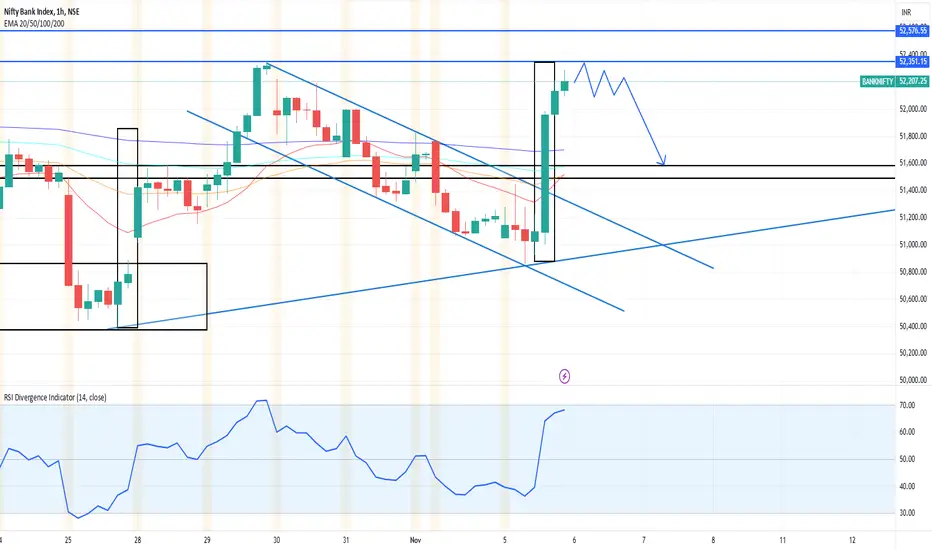
Bank Nifty at bullish conformation levelNifty Bank gained almost 1000 points yesterday. If the crucial resistance of the 50% retracement level at 52325 is broken, we can expect a good move on the upside.
For Educational and Paper Trading purposes only.

NIFTY 50 and BANKNIFTY Predtiction: 06 November 2024Nifty forming a bullish piercing cancel which indicates a small upmove and it's also creating a head and shoulder pattern where the right head is getting created. Banknifty forms a bullish engulfing candle which also shows bullish moves. If in Nifty and Banknifty today's high get break it will show an upward move. But still, 24500 and 52500 are the big resistance for Nifty and BankNifty respectively.
Option Chain: The OI data of the Nifty option chain shows heavy call writing at 24300 and 24500 levels even after today's call unwinding and support at 24000. Banknifty does not have that much resistance, but there is some resistance at 52500 and 53000, and some support at 51500.
PCR: Nifty 50 overall PCR and near ATM is 0.7 which is neutral. Banknifty overall PCR is 1.05 and around ATM is 0.63.
OI Data: FII is natural. Pro short 2L call and 3L puts shorts. Client shorts 4L calls and 6.5L puts.
Future Data: Still FII sold 2550 Cr in today's market.
Trade: In the morning hours, the market will go up and then it will go down. Tomorrow market may will try to reach mid of today candle to hit the SL of week trader and give the chance to enter to the new trader.
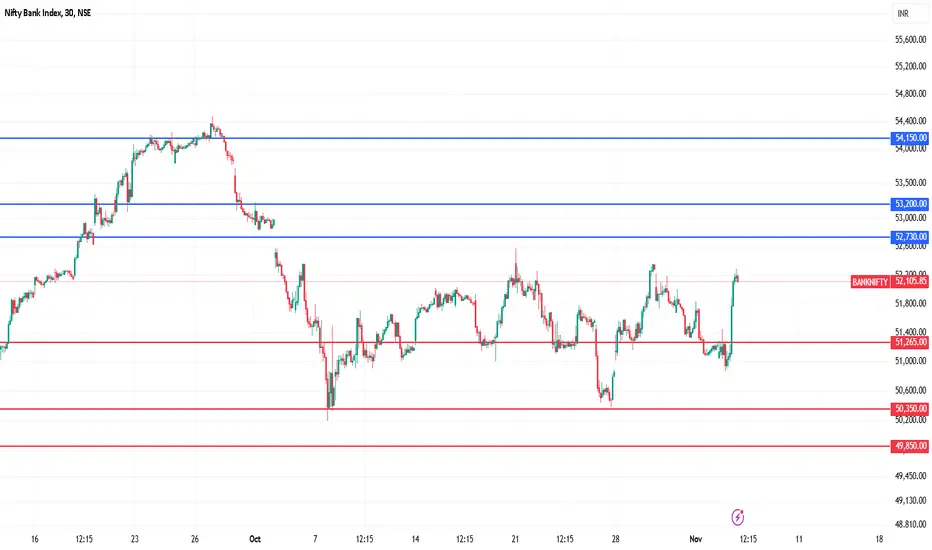
BNF SPOT- Blue Print for 06-NOV-2024Pivots Analysis.
l Monthly Pivot - LV Relationship
l Weekly Pivot - HV relationship
l Daily Pivot - LV Relationship -
l Pivot Width Analysis - Trending day - 0.75
Key levels.
l PDH/PDL - Done.
l PD Turning Points - Done
l PD Supply and Demand Zone (1HR TF) - Done
l Swing High/Low - Done
l Gaps - Done
l Virgin CPR - None
SUMMARY
Trading Plan
1. Bullish trade if there is a positive price action above 52360 level, stop at 52250 with target at 52520
2. Bullish trade is there is a positive price action above 51664 level, stop at 51564 with target at 51814
3. Bearish trade if there is a negative price action below 52360 level, stop at 52460 with target at 52210
4. Bearish trade if there is a negative price action below 51664 level, stop at 51764 with target at 51514
Two rules that I follow religiously while trading
► Don’t trade until 9:30, unless it’s a trending day.
► Once you Reach 1:1 RR ratio move your SL to cost and book 50% if you are a conservative trader.
This information is for education purpose only. So, please consult your financial advisor for any investment/trading advise.
Bonne chance!!
@Foxstox Wealth Management (Abhishek)
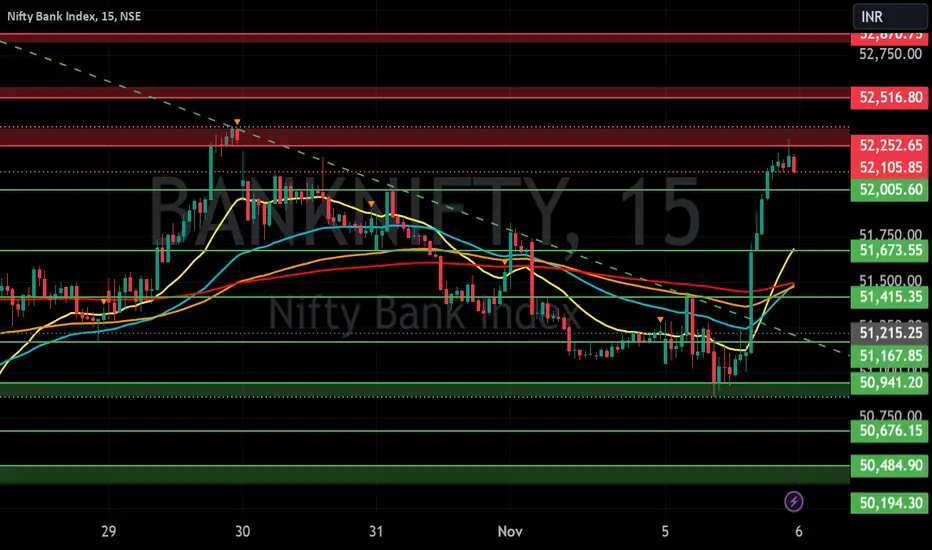
BankNiftySupport and Resistance Levels for 6th Nov 2024I’ve created a chart highlighting the key support and resistance levels for #banknifty, designed to help traders make informed decisions.
These levels provide critical insights for understanding potential price movements, enabling traders to identify ideal entry and exit points.
Use these levels to gain a clearer perspective on Sensex trends and optimize your trades with greater confidence.
Remember, these levels serve as guidance, so always combine them with your own analysis and risk management.
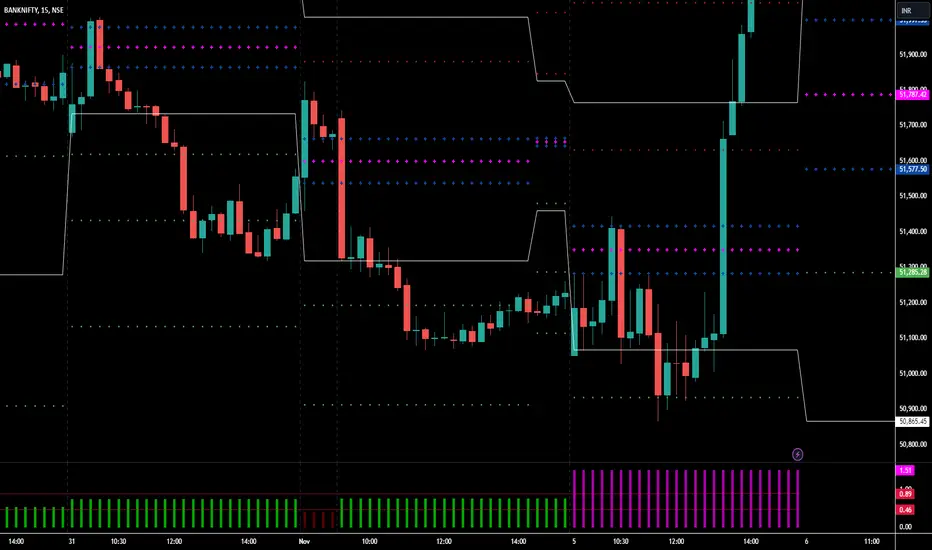
BANKNIFTY KEY LEVELS FOR 06/11/2024**Explanation:**
This trading system helps you avoid blind trades by providing confirmation for better entries and exits. It considers volume, past prices, price range and indiavix.
**Entry/Exit Points:**
- **Entry/Exit Lines:** Use the BLACK line for long trades and the RED line for short trades, based on confirmation from your trading plan.
- **Stop Loss:** For long trades, set the stop loss at the RED line below. For short trades, set it at the BLACK line above.
- **Take Profit:** For long trades, target the next RED line above. For short trades, target the next BLACK line below.
**Timeframe:**
Use a 5 timeframe for trading.
**Risk Disclaimer:**
This setup is for educational purposes. I'm not responsible for your gains or losses. Check the chart for more details.
Are you BULLISH? BankNifty Might get a little bearish!!Next consolidation phase of banknifty can be from 52200 to 51700. its a big range for expiry but if you play wise then only you can make money. Some madness is on the way, firstly trapping may happen with false breakouts.
But if breakout sustains, then enter the trade with control in quantity. Plan only 2 trades for the day that will be my suggestion
BANK NIFTY S/R for 6/11/24Support and Resistance Levels:
Support Levels: These are price points (green line/shade) where a downward trend may be halted due to a concentration of buying interest. Imagine them as a safety net where buyers step in, preventing further decline.
Resistance Levels: Conversely, resistance levels (red line/shade) are where upward trends might stall due to increased selling interest. They act like a ceiling where sellers come in to push prices down.
Breakouts:
Bullish Breakout: When the price moves above resistance, it often indicates strong buying interest and the potential for a continued uptrend. Traders may view this as a signal to buy or hold.
Bearish Breakout: When the price falls below support, it can signal strong selling interest and the potential for a continued downtrend. Traders might see this as a cue to sell or avoid buying.
20 EMA (Exponential Moving Average):
Above 20 EMA(50 EMA): If the stock price is above the 20 EMA, it suggests a potential uptrend or bullish momentum.
Below 20 EMA: If the stock price is below the 20 EMA, it indicates a potential downtrend or bearish momentum.
Trendline: A trendline is a straight line drawn on a chart to represent the general direction of a data point set.
Uptrend Line: Drawn by connecting the lows in an upward trend. Indicates that the price is moving higher over time. Acts as a support level, where prices tend to bounce upward.
Downtrend Line: Drawn by connecting the highs in a downward trend. Indicates that the price is moving lower over time. It acts as a resistance level, where prices tend to drop.
RSI: RSI readings greater than the 70 level are overbought territory, and RSI readings lower than the 30 level are considered oversold territory.
Combining RSI with Support and Resistance:
Support Level: This is a price level where a stock tends to find buying interest, preventing it from falling further. If RSI is showing an oversold condition (below 30) and the price is near or at a strong support level, it could be a good buy signal.
Resistance Level: This is a price level where a stock tends to find selling interest, preventing it from rising further. If RSI is showing an overbought condition (above 70) and the price is near or at a strong resistance level, it could be a signal to sell or short the asset.
Disclaimer:
I am not a SEBI registered. The information provided here is for learning purposes only and should not be interpreted as financial advice. Consider the broader market context and consult with a qualified financial advisor before making investment decisions.
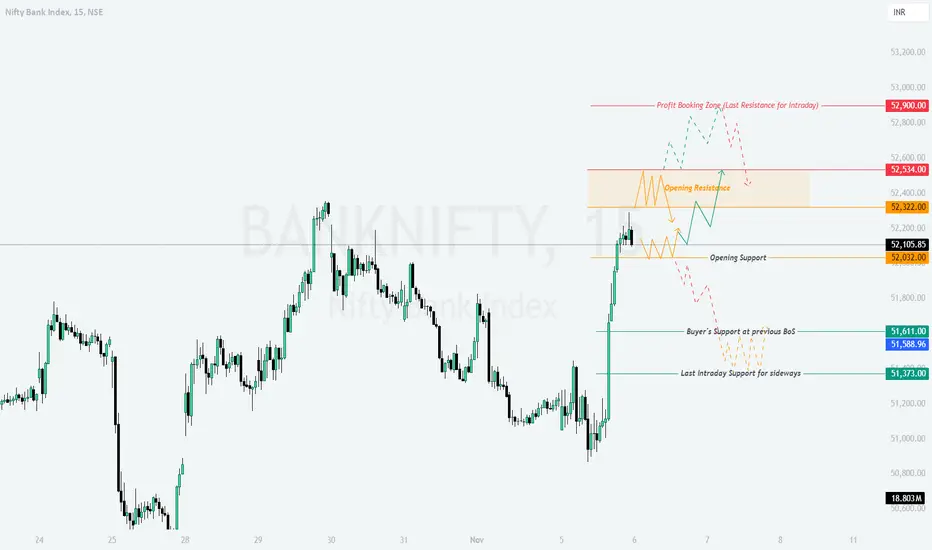
BANNIFTY : Trading Levels and Plan for 06-Nov-2024Previous Day's Chart Pattern Recap:
On the previous trading day, Bank Nifty displayed strong bullish momentum, with significant buying observed around the 51,900 support level. This momentum pushed prices higher, testing key resistance zones near 52,322 and approaching the Profit Booking Zone at 52,900 . The trend areas on the chart are marked with color coding, where Yellow represents a sideways trend, Green indicates a bullish trend, and Red shows a bearish trend.
06-Nov-2024 Trading Plan:
Opening Scenarios:
Gap Up Opening (200+ Points Above Closing Price):
- If Bank Nifty opens around the 52,322 resistance zone, traders should exercise caution as this could lead to profit-booking pressure near 52,534 .
- A confirmed breakout above 52,534 could lead to further bullish momentum, targeting the Profit Booking Zone at 52,900 .
- In case of rejection near 52,534 , look for bearish candles as a sign of weakness for a potential retracement back toward the Opening Support at 52,032 .
Flat Opening (Near Closing Price of 52,105):
- If the market opens flat around 52,105 , wait for the price action near the Opening Resistance at 52,322 .
- A successful breach and close above 52,322 can trigger a bullish move towards 52,534 and ultimately to the 52,900 zone if momentum sustains.
- Failure to cross 52,322 may signal a sideways move (yellow trend) between 52,032 and 52,322 . Intraday traders can trade the range until a clear breakout.
Gap Down Opening (200+ Points Below Closing Price):
- If Bank Nifty gaps down near 51,611 , observe the price action here. This level serves as an important buyer support at the previous breakout structure (BoS).
- A bounce from 51,611 may indicate buyer strength, aiming for a recovery back to 52,032 and higher.
- If 51,611 fails to hold, expect a bearish move toward the Last Intraday Support at 51,373 . This area will be crucial for bulls to defend to avoid further downside.
Risk Management Tips for Options Trading:
- Use tight stop losses, especially in volatile conditions. Adjust stop losses as per volatility in the market.
- Avoid holding options close to expiry without clear direction as time decay accelerates.
- Prefer trading options with sufficient liquidity to ensure better entry and exit without slippage.
- Maintain a risk-to-reward ratio of at least 1:2. Avoid chasing trades and wait for confirmations.
Summary & Conclusion:
For 06-Nov-2024, Bank Nifty’s crucial levels to monitor are 52,534 on the upside and 51,611 on the downside. A breakout above 52,534 may lead to bullish continuation, while a break below 51,611 could invite selling pressure. Monitor the chart closely, as Yellow, Green, and Red trends signal sideways, bullish, and bearish moves respectively.
Disclaimer: I am not a SEBI-registered analyst. The above analysis is for educational purposes only. Please do your research or consult with a certified financial advisor before trading.
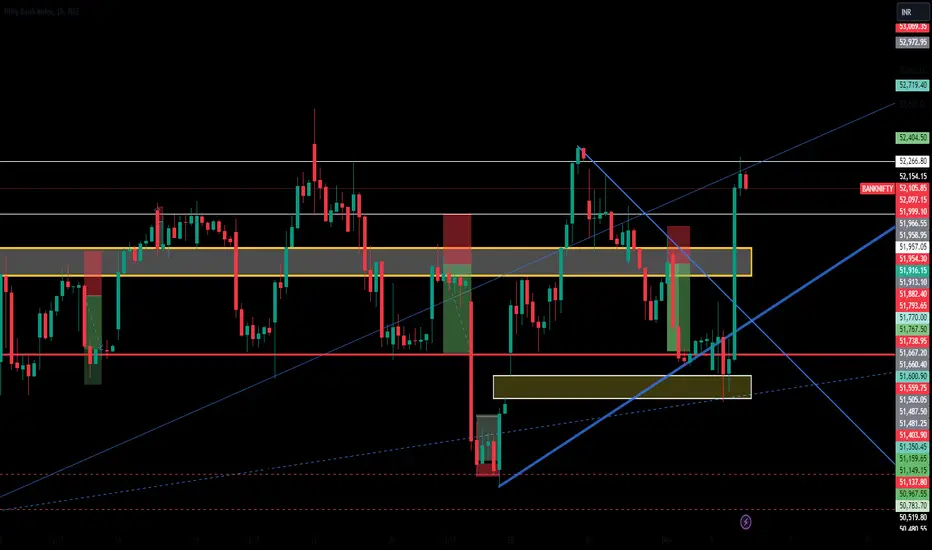
"Gaps are meant to be filled" --the Traditions Filled the much needed gap made 2 weeks ago, perfect bounce back filling some +ive sentiment in the overall markets
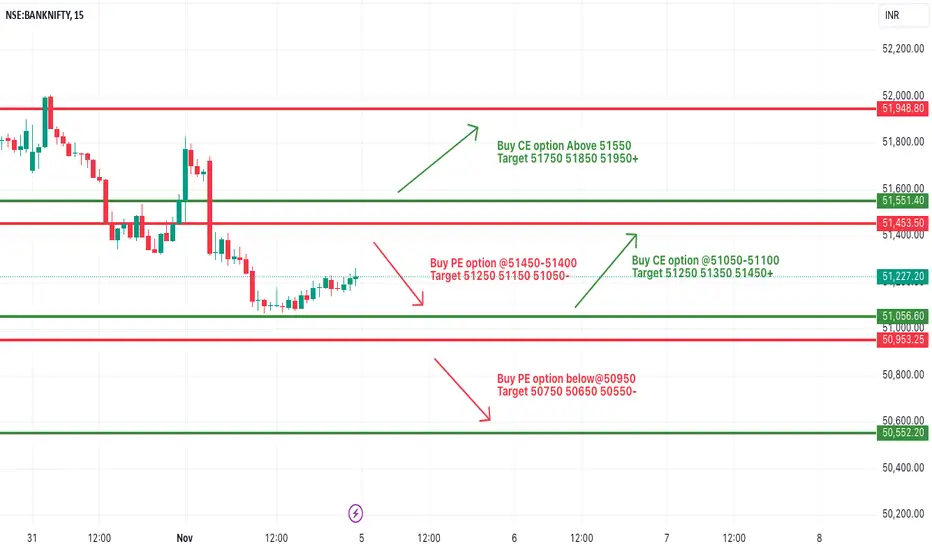
[INTRADAY] #BANKNIFTY PE & CE Levels(05/11/2024)Today will be slightly gap up opening expected in banknifty. Possible banknifty will open near 51450 level. After opening it will face resistance at this level and expected downside from this level. Strong downside expected if banknifty starts trading below 50950 level. Any bullish rally only expected if banknifty starts trading and sustain above 51550 level.
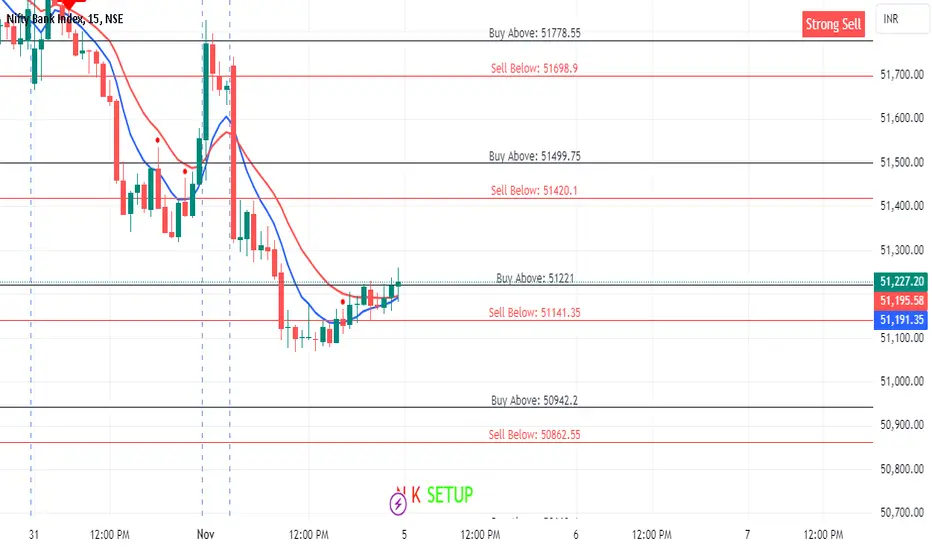
BANKNIFTY KEY LEVELS FOR 05/11/2024//@description
// All credit goes to Tony for the concept of this indicator. His Trading View link: tradingview.sweetlogin.com
// Note: The calculation method in this indicator differs from Tony's, but the concept is derived from his work.
**Explanation:**
This trading system helps you avoid blind trades by providing confirmation for better entries and exits. It considers volume, past prices, price range and indiavix.
**Entry/Exit Points:**
- **Entry/Exit Lines:** Use the BLACK line for long trades and the RED line for short trades, based on confirmation from your trading plan.
- **Stop Loss:** For long trades, set the stop loss at the RED line below. For short trades, set it at the BLACK line above.
- **Take Profit:** For long trades, target the next RED line above. For short trades, target the next BLACK line below.
**Timeframe:**
Use a 5 timeframe for trading.
**Risk Disclaimer:**
This setup is for educational purposes. I'm not responsible for your gains or losses. Check the chart for more details.
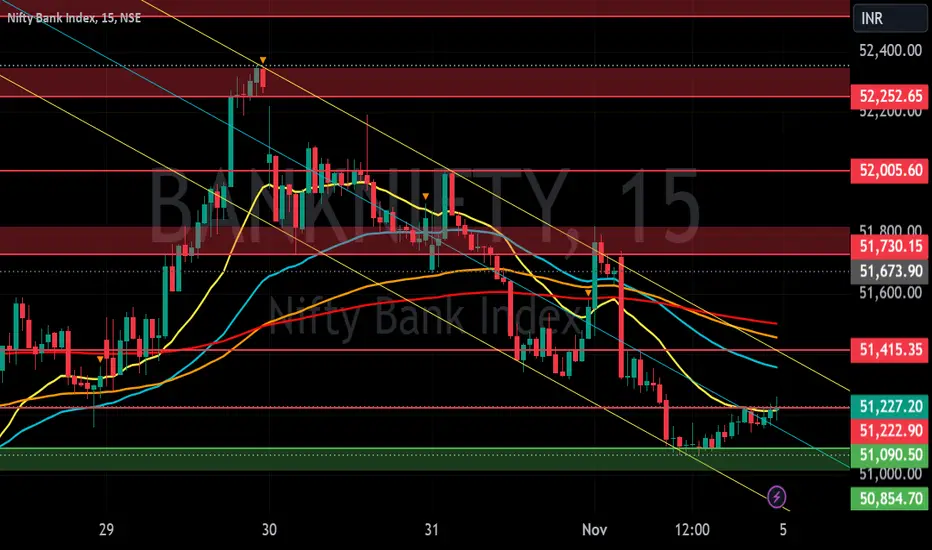
BANKNIFTY : Trading Levels and Plan for 05-Nov-2024On 04-Nov-2024, Bank Nifty showed a bearish action with the first tick of opening, closing near **51,227** with noticeable volatility. The chart reflects clear support near **50,829** and **50,704**, while resistance zones are seen at **51,494** and **51,729**. The **Yellow trend** represents a sideways market, the **Green trend** signals bullish momentum, and the **Red trend** indicates bearish moves.
Trading Plan for 05-Nov-2024:
Gap Up Opening (200+ points):
If Bank Nifty opens with a gap-up above **51,494**, the index will likely face intraday resistance at **51,729**. A breakout above this level can push Bank Nifty towards **52,082**, the next key resistance level, which might induce sideways movement.
However, failure to sustain above **51,729** could result in a pullback towards **51,494** or even a retest of **51,366**, the opening support/resistance level.
Actionable Plan:
- **Buy** on a sustained move above **51,729** with a target of **52,082**.
- **Stop Loss:** Below **51,494** on a 15-minute candle close.
Flat Opening:
If Bank Nifty opens flat near **51,227**, the focus will be on price action around the **51,366** level. A breakout above **51,494** could initiate bullish momentum, while a failure to break this resistance will result in a sideways trend (Yellow trend) with a potential retest of **51,009** (opening support).
In case Bank Nifty breaks **51,009**, expect a bearish move towards **50,829** and **50,704**.
Actionable Plan:
- **Buy** on a breakout above **51,366**, targeting **51,494**.
- **Sell** below **51,009**, with a target of **50,829**.
- **Stop Loss:** Place a stop loss near **51,227** for both buy and sell strategies.
Gap Down Opening (200+ points):
If Bank Nifty opens with a gap-down around **50,829** or below, the focus shifts to the **Buyer’s Support Zone** around **50,704**. A strong recovery from this zone could lead to a bounce back towards **51,009** or even higher.
However, if the index fails to hold **50,704**, expect further downside pressure, with the next major support at **50,105**. Keep in mind that aggressive selling could lead to a bearish continuation (Red trend).
Actionable Plan:
- **Buy** near **50,704**, with a target of **51,009**.
- **Sell** below **50,704**, aiming for **50,105**.
- **Stop Loss:** Below **50,704** on a 15-minute candle close.
Risk Management Tips for Options Trading:
- Consider using spreads to limit risk while taking advantage of directional moves.
- Keep positions light during volatile openings and focus on defined support/resistance levels.
- Avoid holding short-term options over the weekend unless there’s a clear directional bias.
Summary and Conclusion:
Key levels to watch for 05-Nov-2024 include **51,494** as intraday resistance and **50,704** as strong support. A gap-up or flat opening presents potential opportunities for bullish trades above **51,366**, while a gap-down opening could provide buy opportunities near **50,704**. As always, respect support/resistance zones and wait for confirmation before entering positions.
Disclaimer: I am not a SEBI-registered analyst. This trading plan is based on technical analysis and should not be considered financial advice. Please consult with your financial advisor before making any trading decisions.

BANK NIFTY S/R for 5/11/24Support and Resistance Levels:
Support Levels: These are price points (green line/shade) where a downward trend may be halted due to a concentration of buying interest. Imagine them as a safety net where buyers step in, preventing further decline.
Resistance Levels: Conversely, resistance levels (red line/shade) are where upward trends might stall due to increased selling interest. They act like a ceiling where sellers come in to push prices down.
Breakouts:
Bullish Breakout: When the price moves above resistance, it often indicates strong buying interest and the potential for a continued uptrend. Traders may view this as a signal to buy or hold.
Bearish Breakout: When the price falls below support, it can signal strong selling interest and the potential for a continued downtrend. Traders might see this as a cue to sell or avoid buying.
20 EMA (Exponential Moving Average):
Above 20 EMA(50 EMA): If the stock price is above the 20 EMA, it suggests a potential uptrend or bullish momentum.
Below 20 EMA: If the stock price is below the 20 EMA, it indicates a potential downtrend or bearish momentum.
Trendline: A trendline is a straight line drawn on a chart to represent the general direction of a data point set.
Uptrend Line: Drawn by connecting the lows in an upward trend. Indicates that the price is moving higher over time. Acts as a support level, where prices tend to bounce upward.
Downtrend Line: Drawn by connecting the highs in a downward trend. Indicates that the price is moving lower over time. It acts as a resistance level, where prices tend to drop.
RSI: RSI readings greater than the 70 level are overbought territory, and RSI readings lower than the 30 level are considered oversold territory.
Combining RSI with Support and Resistance:
Support Level: This is a price level where a stock tends to find buying interest, preventing it from falling further. If RSI is showing an oversold condition (below 30) and the price is near or at a strong support level, it could be a good buy signal.
Resistance Level: This is a price level where a stock tends to find selling interest, preventing it from rising further. If RSI is showing an overbought condition (above 70) and the price is near or at a strong resistance level, it could be a signal to sell or short the asset.
Disclaimer:
I am not a SEBI registered. The information provided here is for learning purposes only and should not be interpreted as financial advice. Consider the broader market context and consult with a qualified financial advisor before making investment decisions.
BankniftyBanknifty tomorrow little gap up and continue down trend
It is break above 52100 move to uptrend otherwise continue down trend

Let's see if I know anything about trading!! BankniftyIs it a flag and pole pattern in Banknifty with next target of 53000? What do you think? this week banknifty will make a big move upwards?

BN could possibly trend this month and have a big fall!Between Nifty and BN, BN is expected to trend more this month after looking at the Daily charts.
Either monthly position can be taken by buying the ATM / ITM / OTM PE (Not too far OTM) and then it can be hedged with the Far OTM PE short.
For instance, 51400 PE or 51,100 PE is a good bet which can be bought.
Another strategy would be to play it intraday basis with first target at 51,000.
