BHARAT BIJLEEBharat Bijlee Ltd. is a leading industrial electrical equipment manufacturer specializing in power transformers, electric motors, drives & automation, and project solutions. It caters to segments such as infrastructure, real estate, utilities, and OEMs. The stock is currently trading at ₹3,267 and is attempting a trend continuation post a broad consolidation, with fresh volume and Fibonacci alignment supporting breakout momentum.
Bharat Bijlee Ltd. – FY22–FY25 Snapshot
Sales – ₹750 Cr → ₹842 Cr → ₹923 Cr → ₹1,015 Cr – Steady growth driven by infra push and OEM demand
Net Profit – ₹58.3 Cr → ₹72.1 Cr → ₹84.6 Cr → ₹96.5 Cr – Margin expansion with operating scale
Company Order Book – Moderate → Strong → Strong → Strong – Solid pipeline in drives & automation
Dividend Yield (%) – 0.84% → 1.07% → 1.28% → 1.38% – Consistent payout with moderate yield
Operating Performance – Moderate → Strong → Strong → Strong – Increasing efficiency and utilization
Equity Capital – ₹5.69 Cr (constant) – Tight capital structure
Total Debt – ₹24 Cr → ₹19 Cr → ₹13 Cr → ₹10 Cr – Deleveraging over time
Total Liabilities – ₹302 Cr → ₹312 Cr → ₹319 Cr → ₹325 Cr – Stable with managed debt component
Fixed Assets – ₹123 Cr → ₹129 Cr → ₹136 Cr → ₹141 Cr – Conservative capex, efficiency-focused
Latest Highlights FY25 net profit grew 14.1% YoY to ₹96.5 Cr; revenue increased 10% to ₹1,015 Cr EPS: ₹169.54 | EBITDA Margin: 24.2% | Net Margin: 9.51% Return on Equity: 23.8% | Return on Assets: 12.7% Promoter holding: 68.73% | Dividend Yield: 1.38% New orders secured in industrial automation and high-efficiency motor vertical Capacity utilization improving across transformer and drives segments
Institutional Interest & Ownership Trends Promoter holding remains strong at 68.73%, with no dilution or pledging Recent quarters show consistent DII interest, particularly from infrastructure-focused mutual funds Delivery volume breakout confirms accumulation by mid-cap value portfolios HNI buying noted on trend continuation days aligned with breakout zones
Business Growth Verdict Yes, Bharat Bijlee is scaling gradually with deep infrastructure penetration and technical pedigree Margins improving through high-value products and services Balance sheet remains lean and de-risked with low debt levels Capex aligned with energy efficiency and industrial modernization trends
Company Guidance Management expects mid-teen revenue growth in FY26, driven by expansion in transformer orders, industrial automation, and OEM tie-ups Operating margins projected to sustain above 23% Strategic investments planned in digital controls and smart motor solutions
Final Investment Verdict Bharat Bijlee Ltd. represents a focused electrical capital goods play with consistent profitability, de-risked balance sheet, and high promoter alignment. Supported by trend continuation on monthly charts and volume strength near breakout zones, the stock is a candidate for staggered entry for investors seeking infrastructure-led manufacturing exposure with margin stability and institutional tailwinds.
BBL trade ideas

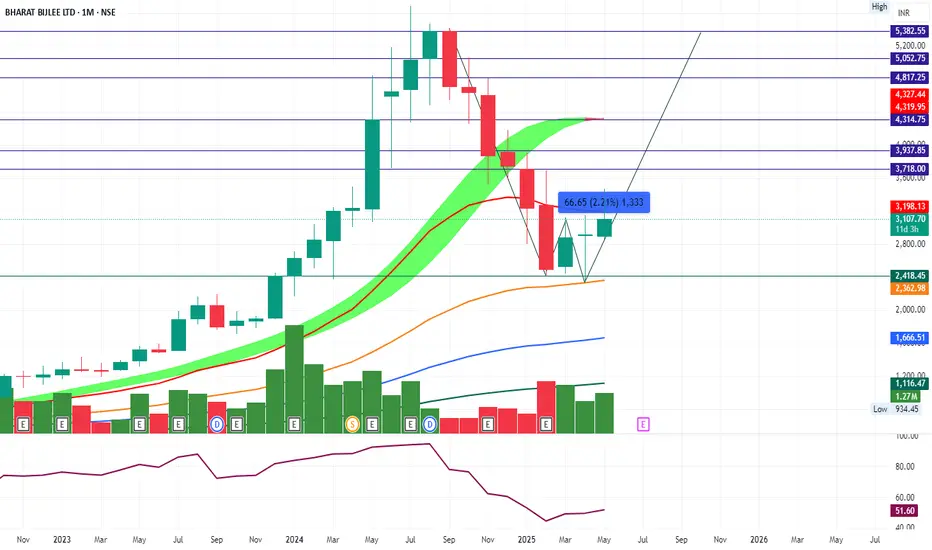
Bharat Bijlee Ltd.*Bharat Bijlee Ltd.*
*W* formation on Monthly basis.
Strong Bouceback from Tripple Support Zone.
Volume Traction picking up.Today Gap (DTF) Covered with sudden Kneejerk reaction.
RSI: 1H W<M. Above 1H in Bullish zone.
EMAs: Widening Gaps amongst 50 /100 /200 levels on Monthly Basis.
_Respective Monthly Resistance levels as likely Targets._
3718 / 3937 / 4314 / 4817 / 5052 / 5382
*Trail SL with Upside*
*Book Profit as per Risk Appetite*
Improving Financials. Rising Revenue on Qtrly /Yrly basis. Consistent Profitability Margins. Growing TNW, Negligible Debt Improving To/FA Ratio. Improving WC Cycle. +ve CF from Ops. ~Consistent RoE / ROCE/ RoA
Promoter Stake Constant.
Concerns:
Decline in FII Stake.
*This is an Opinion. Do your own research as well.*
*_Happy Investing_*🤓
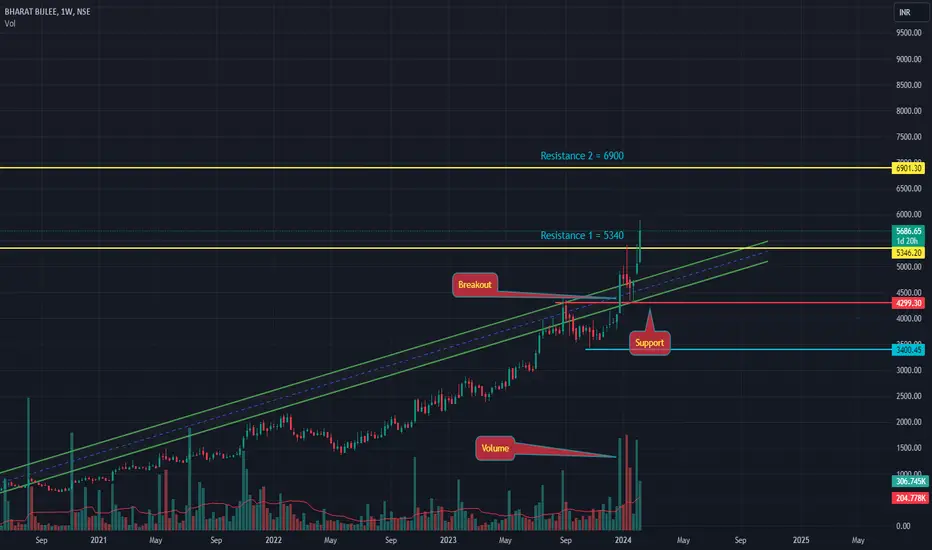
BBL- Long Setup, Move is ON.....Stock name = Bharat Bijlee Limited.
✅#BBL trading above Resistance of 5340
✅Next Resistance is at 6900
✅Moved 17% in 6 Weeks
Weekly chart setup
Chart is self explanatory. Levels of breakout, possible up-moves (where stock may find resistances) and support (close below which, setup will be invalidated) are clearly defined.
Disclaimer: This is for demonstration and educational purpose only. this is not buying and selling recommendations. I am not SEBI registered. please consult your financial advisor before taking any trade.
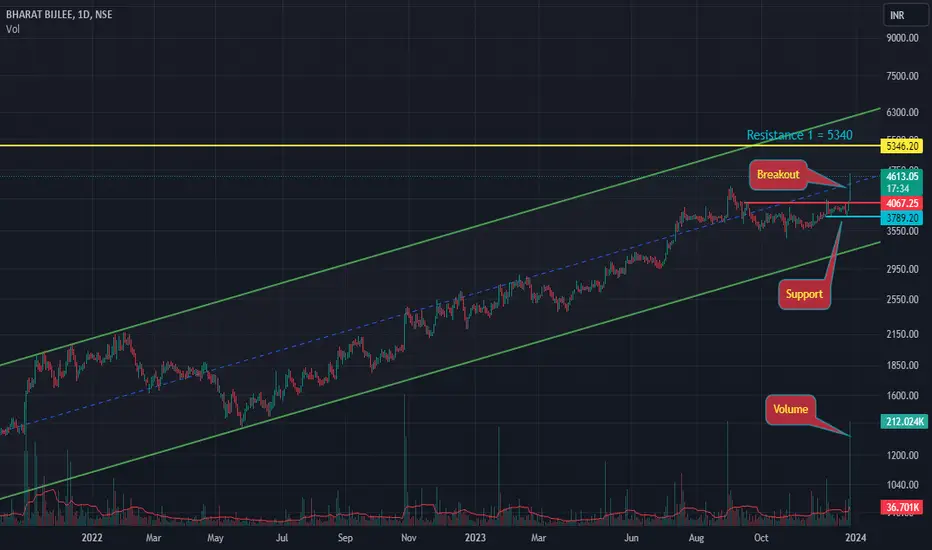
BBLStock name = Bharat Bijlee Limited.
Daily chart setup
Chart is self explanatory. Levels of breakout, possible up-moves (where stock may find resistances) and support (close below which, setup will be invalidated) are clearly defined.
Disclaimer: This is for demonstration and educational purpose only. this is not buying and selling recommendations. I am not SEBI registered. please consult your financial advisor before taking any trade.
Channel Breakout - BHARAT BIJLEEPlease look into the chart for a detailed understanding.
Consider these for short-term & swing trades with 2% profit.
For BTST trades consider booking
target for 1% - 2%
For long-term trades look out for resistance drawn above closing.
Please consider these ideas for educational purpose
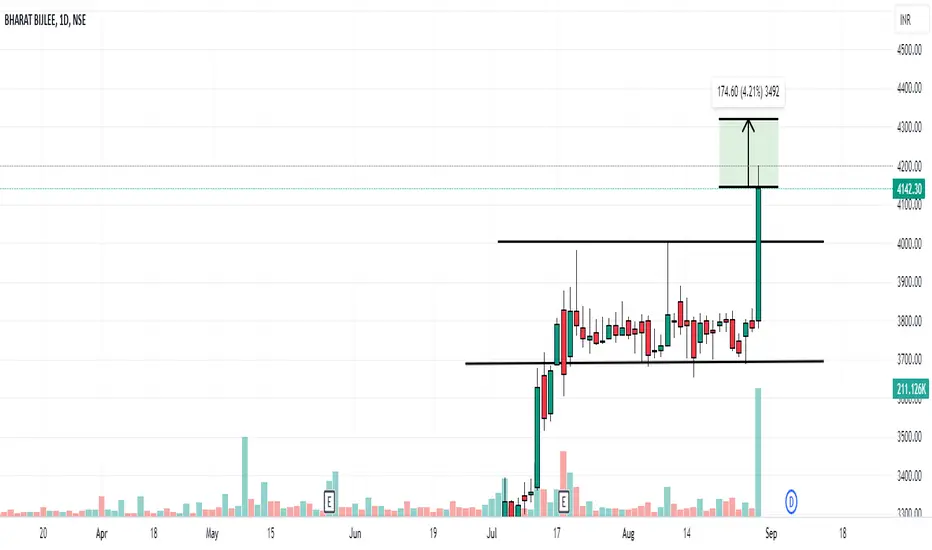
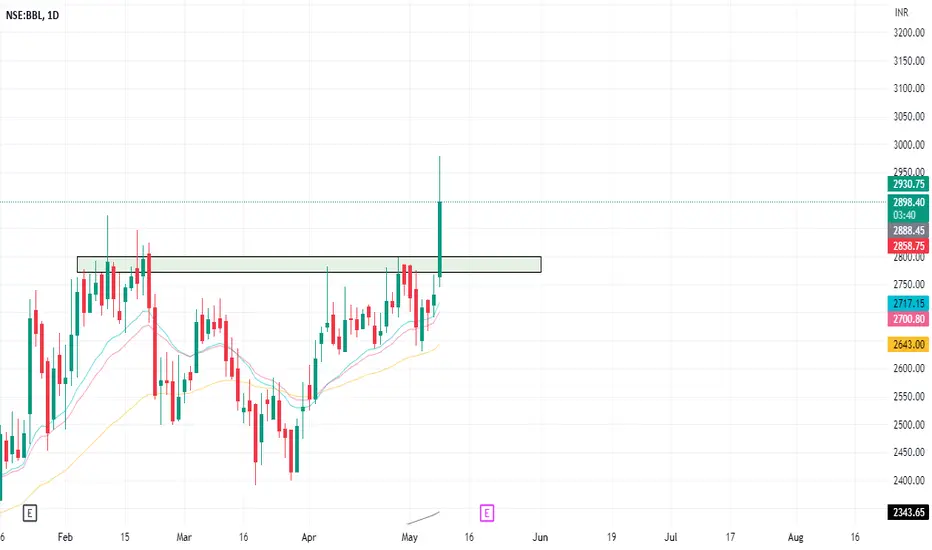
Bharat Bijlee-Nice breakoutBharat Bijlee-Nice breakout.
Capital to be deployed- 20k
Investing Price -3145-3155
Breakout Price -3142
Stoploss-2790
Targets-4568-4715
#bharatbijlee #StockMarket #StocksToBuy #StocksInFocus #stockstowatch #stocktrading #SwingTrading #Breakout
Bharat bijlee strongWill be taking long position in bharat bijlee.
Deploying 40% of trading allocation amount.
SL 2740
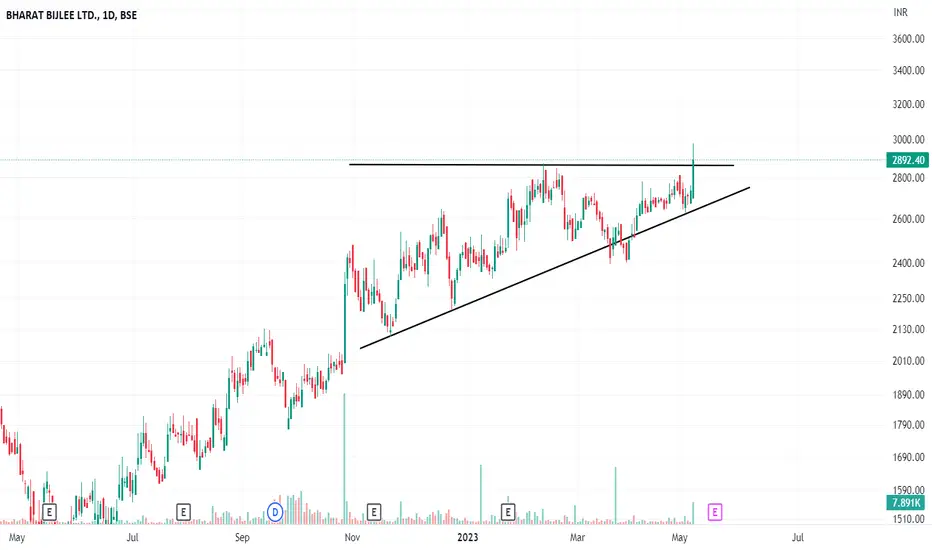
Triangle Pattern BreakoutPlease look into the chart for a detailed understanding.
Consider these for short-term & swing trades with 2% profit.
For BTST trades consider booking
target for 1% - 2%
For long-term trades look out for resistance drawn above closing.
Please consider these ideas for educational purpose
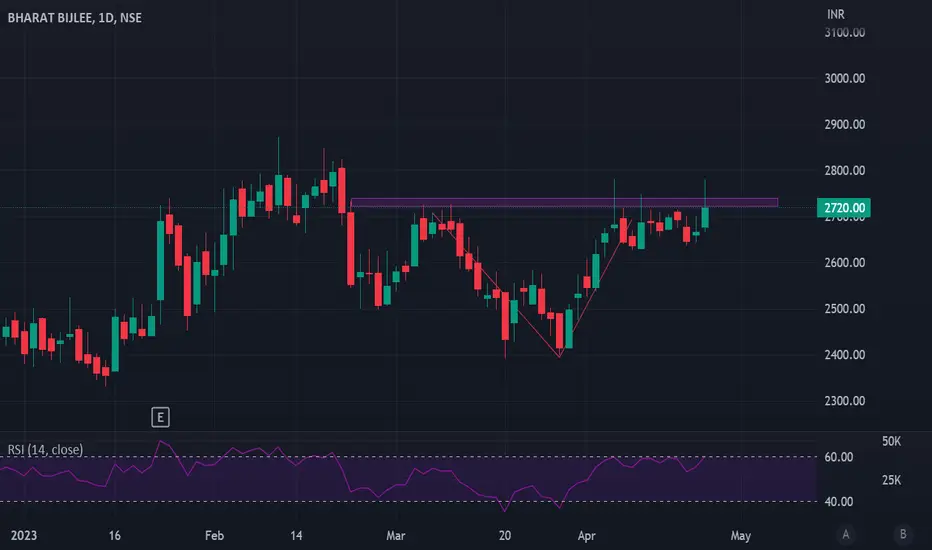
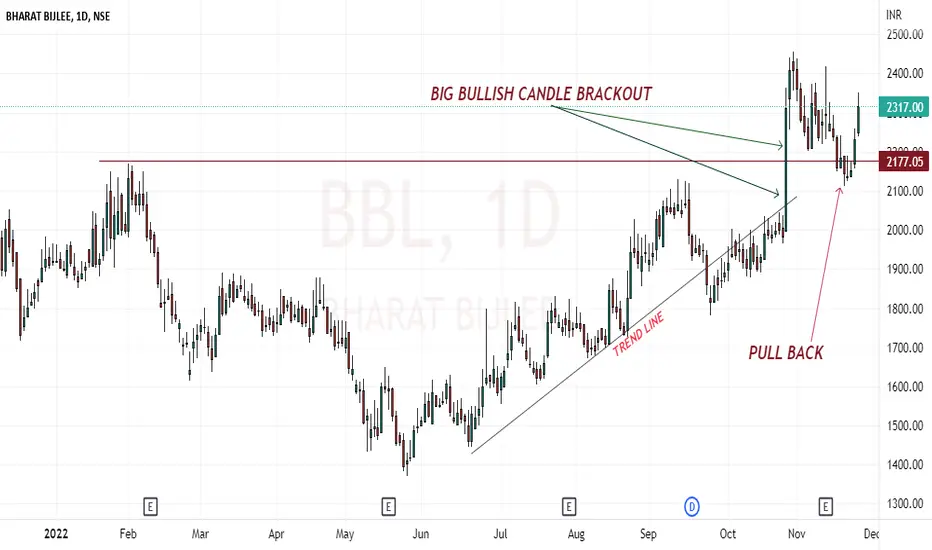
BHARAT BIJLEE DAILY CHART : Lots of price actionThe share of Bharat Bijlee daily chart lots of price action you can learn, if you are interested read below
The first learn the trend line after 21st Jun the share follow the trend line, after trend line breackdown the trend line work like resistance
27oct 2022 the share strong bullish candle formation this candle break the previous high and trend line
after breackout share share is pullback, after pullback this is now good for the entry
What you think, please comment
Bharat bijlee - positional long ideaI like this stock chart pattern, it is making regular higher lows. Go long at current market price and increase your positions above 1820 on a daily closing basis. Chart has potential to reach 1900/1950 in short to medium term. keep a stop loss below 1720 on a daily closing basis.
VCP baseStock is drifting sideways near pivot with very low volumes.
Volume is significantly less on red days absorbing available supply.
Volume spike on up days indicating accumulation from big guys.
A big move is expected.
Publishing for my own reference.
Not an investment or trading advise.

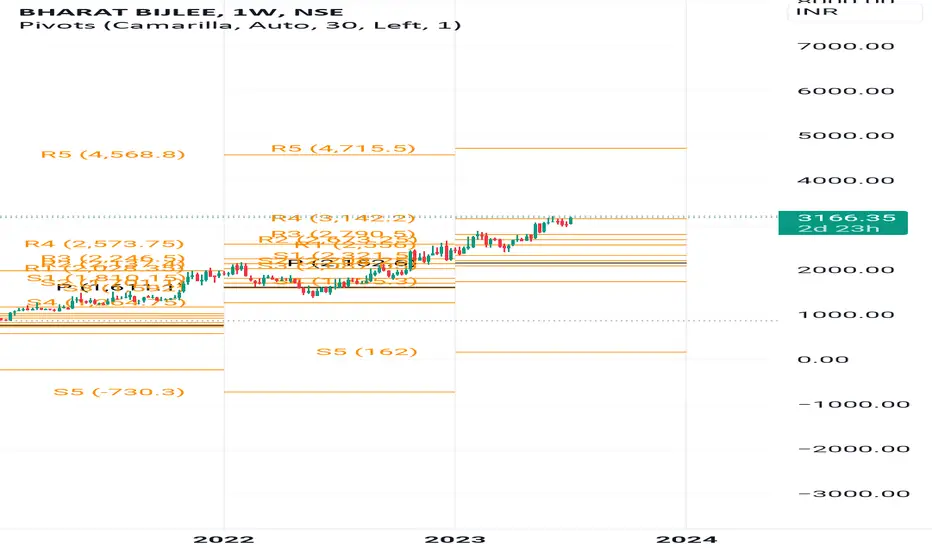
Bharat Bijlee Ready to rockWait for monthly close, 14-year big breakout. Wait for monthly candle close above levels and yeah roll over it.

BBL NSE BHARAT BIJLEE IS BULLISH ABOVE 1790BBL NSE BHARAT BIJLEE is bullish if 1790 holds. New 52WeekHigh. Multiyear Breakout.
*** Educational purpose only.
NSE:BBL

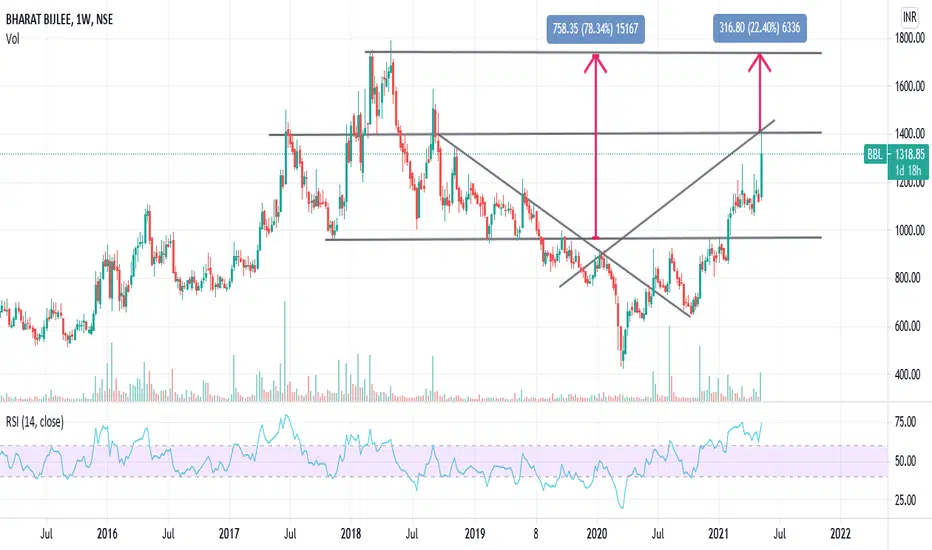

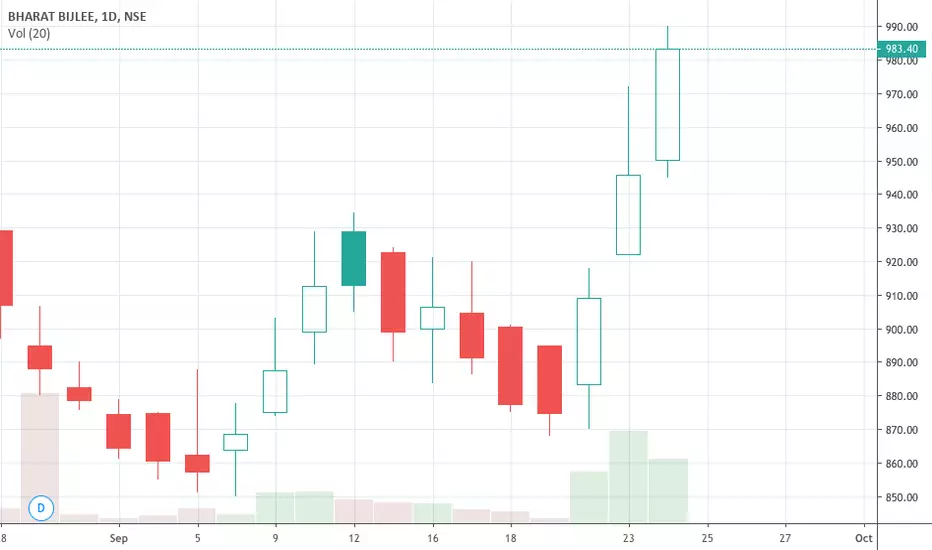
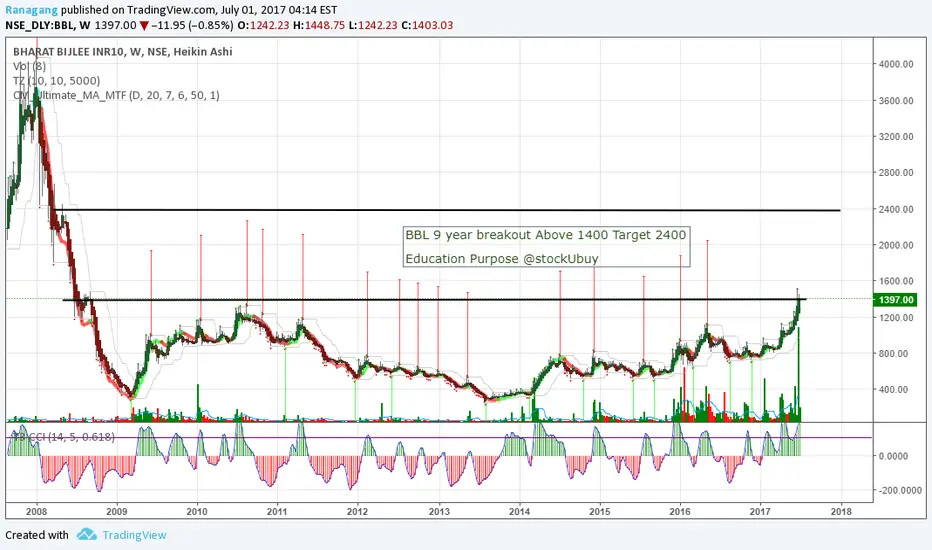
Does BBL move higher from here?NSE:BBL current market price(979.35) which acted as resistance (marked with RED arrows) during 2016 and early 2017 is currently acting as great support (marked with GREEN arrows) since then. Does it move higher from here? Based on the chart below, it seems highly likely. However, your guess is as good as mine.

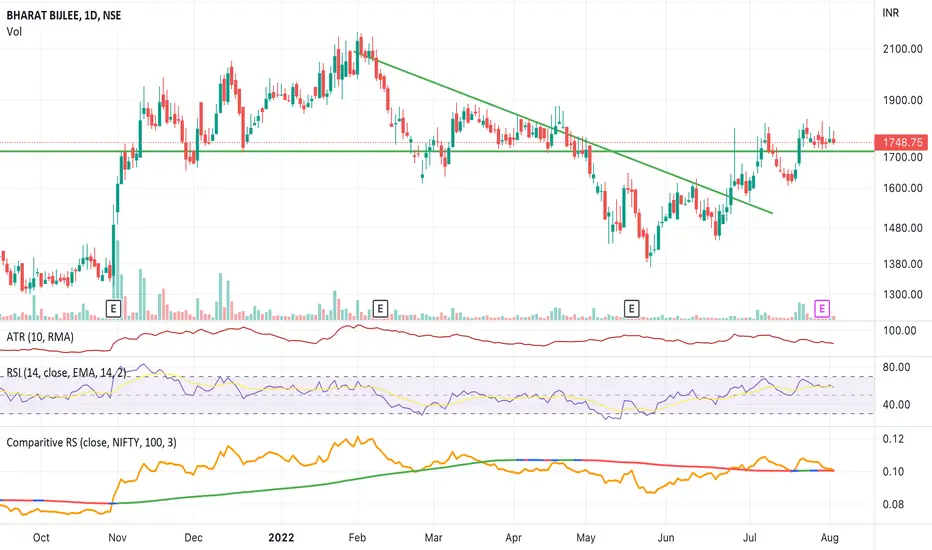
BHARAT BIJLEE - GOOD ONE TO GO LONGCMP - 1722.
Target - 2420 plus
Stop - 1400
1) Stock has cleared the long term upward sloping resistance line.
2) Stock has also cleared the multiperiod long term horizontal resistance line.
3) Huge volume based buying seen in the last weeks that has propelled the stock beyond resistance line.
4) Relative Strength upward sloping.
5) Stock has the potential to go past 2400 in coming weeks time.