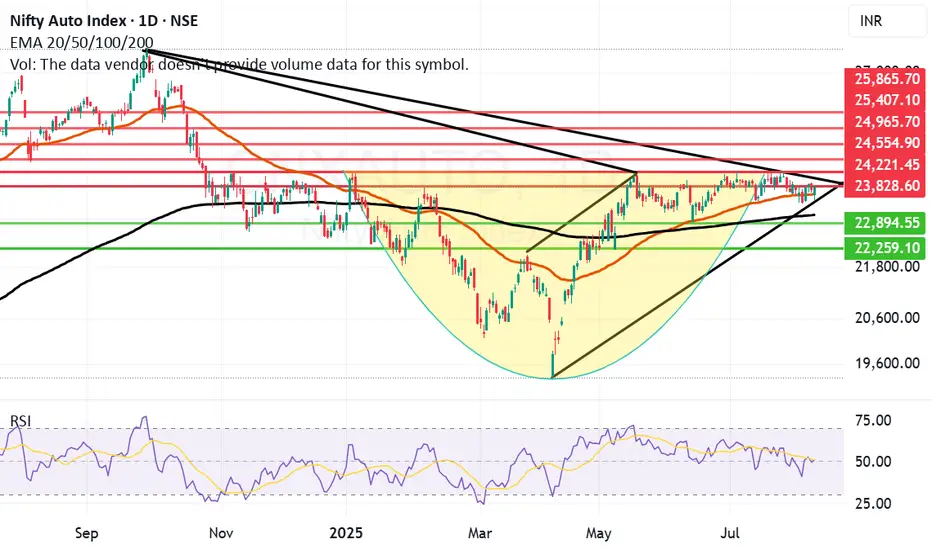
Auto Index has consolidated and might be in search of a BreakoutCNX Auto Index has consolidated for a long time in the range of 22800 and 24250 since May 25. If the index can cross the resistance zone between 23828 and 24221 and if we get a weekly closing above 24221 or 24250 then we might see a rally in this index towards 25K or even near 26K. Currently the ind
Related indices
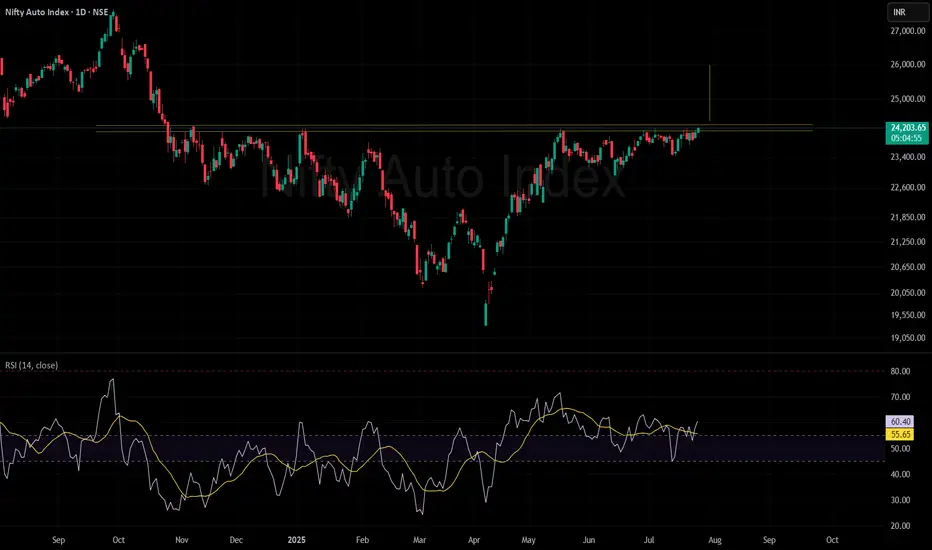
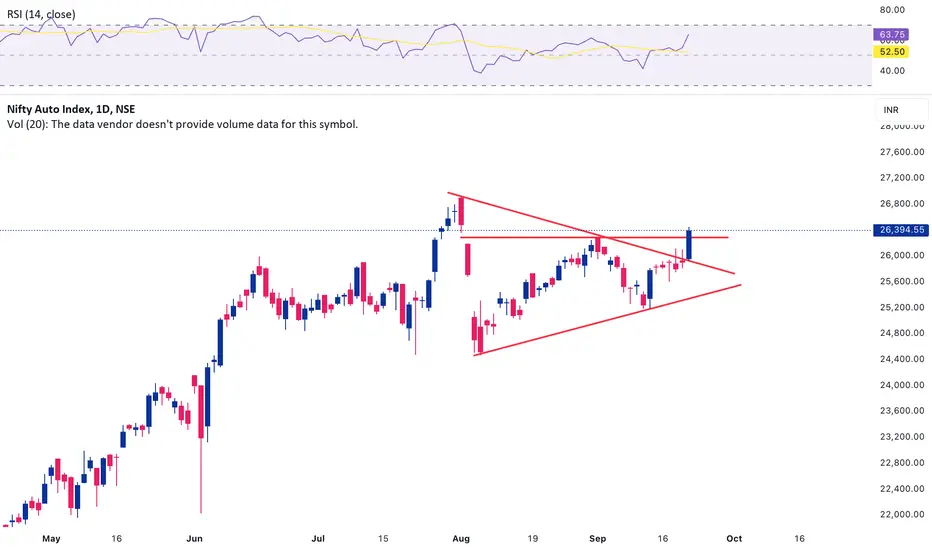
Auto Index looking good for a runThe Nifty Auto Index is breaking above major resistance near 24,200, signaling a strong bullish breakout. The RSI is at 60.39, indicating positive but not overbought momentum. This breakout suggests potential for further upside as long as the index holds above the new support level (24,200).
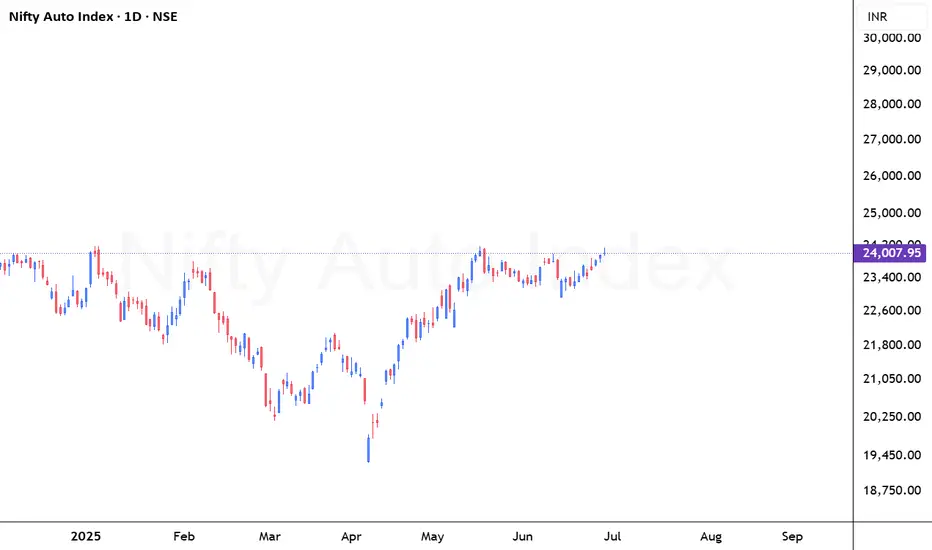
Nifty Auto Index – Breakout Watch with Bullish MomentumNifty Auto Index—Breakout Watch with Bullish Momentum
Timeframe: Daily
Current Price: ₹24,007.95
Trend: Consolidation Breakout / Bullish Setup
🔍 Technical Highlights:
Consolidation Zone: Price has remained in a tight sideways range for the past 5 weeks (~₹23,000–₹24,000), indicating accumulation.
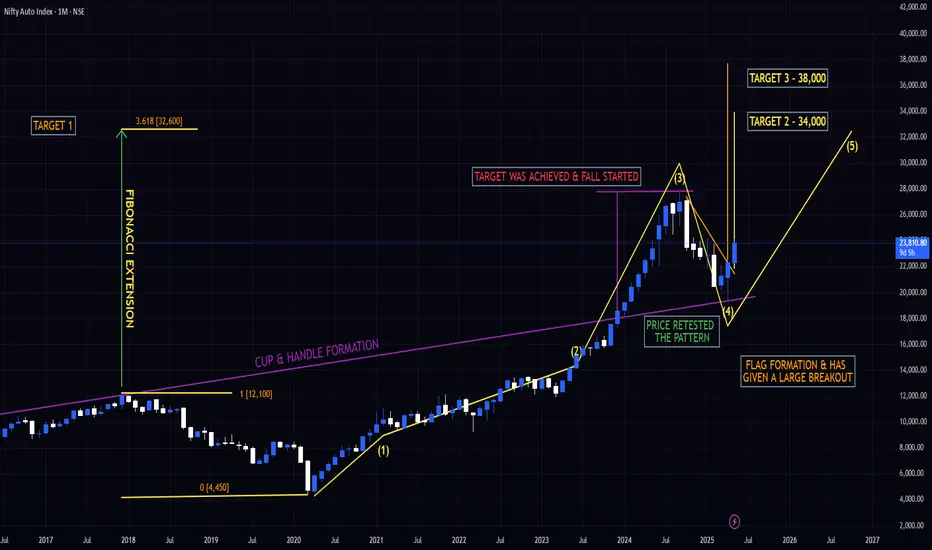
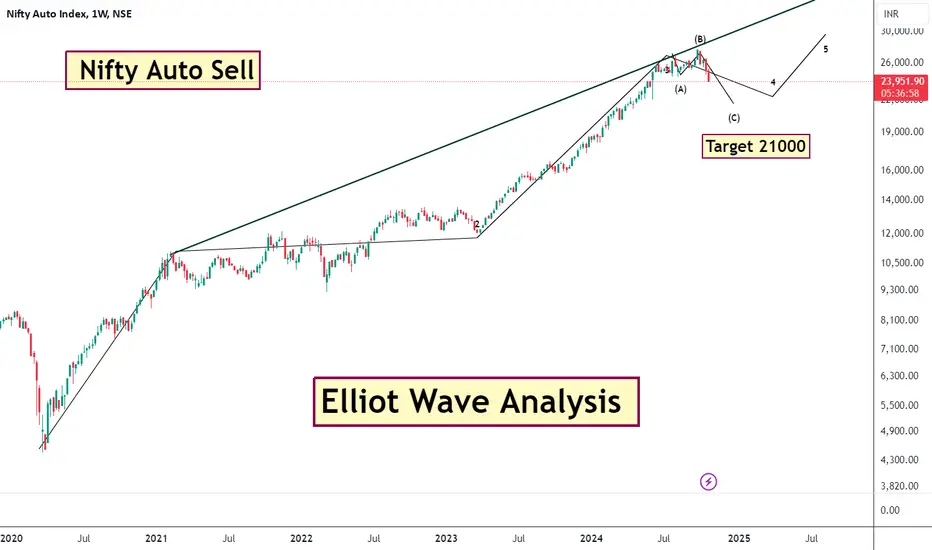
HUGE POTENTIAL IN THE NIFTY AUTO INDEX - STARTING OF THE 5 WAVEIndian Auto Index Technical Analysis
The Indian Auto Index made an all-time high (ATH) of approximately 27,700, completing Wave 3
From there, a Wave 4 corrective phase began, ending at 19,300 (a 30% decline).
A large Flag pattern has formed on the monthly charts and has been broken with a strong b
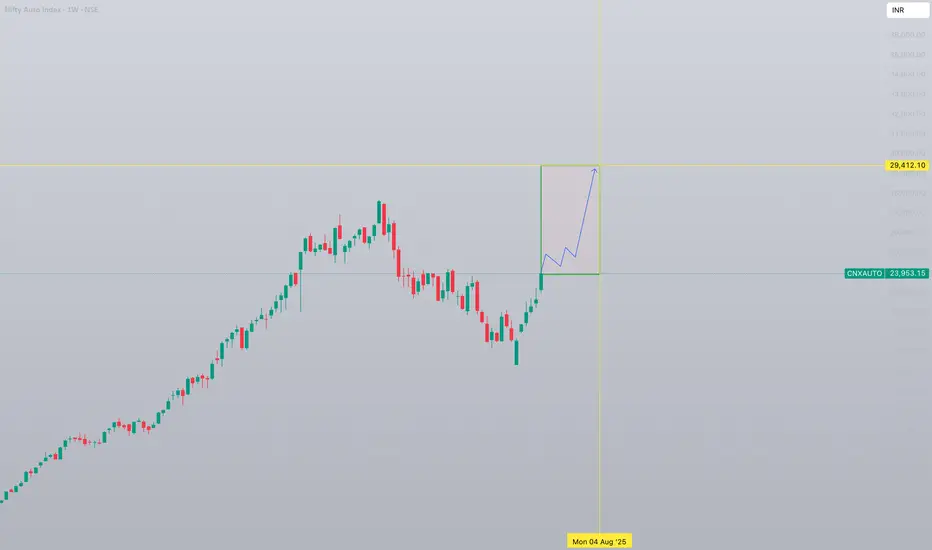
Nifty Auto Index 1W forecast until August 2025NSE Auto Index is in "discharge" mode. This will last until the level of 25000 followed by a sideways-cooldown movement.
Bullish structure will stay intact and the second bullrun will happen shortly.
Major correction/retest will happen after the breakout of previous all-time-high and setting a new A
nse auto movement on mondayThe NSE Auto Index (NIFTY Auto) is currently showing some interesting movements. As of the latest data, it appears that the index is in a slight downtrend1. The index is trading below an important level of 23,543.16, and if it remains below this level, it might continue to show a downward movement i

Nifty Auto SellNifty Auto elliot wave analysis count 2020 . Current time elliot wave 4 downside correction .
Finally - Nifty Auto chartThis is why I am bullish on nifty, keep in radar auto stocks for swing.
#Maruti
#M&M
#Escorts
#Tatamotors
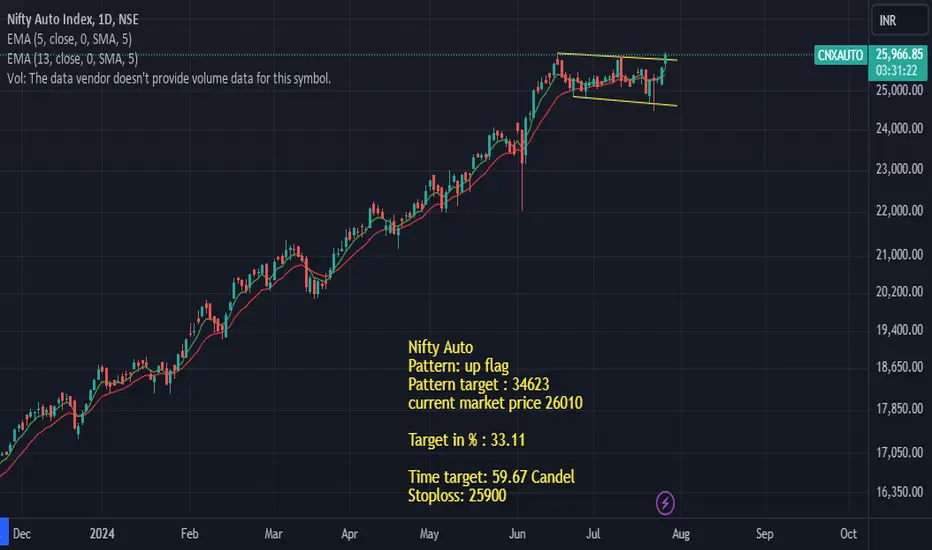
Nifty Auto might gain more than 30 % in 3 to 4 monthsNifty Auto might gain more than 30 % , Please find my technical analysis in the chart
Auto move to South?can see a RSI divergence in the chart, we may witness some downfall in coming days before it can go forward.

See all ideas
Displays a symbol's price movements over previous years to identify recurring trends.