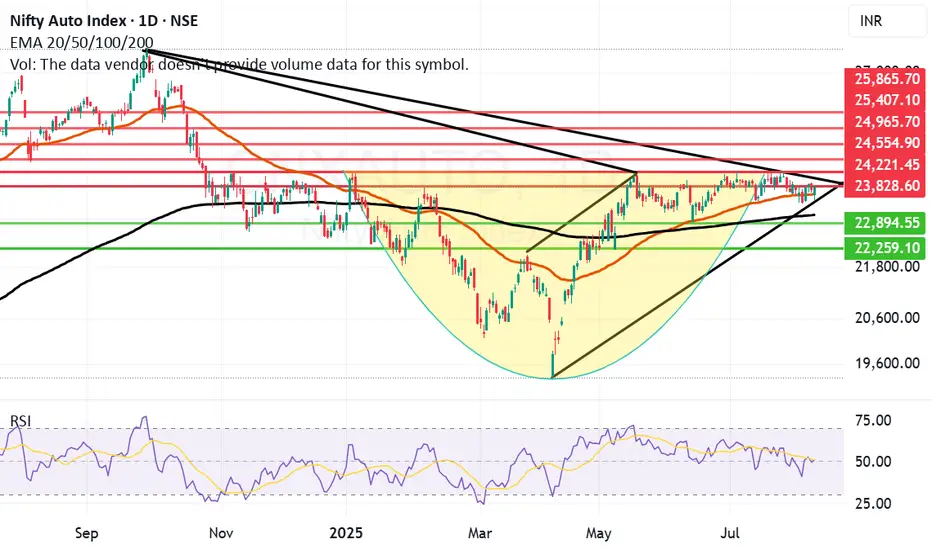
Auto Index has consolidated and might be in search of a BreakoutCNX Auto Index has consolidated for a long time in the range of 22800 and 24250 since May 25. If the index can cross the resistance zone between 23828 and 24221 and if we get a weekly closing above 24221 or 24250 then we might see a rally in this index towards 25K or even near 26K. Currently the index closed on Thursday at 23808. Lot of Auto and Auto component companies gave good results during the last quarter.
When the index is strong and gives a breakout it means that the undercurrent in majority of the companies which constitute the index is strong. There will be some companies which will obviously drag the index down as there can not be one way traffic. To know amongst these which companies to invest in an investor should look at fundamentals of the company, recent and past results, cash flows, Sales and order books, EPS and many other factors. While a Technical investor should look at charts of the companies before investing.
A smart investor would be a person who looks at both fundamentals and technicals of the company and invests in a fundamentally strong company which is giving a technical breakout. For this one has to learn Techno-Funda analysis. I have written a book on the subject called The Happy Candles Way To Wealth Creation. In this book you will learn the basics of Techno-Funda investing. The book is available on Amazon and is one of the highest rated books in its category. With an approval rating of 4.8/5 as on date. Lot of investors call it as a Hand book for Techno Funda investing. Most of the chapters are standalone and can be read at your own accord. It will be really helpful to you.
The companies that constitute this index are Maruti Suzuki, Tata Motors, M&M, MRF, TI India, Exide, Samvardhana Motherson, Ashok Leyland, Hero Moto, TVS Motors, Bharat Forge, Bosch, Balkrishna, Bajaj Auto and Eicher Motors. Amongst these companies due to Tariff uncertainties one should focus on companies which will be least dependent on export and have major market which caters to local consumption or exports not related to US. Two-Wheeler manufacturers and Two Wheeler component manufacturers are looking particularly strong in the index as most of them are consumed and sold locally. The rains so far this monsoon have been good so the Farm equipment and Tractor manufacturers also can try to push the index upwards if the monsoon remains strong in India.
If we get a closing above 24250 we can easily see index moving 1000 to 1500 points northwards if positivity in the index sustains. The resistances currently for the Auto index are at 23828, 24221, 24554, 24965, 25407 and 25865. The supports for Auto index remain at 23620 (Mother line support), 23087 (Father line support), 22894 (Below this level index becomes very weak) and 22259. To know more about Mother line, Father line and my Mother, Father and Small child theory you should once again I recommend, read my book the Happy Candles Way to Wealth Creation.
Disclaimer: The above information is provided for educational purpose, analysis and paper trading only. Please don't treat this as a buy or sell recommendation for the stock or index. The Techno-Funda analysis is based on data that is more than 3 months old. Supports and Resistances are determined by historic past peaks and Valley in the chart. Many other indicators and patterns like EMA, RSI, MACD, Volumes, Fibonacci, parallel channel etc. use historic data which is 3 months or older cyclical points. There is no guarantee they will work in future as markets are highly volatile and swings in prices are also due to macro and micro factors based on actions taken by the company as well as region and global events. Equity investment is subject to risks. I or my clients or family members might have positions in the stocks that we mention in our educational posts. We will not be responsible for any Profit or loss that may occur due to any financial decision taken based on any data provided in this message. Do consult your investment advisor before taking any financial decisions. Stop losses should be an important part of any investment in equity.
CNXAUTO trade ideas
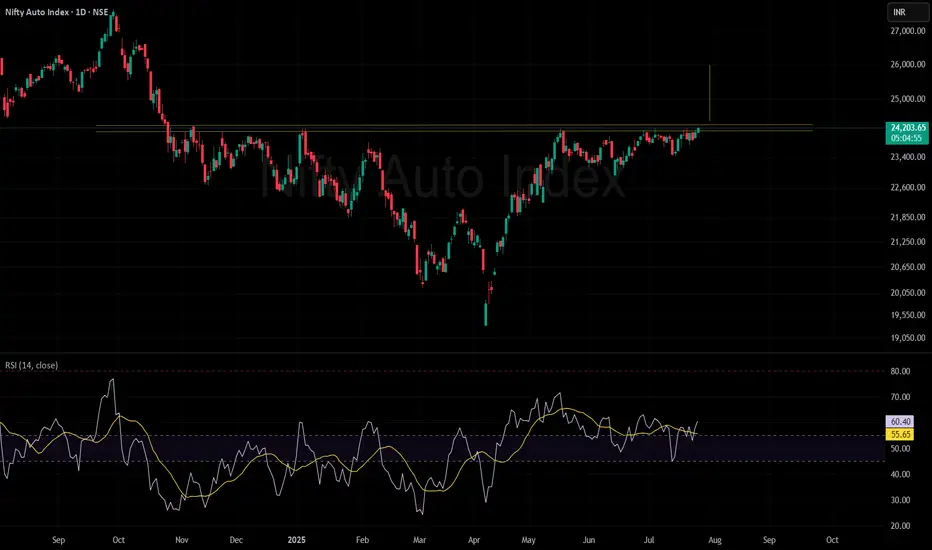
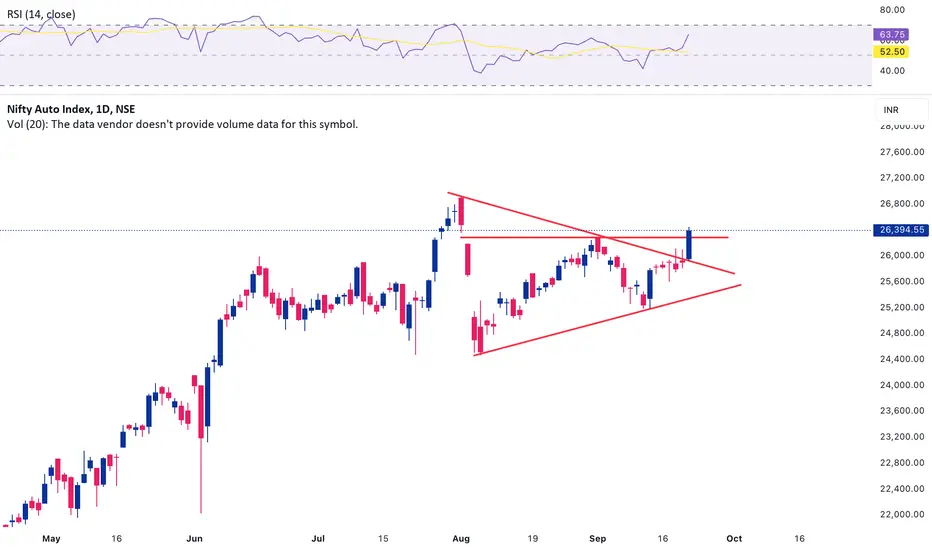
Auto Index looking good for a runThe Nifty Auto Index is breaking above major resistance near 24,200, signaling a strong bullish breakout. The RSI is at 60.39, indicating positive but not overbought momentum. This breakout suggests potential for further upside as long as the index holds above the new support level (24,200).
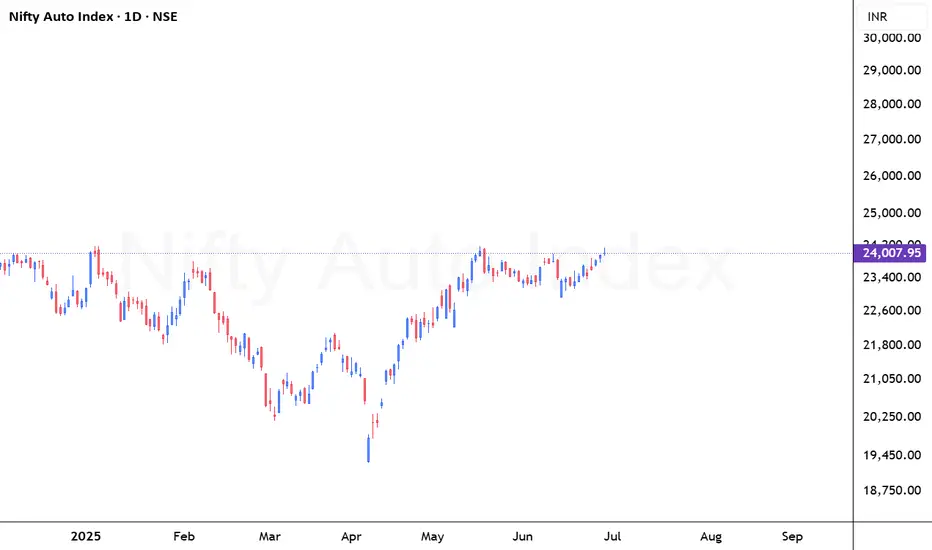
Nifty Auto Index – Breakout Watch with Bullish MomentumNifty Auto Index—Breakout Watch with Bullish Momentum
Timeframe: Daily
Current Price: ₹24,007.95
Trend: Consolidation Breakout / Bullish Setup
🔍 Technical Highlights:
Consolidation Zone: Price has remained in a tight sideways range for the past 5 weeks (~₹23,000–₹24,000), indicating accumulation.
Breakout Attempt: Price is currently testing the upper band of this consolidation box (as seen in the green highlighted zone).
Support Zone: Strong support from both PEMA Bands and Developing Weekly/Monthly CPR (₹23,670–₹23,837).
📌 Trade Idea:
Trade Type: Positional Swing Long
Entry: On daily close above ₹24,050 with volume confirmation
Targets:
T1: ₹24,345
T2: ₹25,343
Stop Loss: ₹23,670 (below Monthly CPR and PEMA support)
⚠️ Risk Management Notes:
Risk-to-reward is favorable if entered near breakout with SL below the CPR zone.
Monitor for any rejection at weekly/monthly H3 zones for partial booking.
Avoid fresh longs if the index fails to hold above ₹24,000 by the end of the week.
The Nifty Auto Index shows strong signs of bullish momentum as it attempts to break out of a 5-week range, supported by PEMA and Camarilla levels. A close above ₹24,050 may initiate a new swing leg toward ₹25,000+.
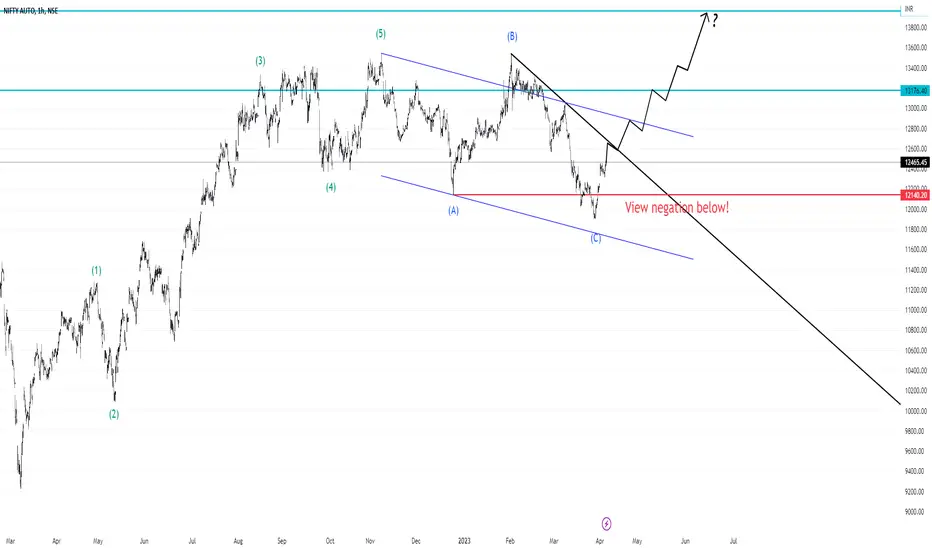
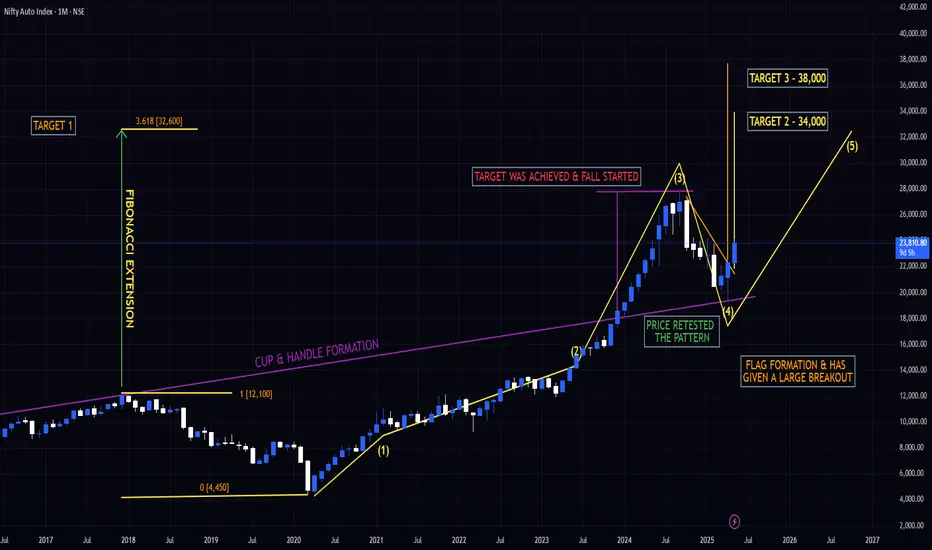
HUGE POTENTIAL IN THE NIFTY AUTO INDEX - STARTING OF THE 5 WAVEIndian Auto Index Technical Analysis
The Indian Auto Index made an all-time high (ATH) of approximately 27,700, completing Wave 3
From there, a Wave 4 corrective phase began, ending at 19,300 (a 30% decline).
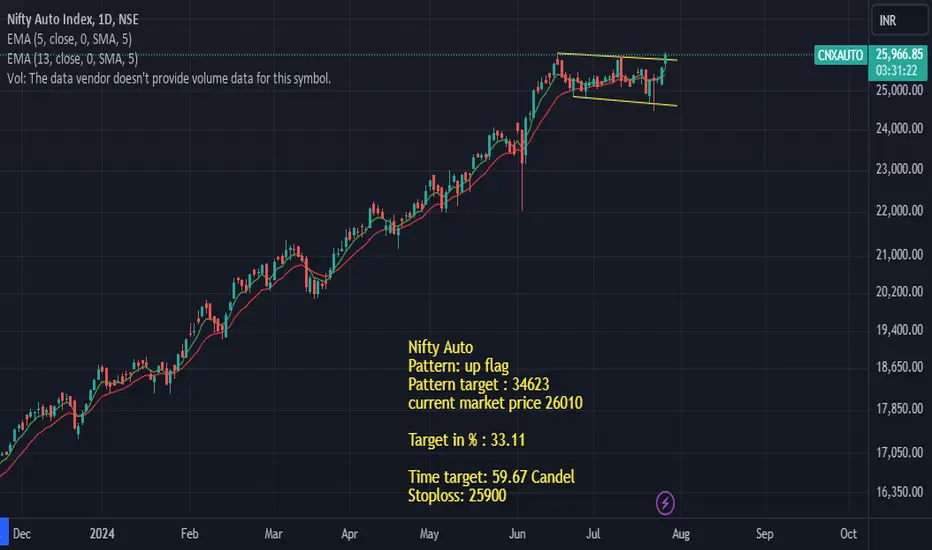
A large Flag pattern has formed on the monthly charts and has been broken with a strong bullish candle, projecting a full target of 38,000 (an upside of 63%).
Using the Fibonacci extension from the COVID fall, the 3.618 level comes to approximately 32,600.
Taking the extension of Waves 3 and 4, the 1.618 level also points to 32,600, reinforcing this level as a major target.
List of Technical Targets
Target 1 – 23,960
Target 2 – 25,500
Target 3 – 27,700 (previous ATH)
Target 4 – 32,600 (Fibonacci confluence)
Target 5 – 34,000
Target 6 – 38,000 (flag pattern breakout target)
Important Dates Based on Time Cycle Analysis
17 November 2025
30 March 2026
4 January 2027
29 April 2029
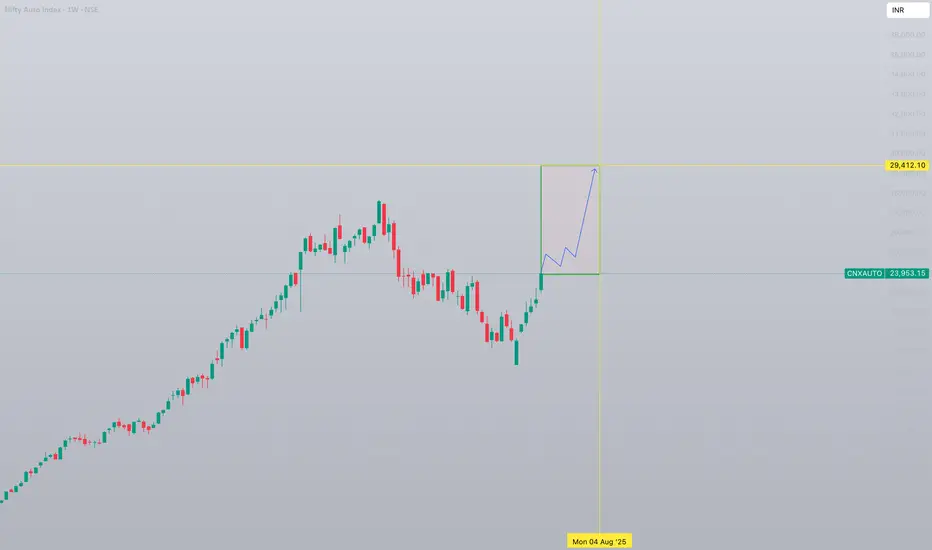
Nifty Auto Index 1W forecast until August 2025NSE Auto Index is in "discharge" mode. This will last until the level of 25000 followed by a sideways-cooldown movement.
Bullish structure will stay intact and the second bullrun will happen shortly.
Major correction/retest will happen after the breakout of previous all-time-high and setting a new ATH with a top at 29,500 in the beginning of August 2025.
nse auto movement on mondayThe NSE Auto Index (NIFTY Auto) is currently showing some interesting movements. As of the latest data, it appears that the index is in a slight downtrend1. The index is trading below an important level of 23,543.16, and if it remains below this level, it might continue to show a downward movement in the short term.
However, predicting exact movements can be tricky as they depend on various factors including market sentiment, economic indicators, and company-specific news. It's always good to keep an eye on the latest developments and perhaps consult with a financial advisor before making any decisions.
Would you like to know more about how to analyze such trends or any other specific information?

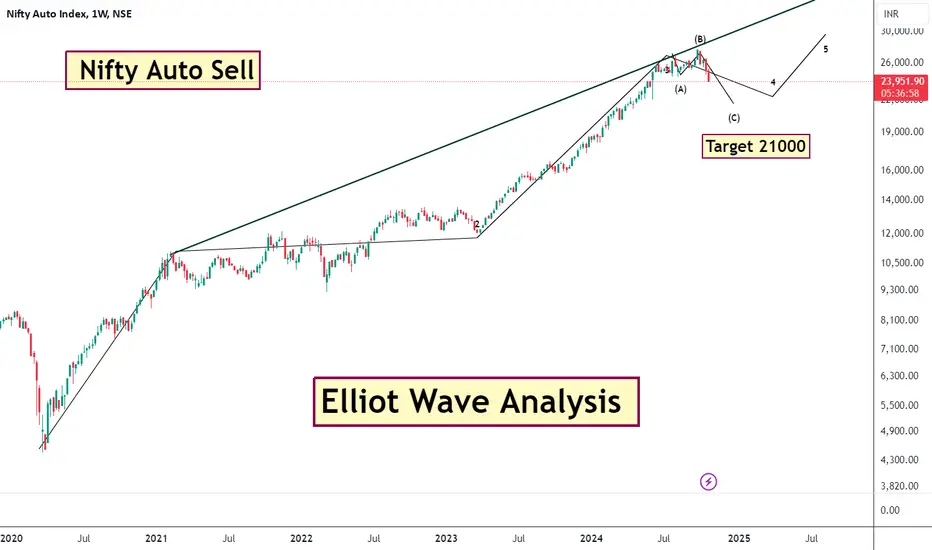
Nifty Auto SellNifty Auto elliot wave analysis count 2020 . Current time elliot wave 4 downside correction .
Finally - Nifty Auto chartThis is why I am bullish on nifty, keep in radar auto stocks for swing.
#Maruti
#M&M
#Escorts
#Tatamotors
Nifty Auto might gain more than 30 % in 3 to 4 monthsNifty Auto might gain more than 30 % , Please find my technical analysis in the chart
Auto move to South?can see a RSI divergence in the chart, we may witness some downfall in coming days before it can go forward.

Nifty Auto !!! Almost der for sellingHello All,
The recommendations are purely for educational purpose only, consult you financial advisor before trading.
Targets are mentioned in charts (either red lines or balck lines), keep Stop Loss as per your risk..
If you like my Idea, Don't forget to Boost and comment on my Analysis..
Have a profitable year ahead
Gautam Khanna
Technical Analyst by Passion :-)
Nifty Auto index cautiousmoving averges
below 20 EMA
Daily RSI below 60
support 17023 as 50 EMA
major support 16652
Decoding the Mystery Behind Dec 20 Fall - Part 77. Nifty Auto -2.28%
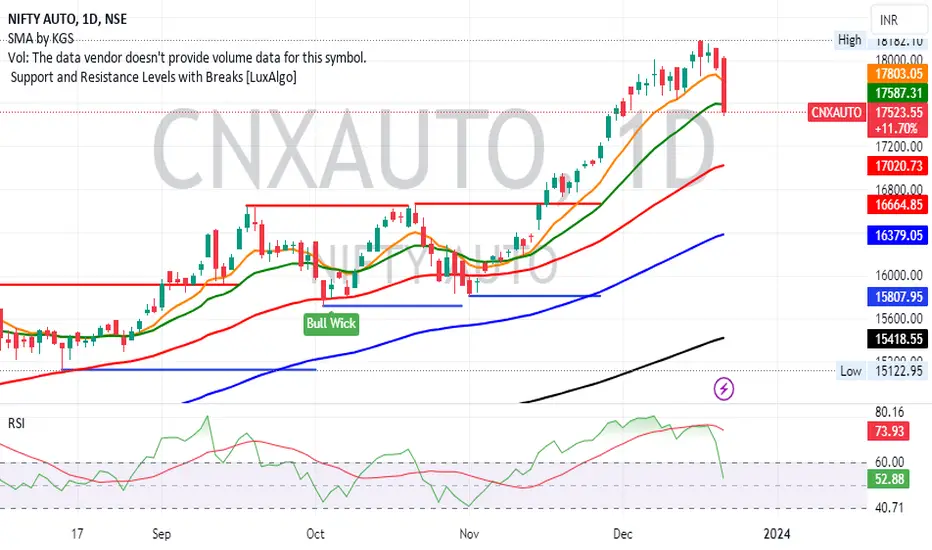
3 Months - Rounding Bottom BO done. Target 19752 - nothing wrong in 3 Months / Monthly scale - its going up and wick is getting formed once in a while
Weekly - as you can see at every step - there is a Horizontal Consolidation (BOX Pattern) for some weeks then BO, again BOX BO and repeat.....
When the stock / sector has a crossed ATH and goes up - there is no more resistance it push it down. But it writes its own fate by creating new Support & Resistances once again because of People's Greed & Fear. When majority thinks it has grown too much - they sell off causing a temp dip.
As you can see - there are bigger Red candles in Weekly history. Absolutely nothing wrong - and Still in the Bullish pattern - no negation of pattern anywhere. Trendline Support is also an additional support

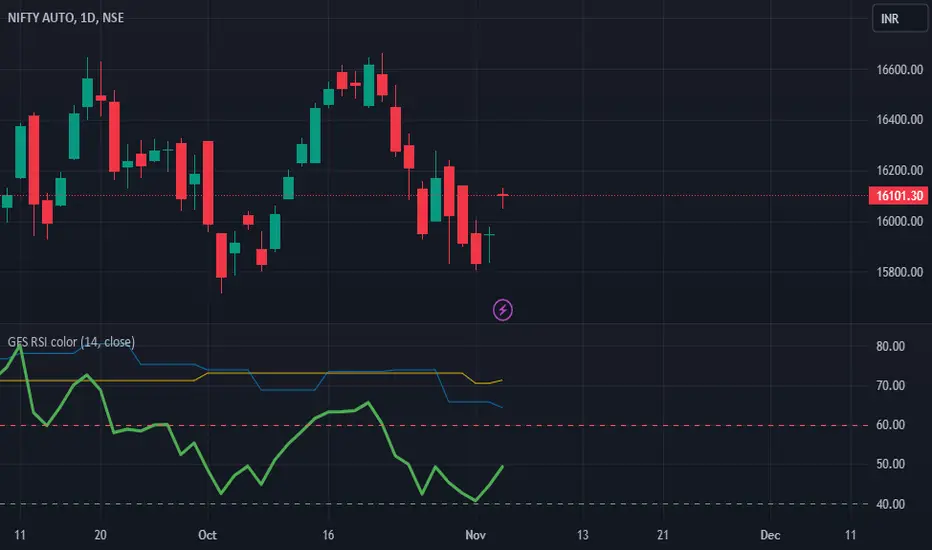
RSI Multi-time frame Green Color if M & W Abv 60 and D Abv 40This indicator displays RSI in Day, Weekly and Month
Multi time frame momentums in one display..
In addition set to display RSI in color if Monthly & Weekly above 60 and Daily above 40.
Best used with Volume Indicator for detecting reversal at 40 RSI
AUTOAuto index need to hold the support level, we will have to see how the market reacts to the all the auto earnings numbers over the weekend. Coming festive season is a exciting sign for auto index. we shall see if it holds up or breaks below.
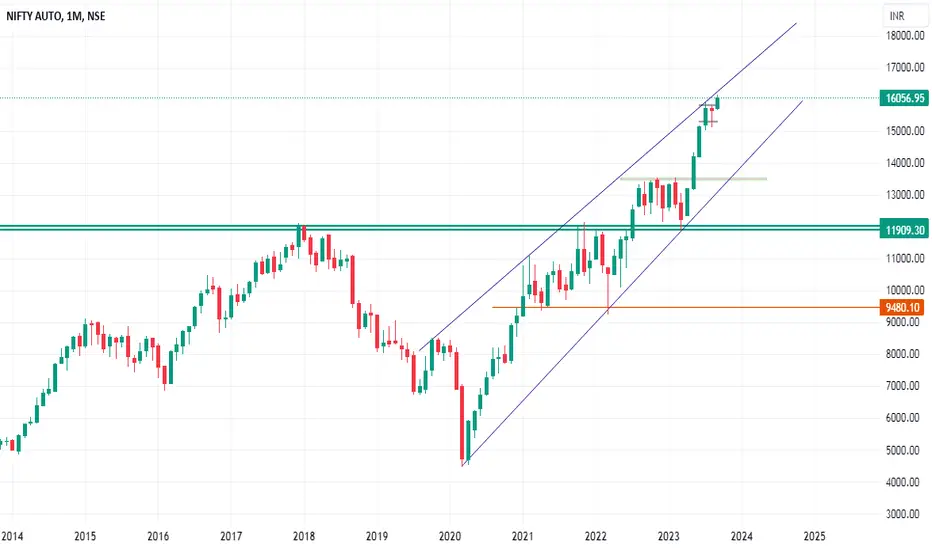
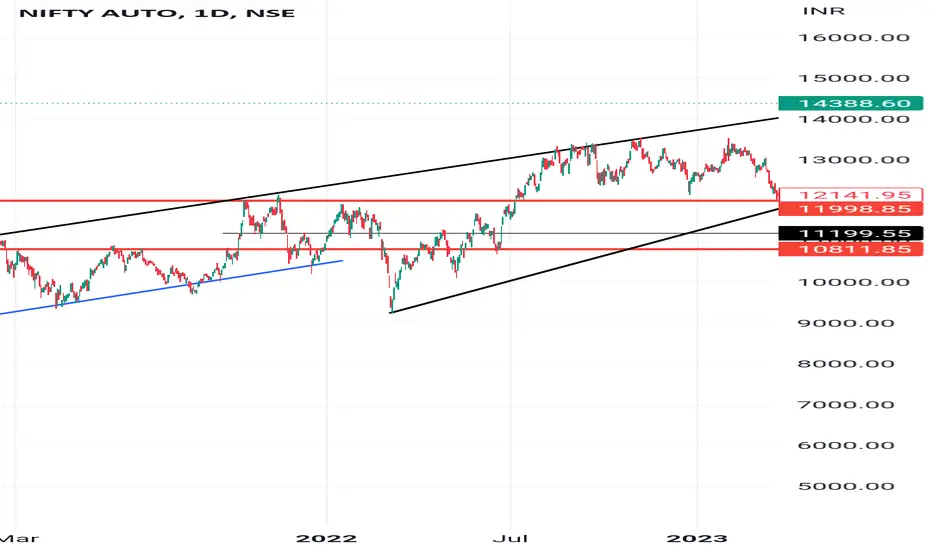
NIFTY AUTONifty auto trading in a channel and reached the upper end of the channel in monthly timeframe. EXPECTING A BO in the structure bt beware of trapping if happens onn upper levels. Bais is CAUTIOUSLY BULLISH at current levels.
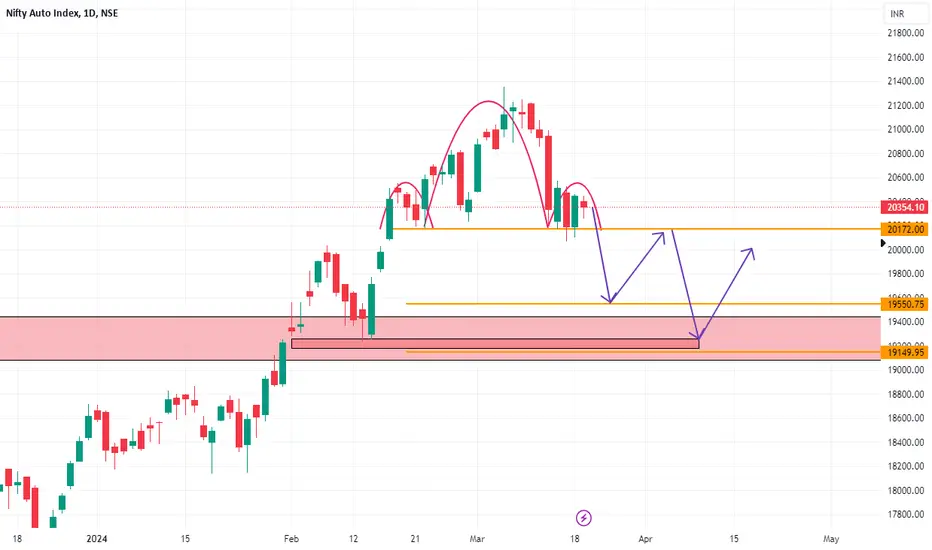
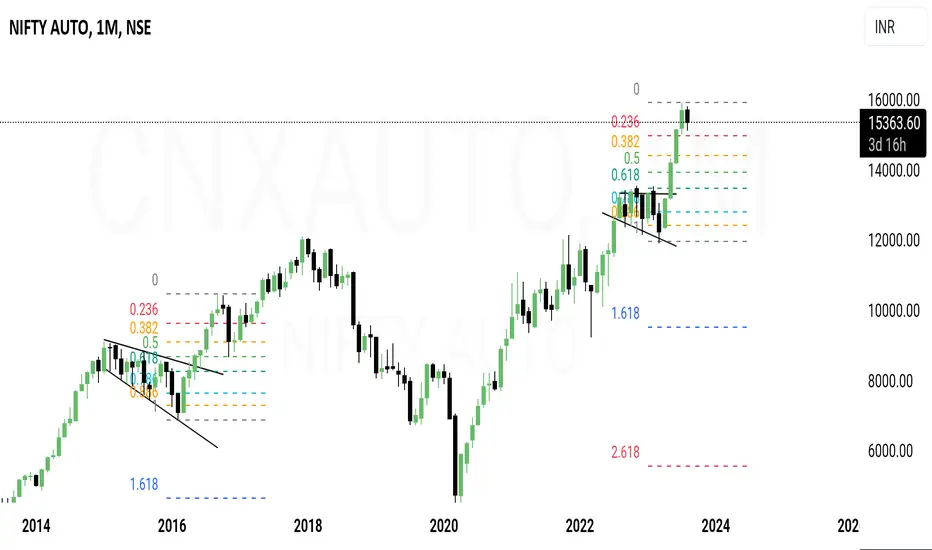
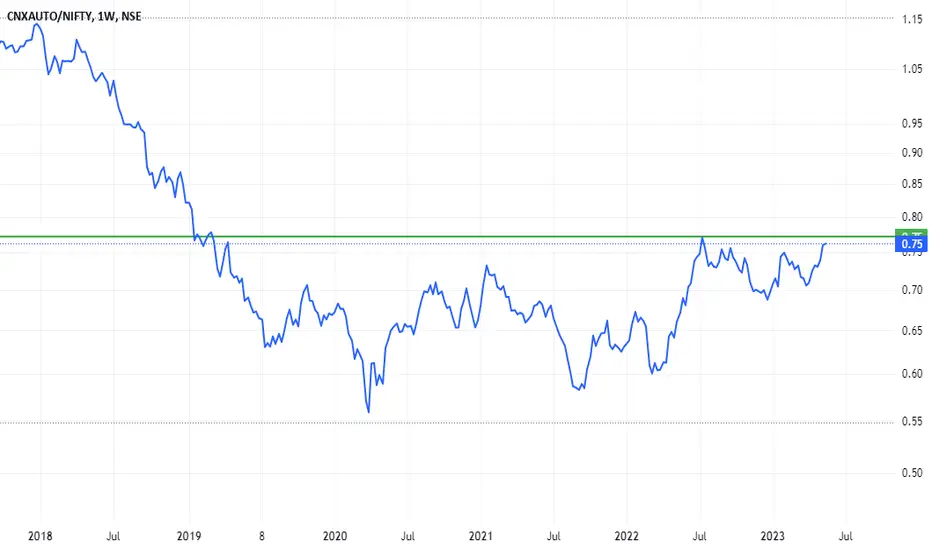
History repeats itselfCNXAUTO having similar chart structure, it may correct upto 50%, from the recent swing low, so please avoid long and if any opportunity in smaller time frame, we can have short in auto stocks
During this fall, it will take a pull back, time your entry and make 💰💰
NIFTY AUTOAfter consolidation, it is on way to break upper end of the channel line. Stocks from this sector may be kept in radar for coming week.
NIFTY AUTOJust tighten you SL if your are having positions in Auto stocks. It seems that there may be some underperformance in coming days from this sector.
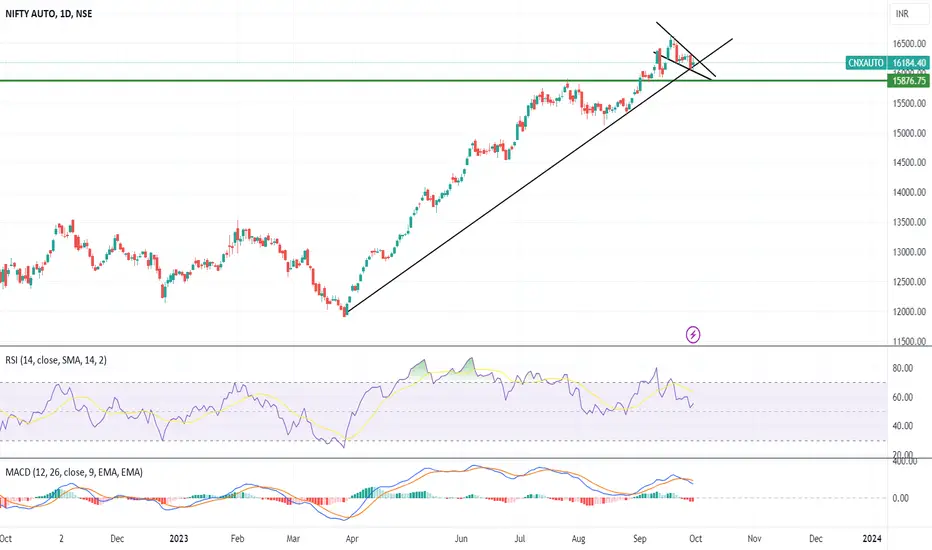
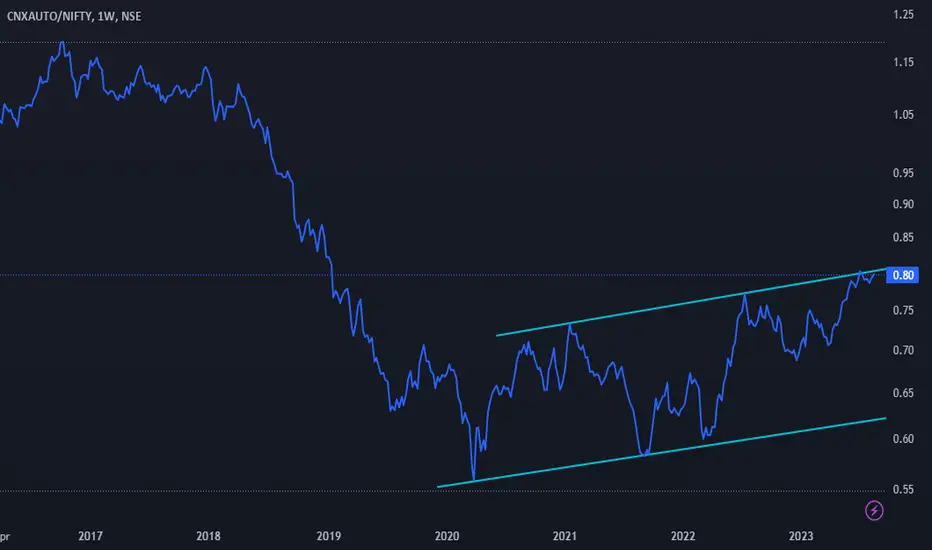
Nifty auto cnxauto aka nifty auto given an all time breakout of a long term upper trendline sector and all the components of the mentioned stocks is also following the same trend of the index one can add auto stocks on dips this sector can be leading sector soon
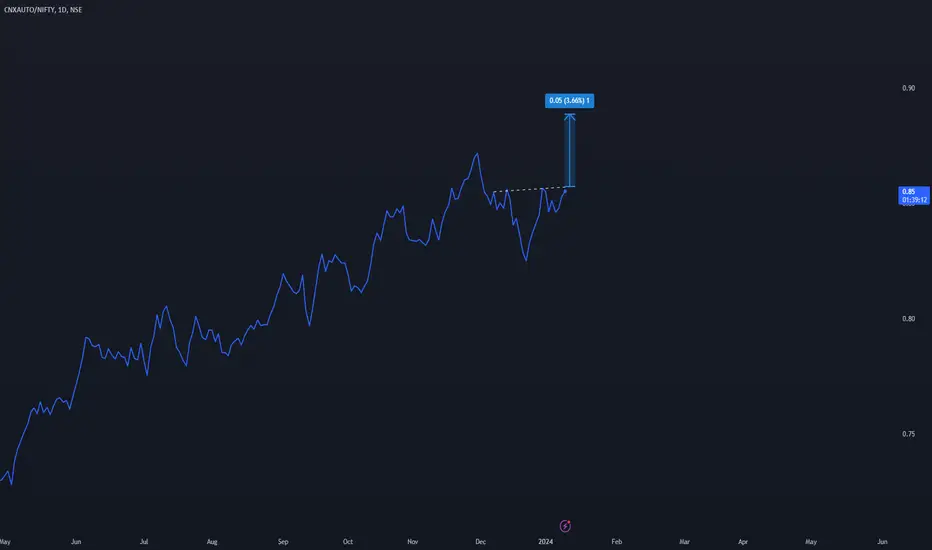
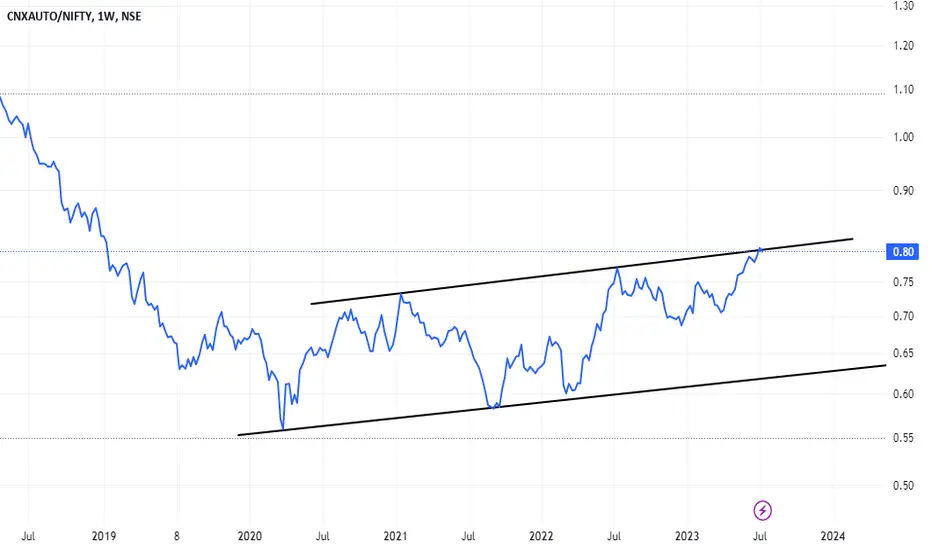
NIFTYAUTOLong base has been formed in ratio chart any breakout this base will give good upside in auto stocks. Hence, keep auto stocks in radar and also this chart. If breakout is not happening then don't go long there
are we looking for a 5th wave impulse!NSE:CNXAUTO
are we unfolding an impulse on upside!
time to prove the wave structure!
NSE:NIFTY