Nifty Smallcap 100 Index Trading plan 📈 Current Market Context
1H Chart:
The index is in a short-term downtrend after a strong rally.
Price is nearing a potential demand zone (previous bullish order block) from late June around 18,500–18,600, a likely mitigation point for re-accumulation.
5M Chart:
There’s a liquidity sweep and pote
Related indices

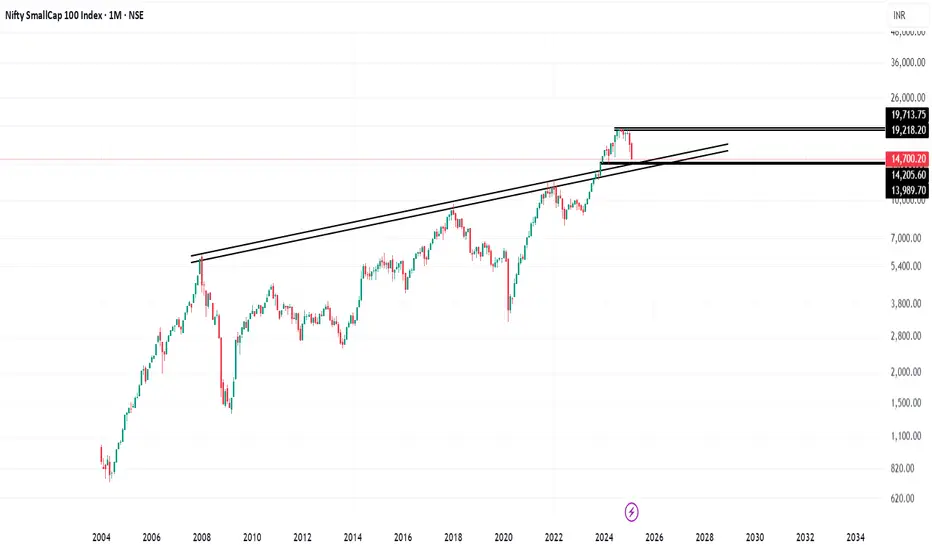
Nifty Smallcap Index can go upto 12,450With Fib retracement Nifty small cap index has potential to reach 12,450
It will have following targets.
14800 / 14100 / 13850 / 13100 / 12450

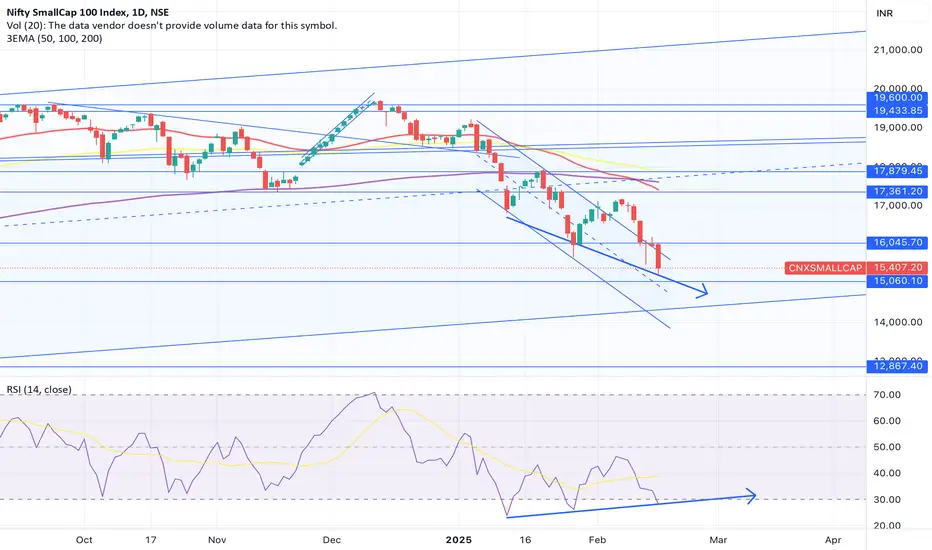
CNX SMALL CAP INDEX Small cap index moving in raising channel and it's now in top of the channel, if break we'll see good upmove .

14900 SL WCB for 16520-800-17200 ready to ROAR CNXSMALL CAPView invalid WCB 14900 can keep eye on for the target 16520-16800-17050-200 after closing above 17200 Weekly close reiview more till that buy on dip ... Market is volatile so small crunching is better than nothing....

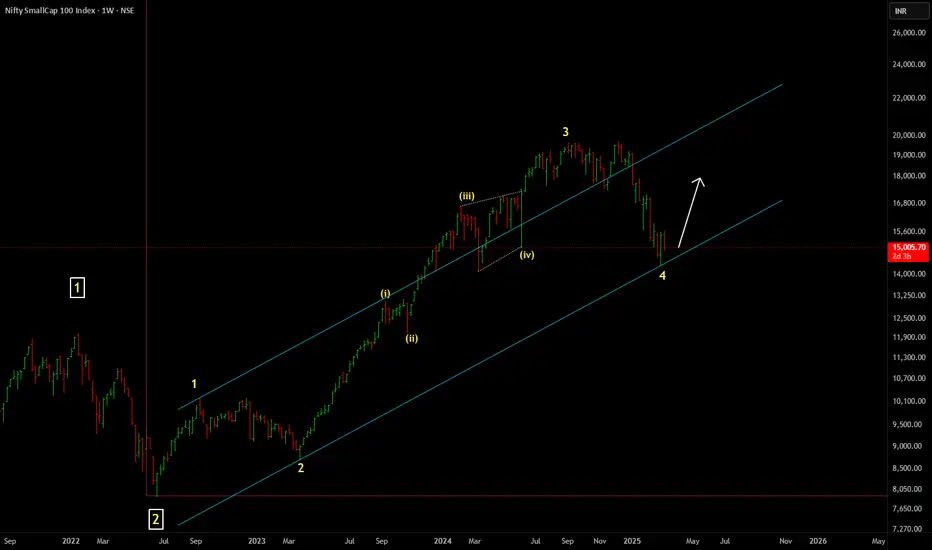
NIFTY SMALLCAP 100Wave 4 retraced almost 50% of the Wave 3. Wave 5 to new highs is possibly starting now.
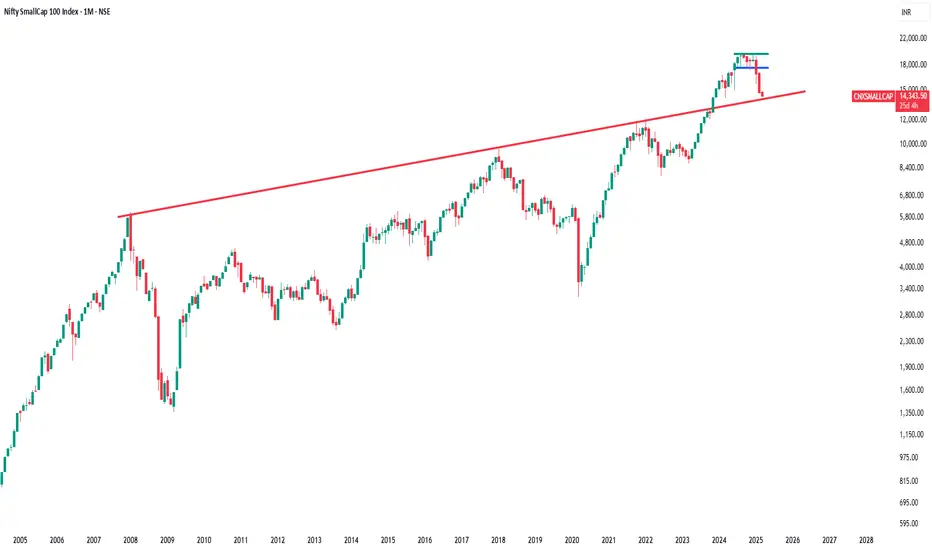
SMALLCAP INDEX TRADING NEAR MULTIYEAR SUPPORTPrevious Multiyear Resistance now act as a Multiyear Support .
Nifty smallcap sectorNifty smallcap sectoral chart is saying the stroy has just begun and not ended. looking for very bright years going forward for investors with PATIENCE.
Small cap: Big relief?The index is showing bullish RSI divergence, the silver lining on charts. The index is also have neared to the support of 15K, so we may see a medium term bottom maybe, lets wait and watch!
Nifty SmallCap 100 Elliot Wave ViewWave 2 of 3: This corrective wave occurred between September 2022 and March 2023, lasting approximately 28 weeks, as highlighted in the chart.
Wave 4's Progression: The recent peak in September suggests symmetry in the cycle, mirroring Wave 2's timeline. If Wave 4 matches Wave 2 in duration (aroun

Mid/Smallcap || Recovery As Expected, What now? The Midcap and Small Cap Index have shown signs of recovery as anticipated in my previous analysis. The index is now trading above the 20 EMA Band in the 2-hour timeframe (TF). However, several key conditions must still be met before we can confirm a sustained bull run:
1. 2-hour RSI should cross a

See all ideas
Summarizing what the indicators are suggesting.
Oscillators
Neutral
SellBuy
Strong sellStrong buy
Strong sellSellNeutralBuyStrong buy
Oscillators
Neutral
SellBuy
Strong sellStrong buy
Strong sellSellNeutralBuyStrong buy
Summary
Neutral
SellBuy
Strong sellStrong buy
Strong sellSellNeutralBuyStrong buy
Summary
Neutral
SellBuy
Strong sellStrong buy
Strong sellSellNeutralBuyStrong buy
Summary
Neutral
SellBuy
Strong sellStrong buy
Strong sellSellNeutralBuyStrong buy
Moving Averages
Neutral
SellBuy
Strong sellStrong buy
Strong sellSellNeutralBuyStrong buy
Moving Averages
Neutral
SellBuy
Strong sellStrong buy
Strong sellSellNeutralBuyStrong buy
Displays a symbol's price movements over previous years to identify recurring trends.