DEEPAKFERT LONG INTRADAY 15 MAR,2021Dear trader,
If u look at the chart of DEEPAKFERT (analysis based intraday only) the DEEPAKFERT support at 219 and Target at 228 and stop loss at 210.
The chart clearly indicates Bullish Trend you can also see the candle stick patters for more indepth analysis.
In Intraday most important thing is to enter and exit points.
Our signals are based on analytics, algorithms, mathematical derivatives.
Always be a responsible trader, kindly trade only when you have maximum opportunity in the market with minimum risk and with keynotes like data, analysis and proper strategies.
Kindly message us for strategies and analysis.
DEEPAKFERT trade ideas

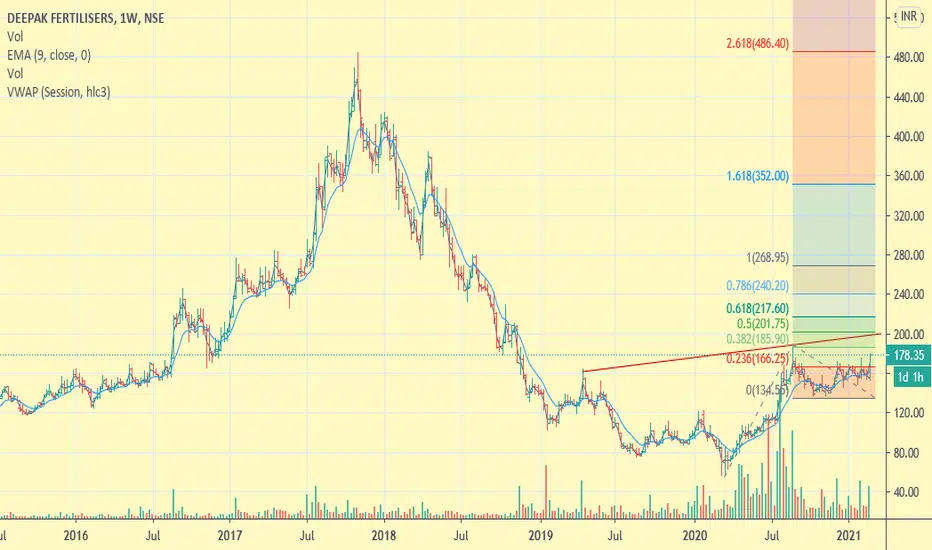
Deepak FertiliserCup and Handle formation on weekly charts. Watch out for breakout.
Disclaimer: Iam not a registered or authorized analyst by SEBI or any institution.
The chart details are for education and study purposes only.
The chart is not a signal to trade or suggest buy/sell/hold/transact in any way.


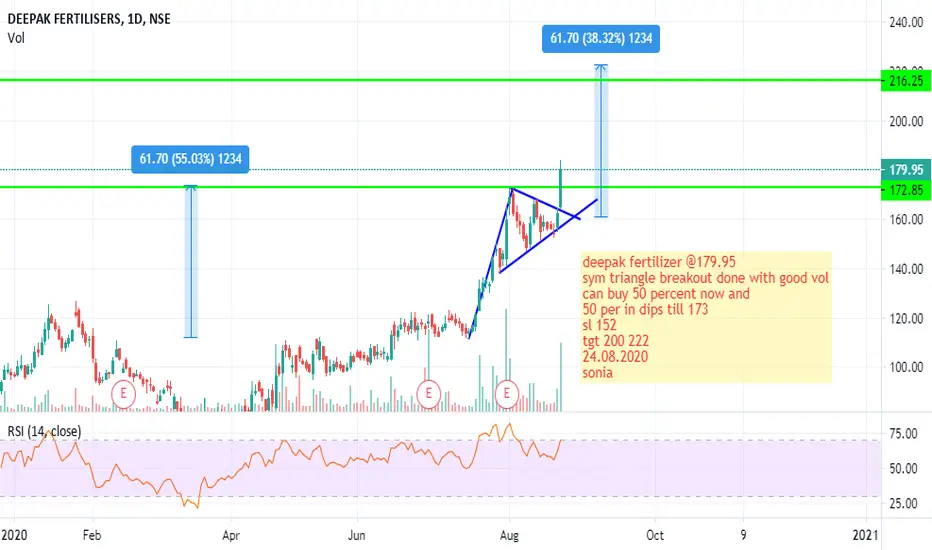
deepak fertiliser--buy long termdeepak which has a long first wave and second wave is small as per fibo extension trg longs comes to 352 . after crossing 179-80 range stock will show real power and wll target 197 minimum
deepak fertiliser--buy long trg markedbuy for a 3rd wave target of 260 and if crosses 265 trg of 340 as marked in chart.

DEEPAKFERT - NSE (Weekend Update)NSE:DEEPAKFERT
DEEPAKFERT - NSE
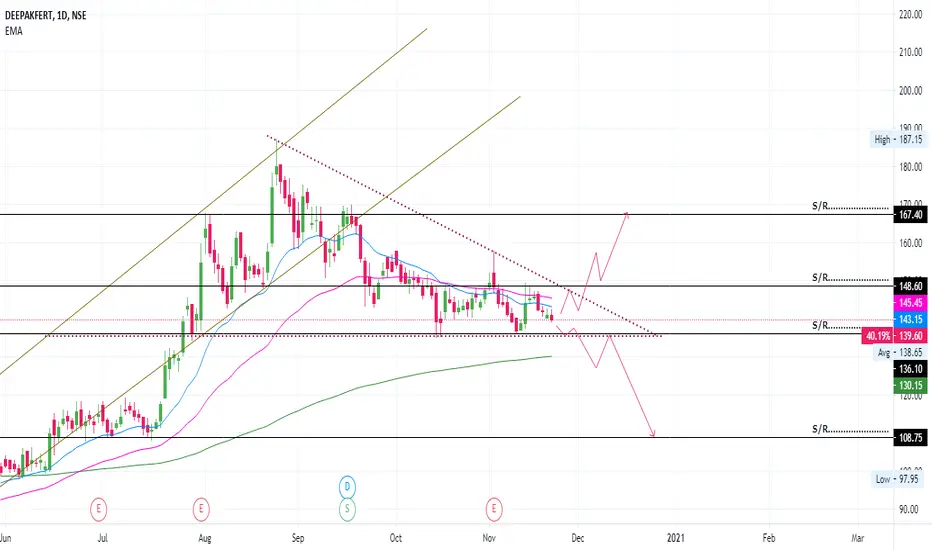
Technical analysis: Deepak Fertilizers and Petrochemicals
.The price is below 20/50 Days EMA and above 200 Days EMA.
I have also provided some support and resistance area in above chart.
Please follow the proper risk management before take any trade make your proper analye
If you like my Ideas please hit the 👍 LIKE button and share some of your ideas in comment section.
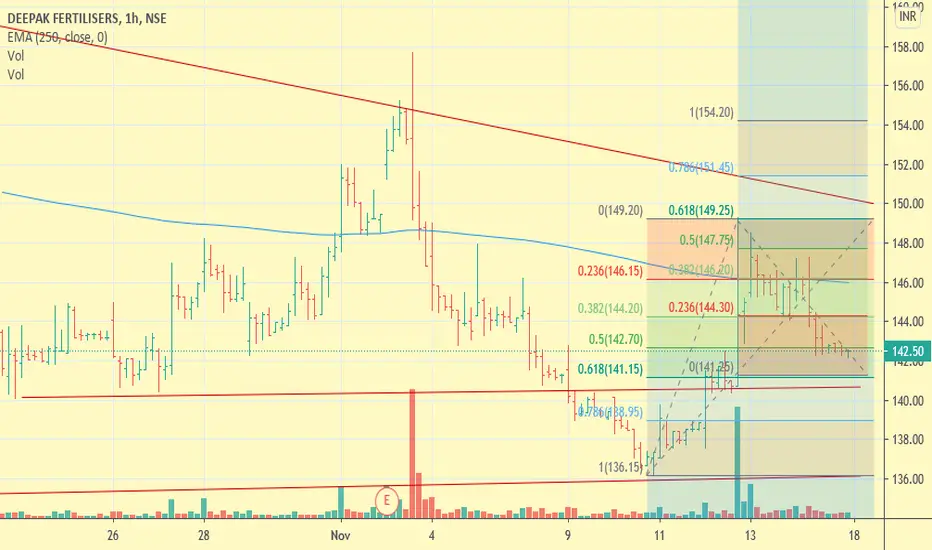
deepak fertiliser-buylikely to take support at 141.15 @ 61.50 retracement And will mark end of wave 2 .if takes support at 141.15 and crosses 145 then 3rd wave trg of 175.
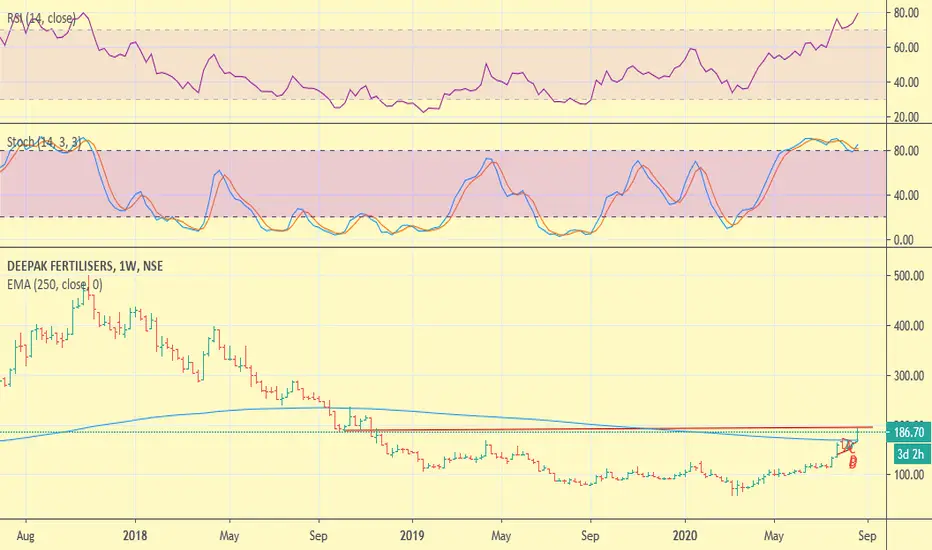
deepak overboughtsell on rally near to 194 resistance zone as per rsi , macd and stochastic some resistance expected here.

DEEPAK FERTILISERrsi stochastic and triangle breakout expected above 106 .All suggesting buy witha target of min 120 to 132


Buy DEEPAK FERTILIZERThis stock is showing positive signs and maybe ripe for trend reversal. It is currently sitting at it's major breakout level and may bounce to at least 271. If 275 is crossed we might have a big break for higher targets.

