DRREDDY trade ideas


DR REDDYNSE:DRREDDY
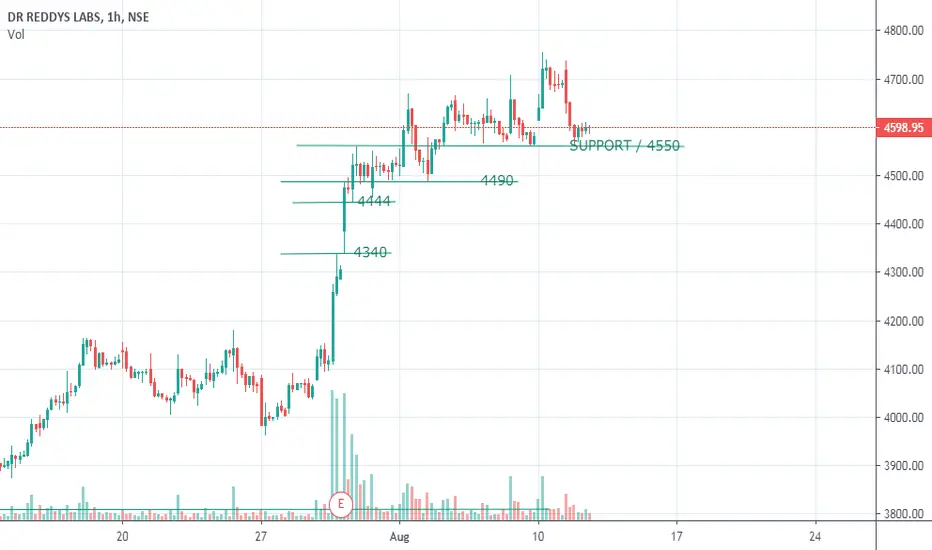
THE TIMEFRAME USED IS QUITE SMALL, CAREFUL BEFORE TRADING
4550 SEEMS TO BE A SUPPORT
IF BROKEN, DOWNSIDE LEVELS WILL 4490, 4444 AND BELOW THAT MAYHEM TILL 4340
TRAIL YOUR STOPS AND TRADE CAUTIOUS, ILLIQUID SCRIPT
******************************************************************************************************************************************************************
Hi all,
Its pleasure to have you all here.
I have started putting these charts as a contribution from my side to all people who are new to business, as I had to struggle a lot without any sources at disposal. So please consider this a just small contribution from my side.
Few Honest Disclosures:
1. Any idea shared is my personal view, its not a recommendation, neither any kind of paid propaganda, so please
do your bit of research.
2. Ideas shared does not mean that I trade all or have position in them, this is just a helping hand to all.
3. I expect no comments or like nor any negativity, as I said its just a small helping hand from my side, please plan your risk and trade as per your capacity.
4. To trade in Cash, options or futures is your sole choice and your own risk
5. I am no expert in Tech Indicators, I believe in support resistance and trendline theory, you may use this as a supplement theory for better results.
6. I work for my own living, this is a hobby which I do sincerely to help anyone who might come across my charts.
***********************************************************************************************************************************************


SPOT: Dr.Reddys Good above 4070, SL 4025 Tgt 4120, 4160SPOT: Dr.Reddys Good above 4070, SL 4025 Tgt 4120, 4160

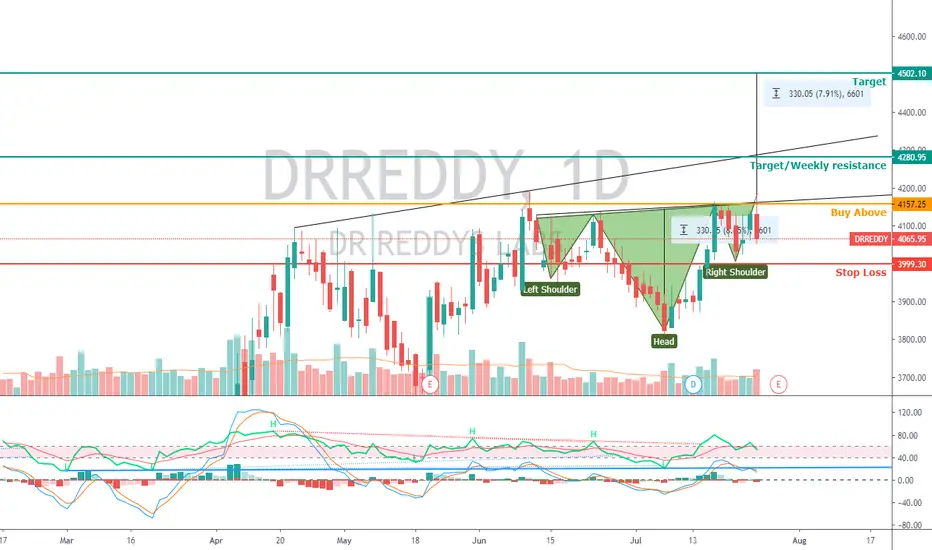
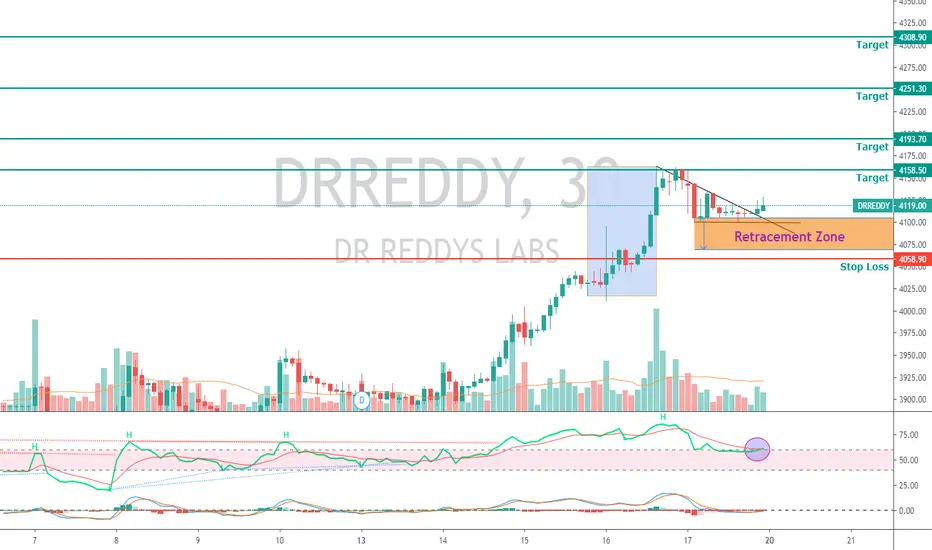
Drreddy - HnSDrreddy formed Head and Shoulders in daily chart and previosly had pennant and flag on small time frame... Three bullish pattern on one chart with retracement of 50%... Wow...Must be a jackpot trade. 4280-4300 zone has weekly resistance so it may take time to breach.... Targets on chart.
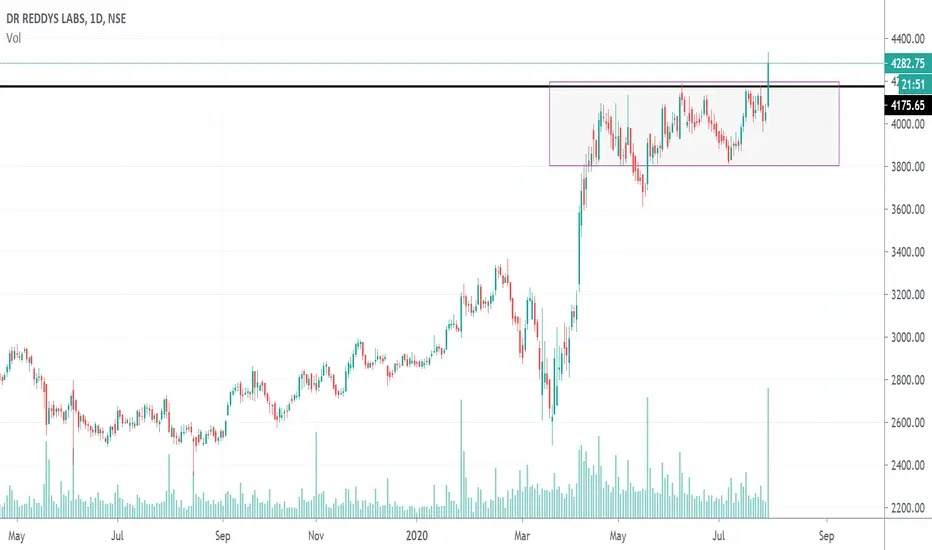
DRREDDY breakoutwith huge volumes after consolidationDRREDDY breakoutwith huge volumes after consolidation for almost 2-3 months
DRREDY Tomorrow On earnings day (29th Jul 2020) Will go 3-6% UpBUY drredy fOR TARGET OF 4200 FROM HERE.
SL 3190
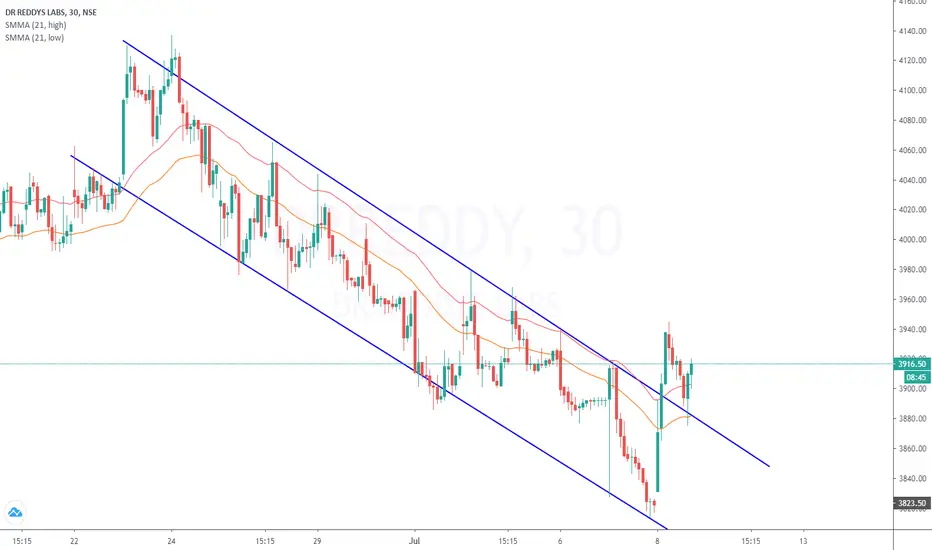
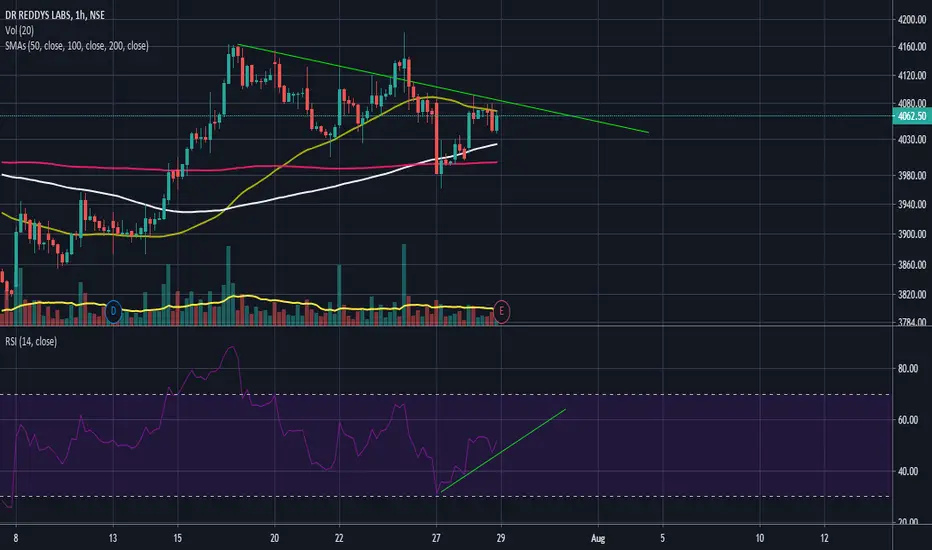
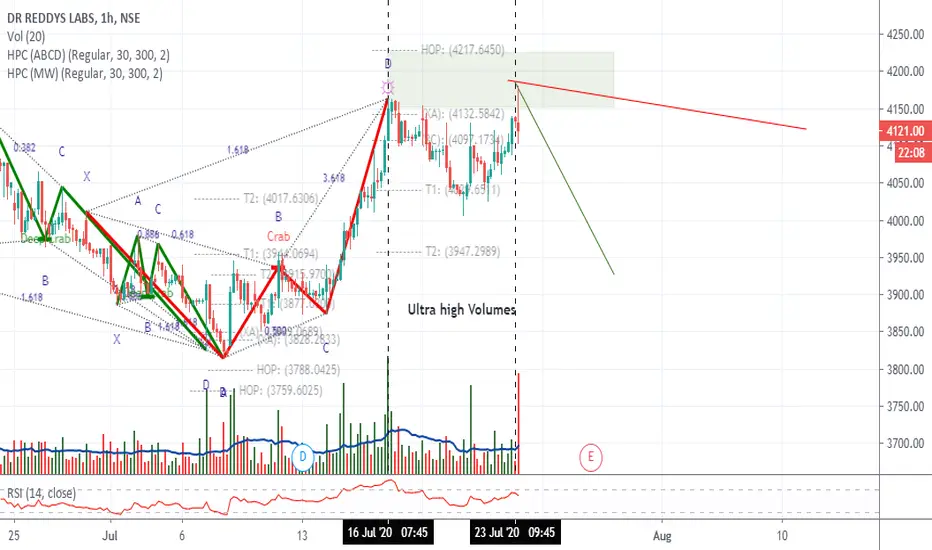
DRREDDY 1HRBearish DEEP CRAB
price need to follow Green Trend line & hit target
If price Breaks Red Trend line is where EXIT before SL hits
POTENTIAL SELL


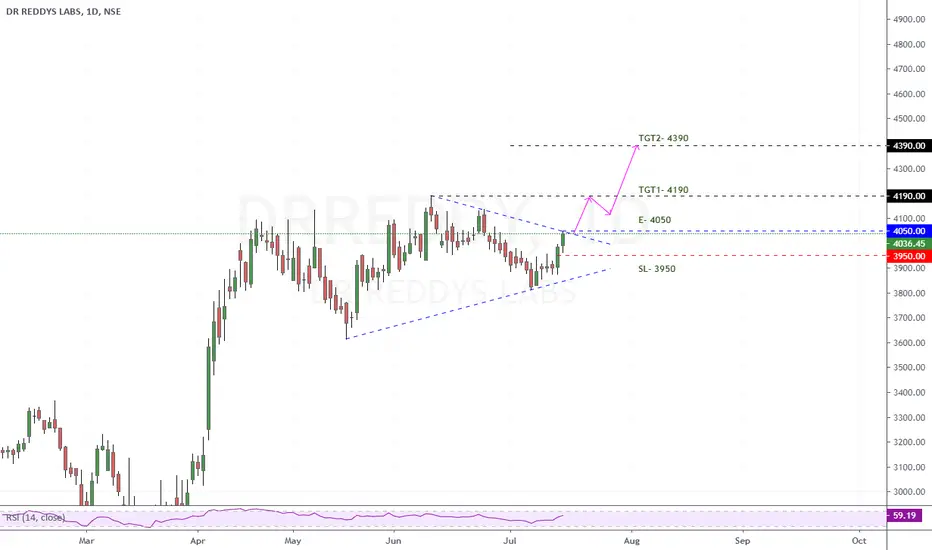
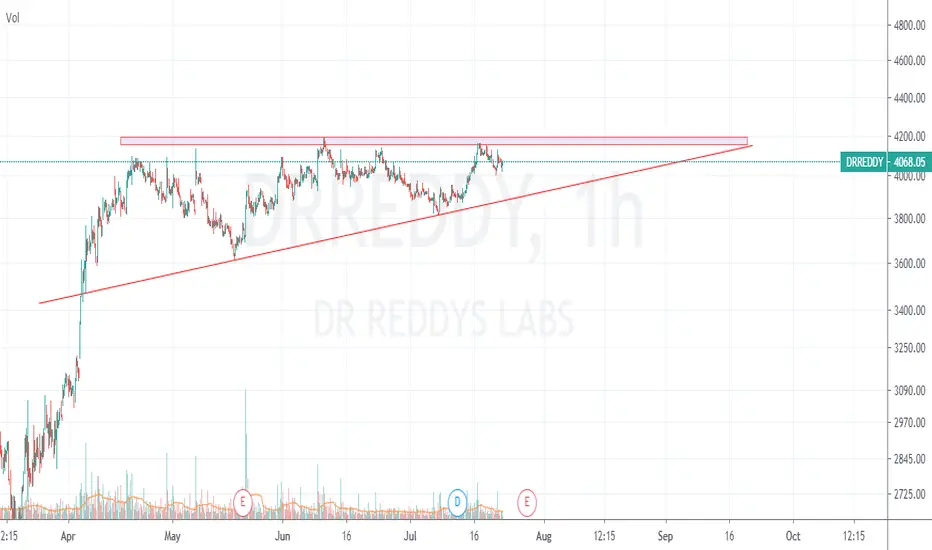
DRREDDYDRREDDY Ascending trigangle; a breakout from this with good volume will trigger good up movement.
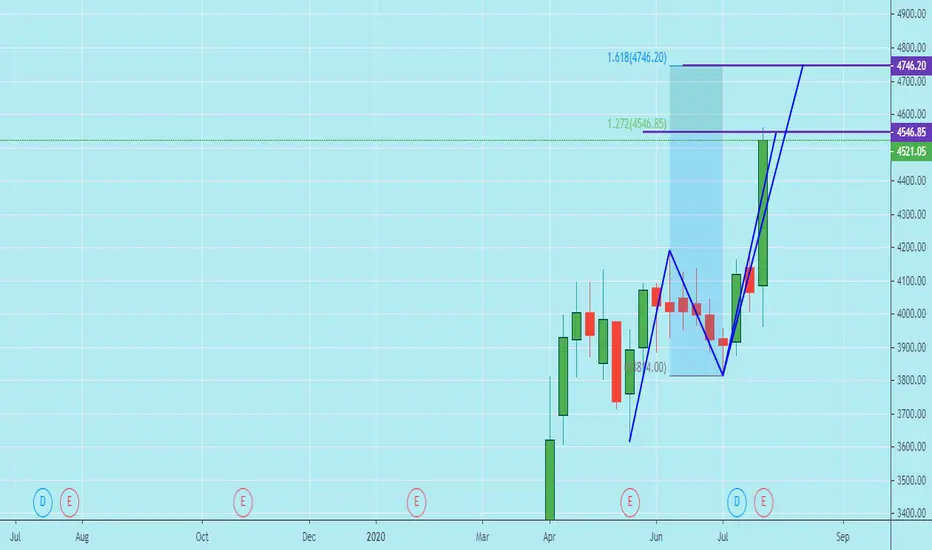
DRREDDY - PennantOn 30 mins Chart clear breakout of pennant on DR Reddy... Go long till Targets on chart.
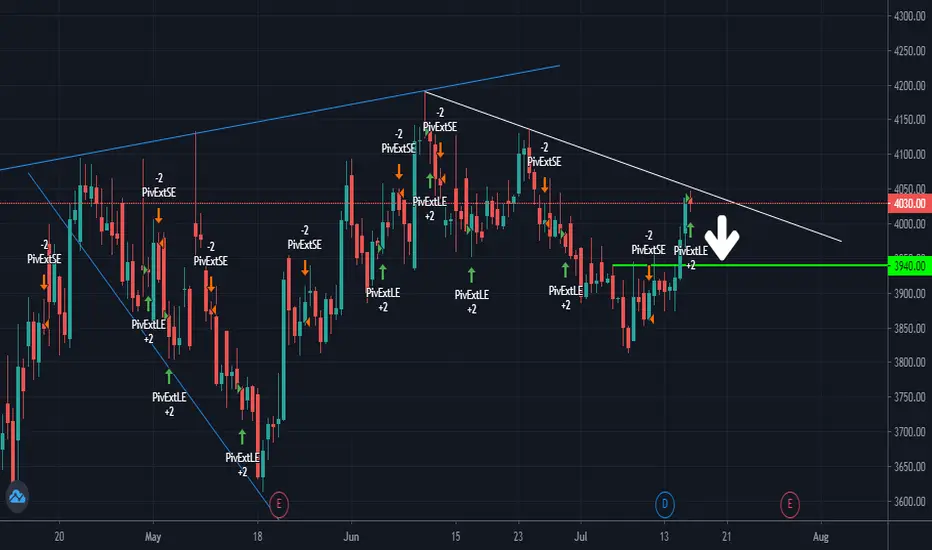
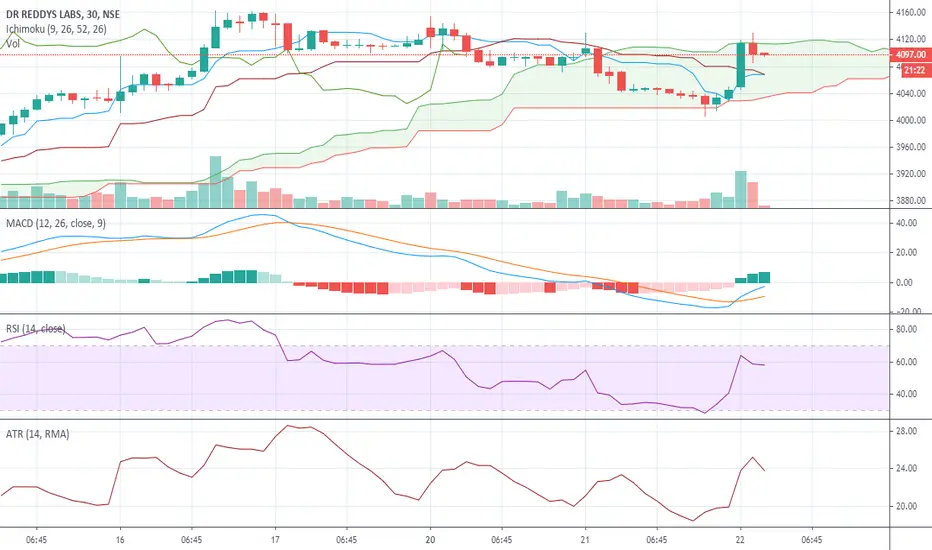
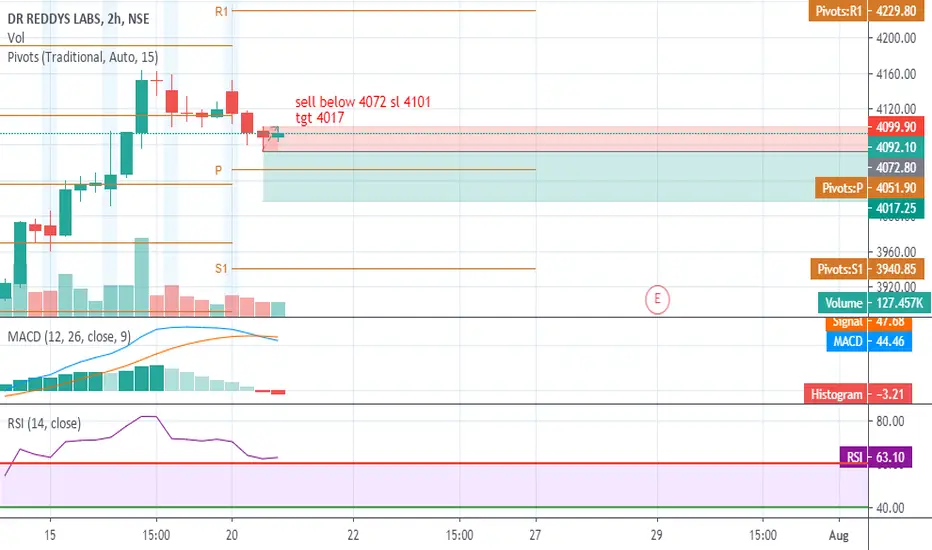
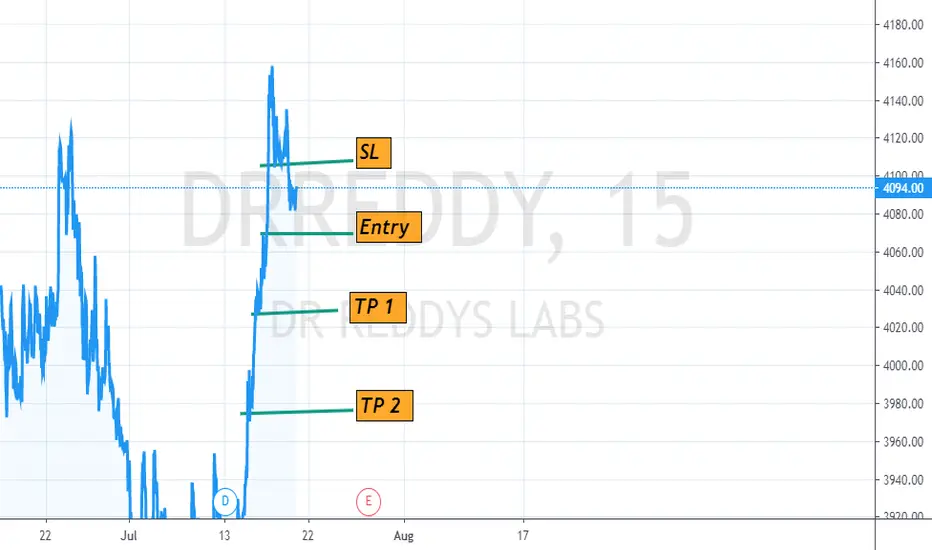
R-00071 Sell DRREDDY @ 4098.50 - 4105 SL 4137 TGT 4030Intraday Cash Sell DRREDDY @ 4098.50 - 4105 SL 4137 TGT 4030
TK cross over about to take place and some volume on sell after gap up.
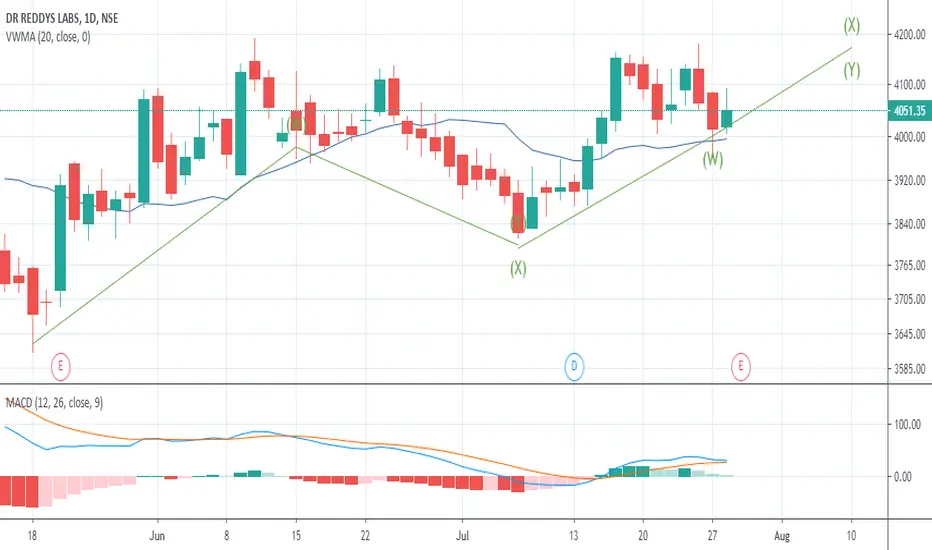
R-0034 Short Term Cash Buy DRREDDY @3970 - 3972 SL 3871 TGT 4125Short Term Cash Buy DRREDDY @ 3970 - 3972 SL 3871 TGT 4125 BREAK OUT AND CROSS OVER GO LONG ON SHORT TERM.