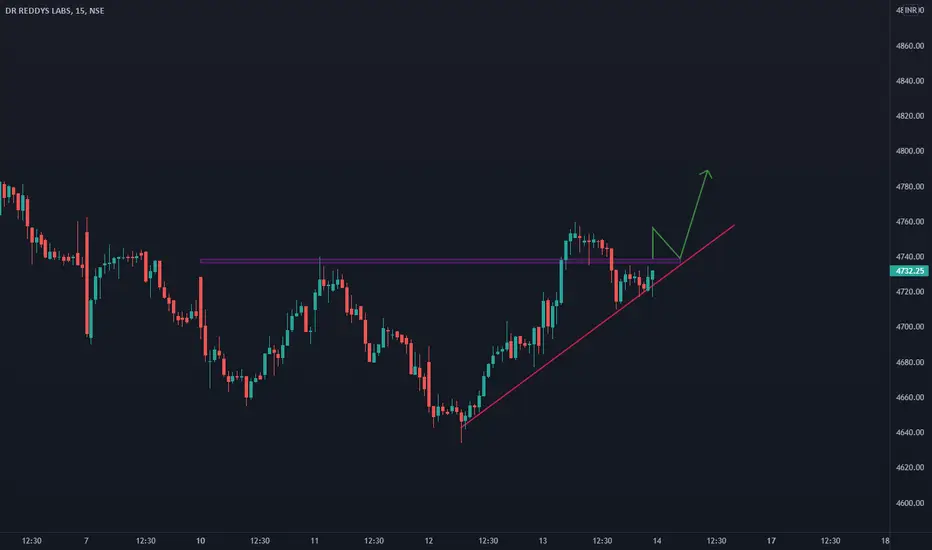
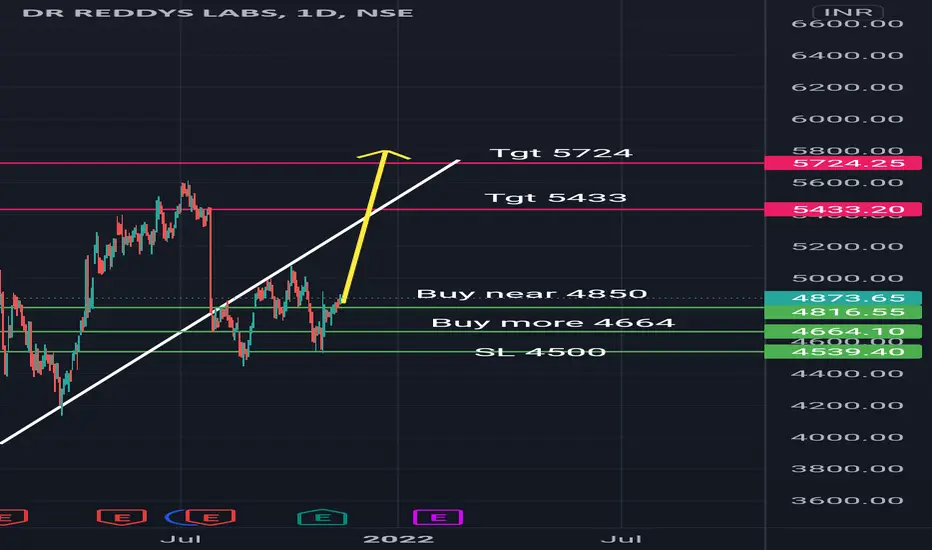
Dr. reddy looks ready to continue its uptrend if....The chart is pretty self-explanatory.
A buy can be initiated on a bullish signal from the next day's candle.
The reasons are mentioned on the chart itself.
DISCLAIMER: The ideas are merely for educational purposes. Please consult your financial advisors before taking any trade. Trade at your own risk.
DRREDDY trade ideas

DR.REDDY SWING TRADE
Buying opportunity in drreddy
FOR SWING TRADE AS SHOWN NOW IT MAKE DOGI CANNDLE AND IT MAY MOVE UP SIDE ACCORDING TO MY STUDY YOU CAN REFER IT
DRREDDY BUyDRREDDY BUy for day trading if stock and PHARMA Sector also bullish then we will buy the stock.....
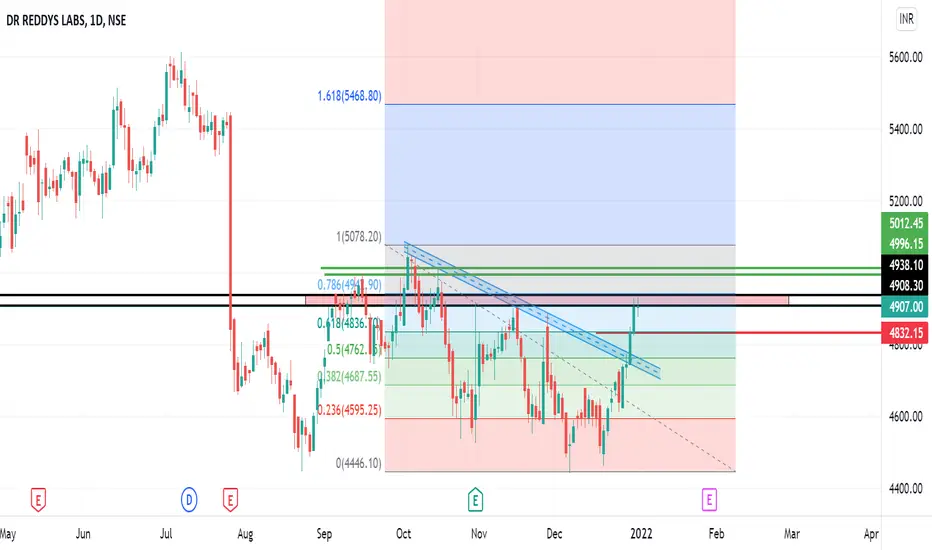
DRREDDY ANALYSISTrendline Breakout plus Golden Fib-Level(0.618) broken
CMP: 4907
Resistance Zone:4908-4940
Upside Targets:4996-5012
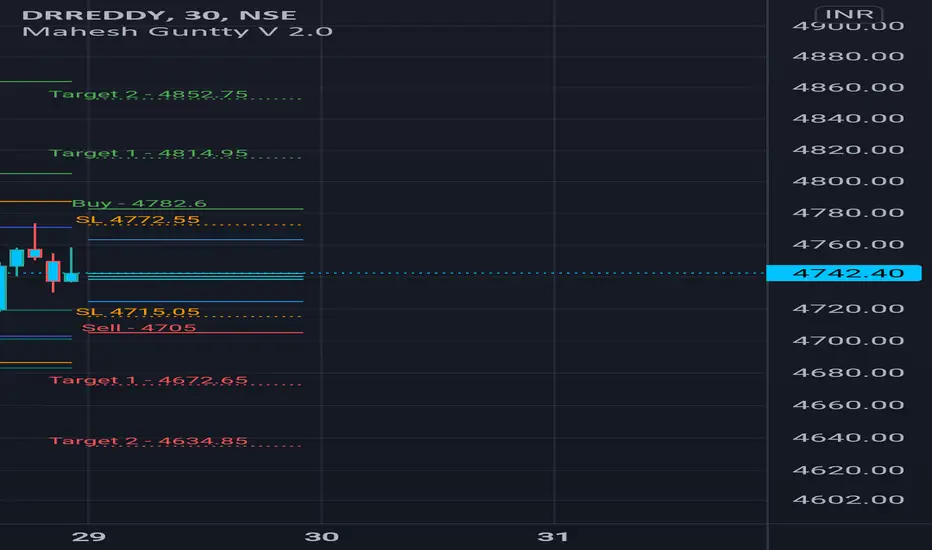
Support Zone:4762-4836
Below this zone DRREDDY is weak
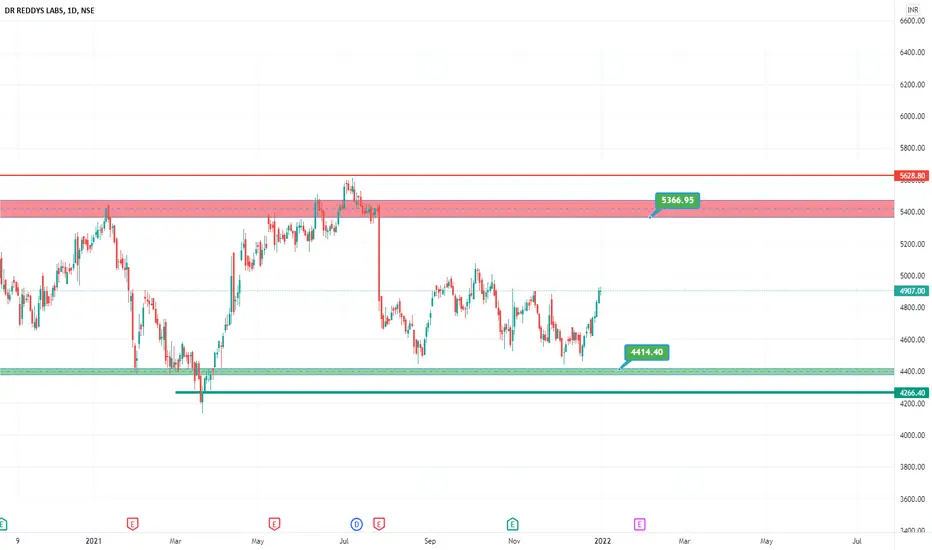
Dr reddy levels Short DR reddy at 5370 or buy PE with SL at 5628 which isnt coming or we can sell the 5700 CE when price comes at 5370
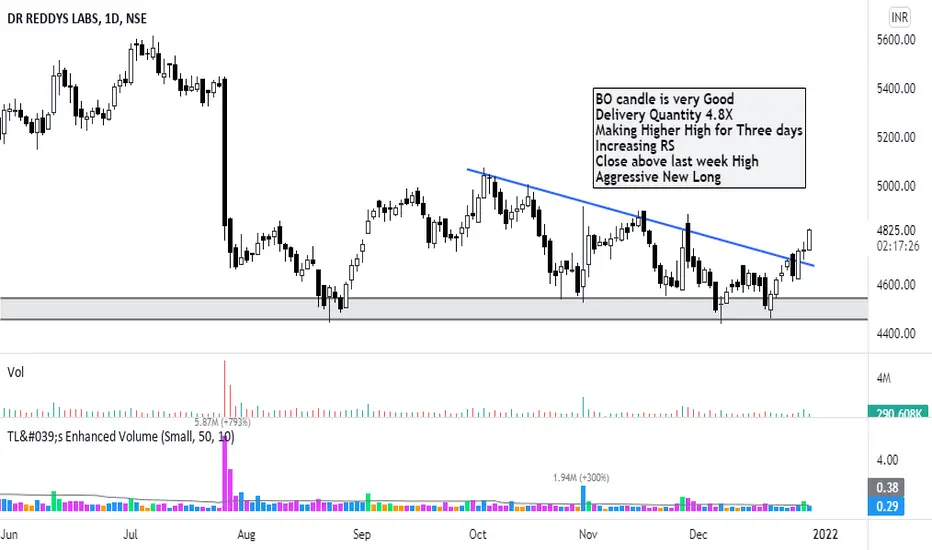
DR Reddy Looks GoodBO candle is very Good
Delivery Quantity 4.8X
Making Higher High for Three days
Increasing RS
Close above last week High
Aggressive New Long
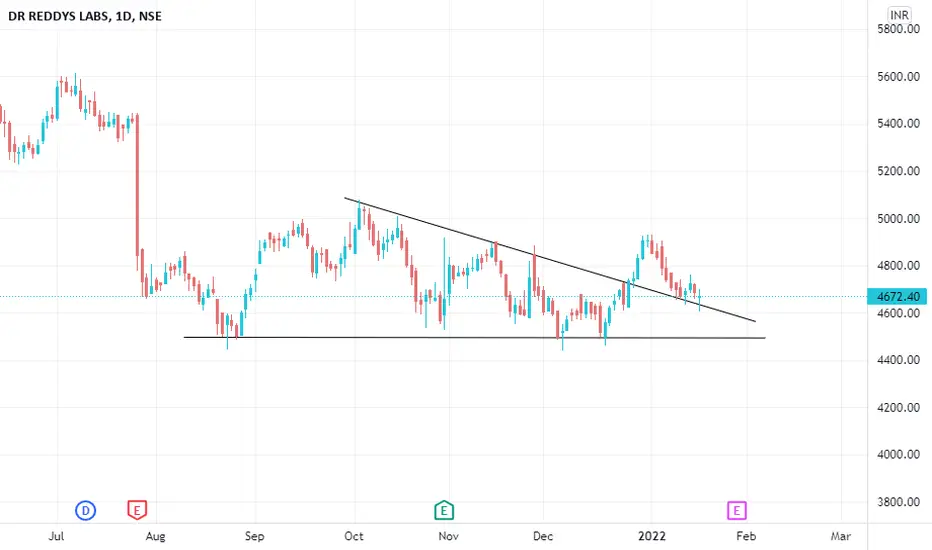
RDY - Triple Top SetupCould be bullish or break through top. Wait for candle to close above for breakout.

DRREDDY for 5000DRREDDY for 5000
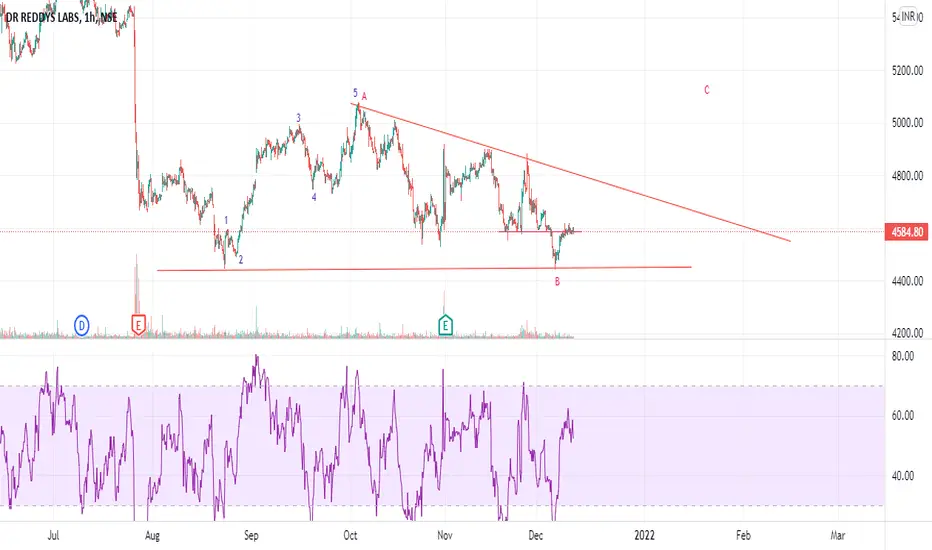
Flat target are 5000 but it will xtend in zigzag by 1.38 of wave A.

A analysis that everyone needJust follow PRICE ACTION that's it.
only trade on your own risk.
We are not SEBI registered.

DRREDDY UPSIDE POSSIBLEI would not be able to able to explain this chart this time but according to me the chart looks pretty self explanatory.
Please LIKE, COMMENT and SHARE to motivate and support me. I'll keep on posting new ideas on Indices & Stocks. Be sure to follow so that you don't miss any good trades that might have been rewarding.
Any comments and critiques will be appreciated even if it's of opposite view as a trader can also be right so many times.

Dr Reddy (Long)Dr reddy is a buy
Rest all levels are given on the chart
Must Correlate yourself also on charts. This is for educational purpose only. Must consult your financial advisor before investing.
100EMA,200EMA,400EMA CROSSOVER ON 30MINHi Trading View Family, Today I have found very intersting chart of DR REDDY, here we can see that on 30min TF we have found 100EMA,200EMA crossing each other when 100EMA cross 400EMA ,We can generate a buy,As100EMA,200EMA,400EMA is forming straight line on chart and then crossing which shows that price has been consolidate and now can go away from MOVING AVERAGE to give movement.So a high probability buy signal will be triggered when 100EMA CROSSES 200EMA,400EMA, and target of 1:2 can be achived.


DR.Reedy's at support line.Dr. Reddy's may give up move. Target - 5500
Hedging Idea -
Buy Dec Fut at - 4849
Buy Dec 4800 PE
Max Loss - 24731
Est. Profit - 62000
Margin Needed - 54000
TIME - 1.5 MONTH
Return - 115%
Tip. First buy put then buy future. PE will decrease your margin need.

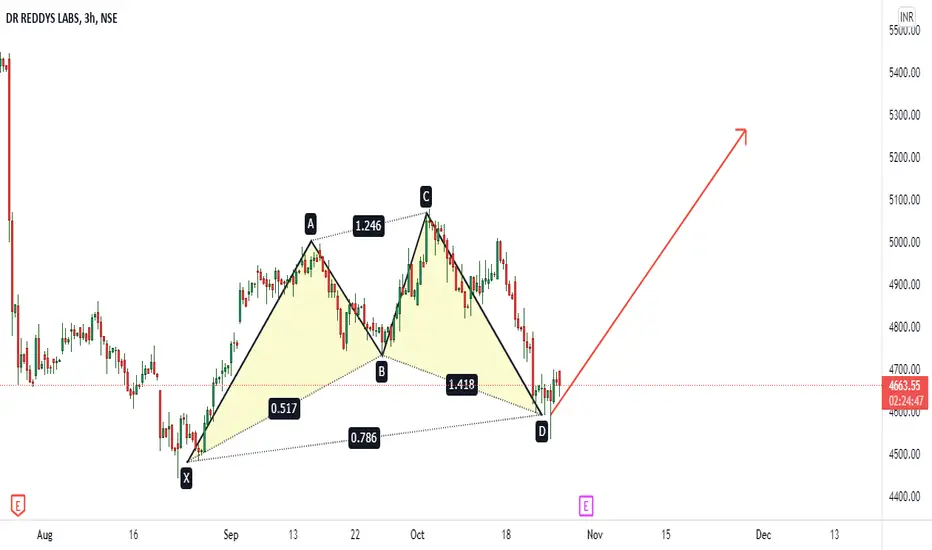
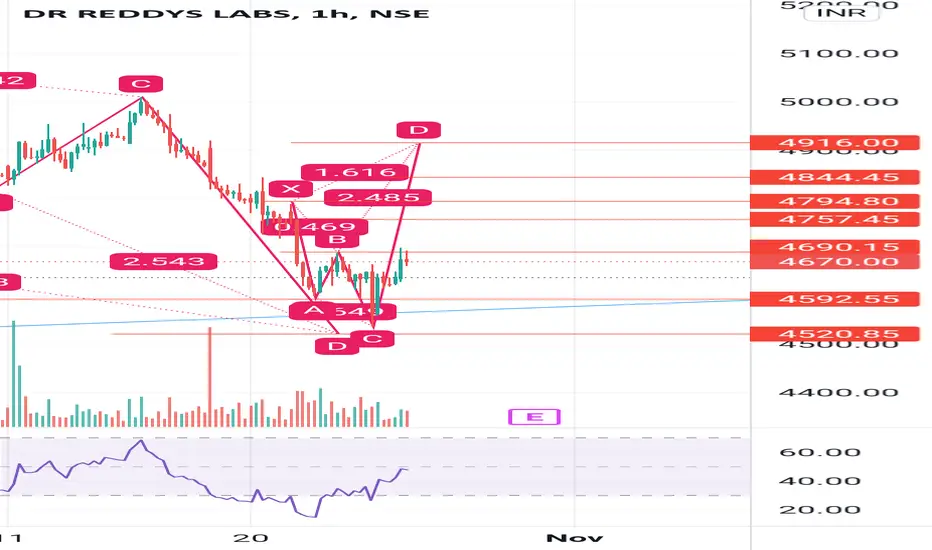
PERFECT CYPHER PATTERNMARKET ANALYSIS: Market has formed Perfect Cypher Pattern. Once it s valid Buy starts, probably may hit our targets soon. So lets wait !!
Dr reddy Looks good above 4690 upside targets on chart
If reversal incase downside level mentioned on chart... Stock looks bullish from here
DR REddy Buy for day tradingdr reddy stock make inverted head and shoulder pattern and its bullish chart pattern if the stock show strong then we will buy this stock for day trade

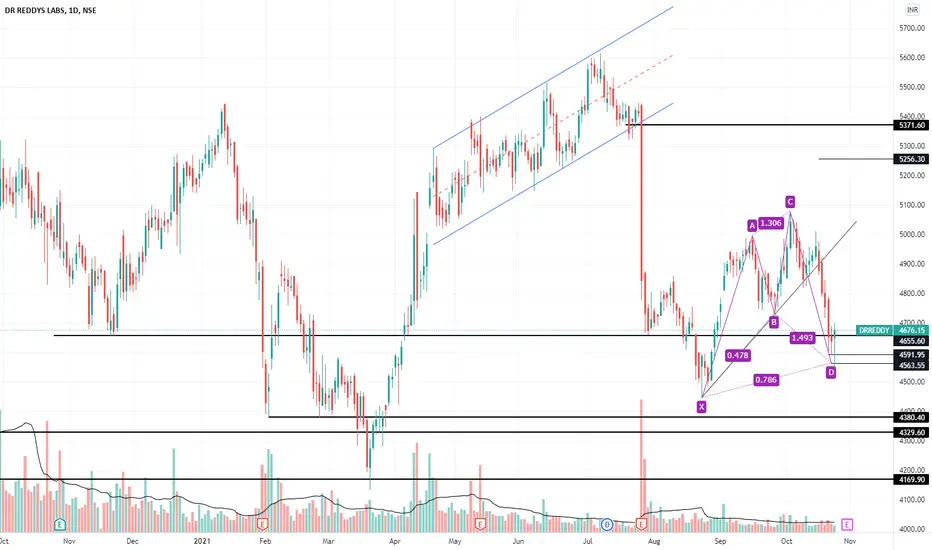
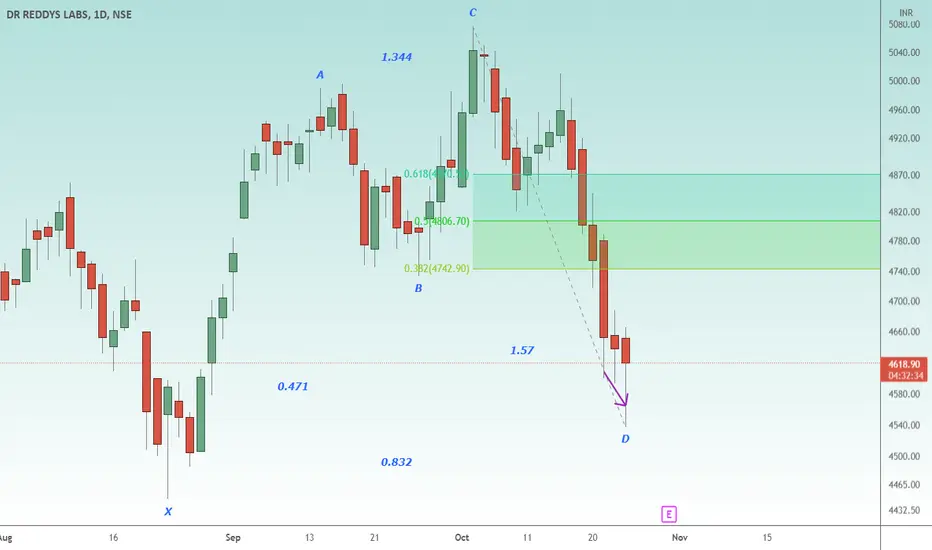
Dr Reddy's LabHello and a warm welcome to this technical outlook on Dr Reddy based on Harmonic Patterns.
In daily time frame it has made a Bullish Harmonic Cypher suggesting an up move possible till 4800/5000 with a stop loss at 4500.
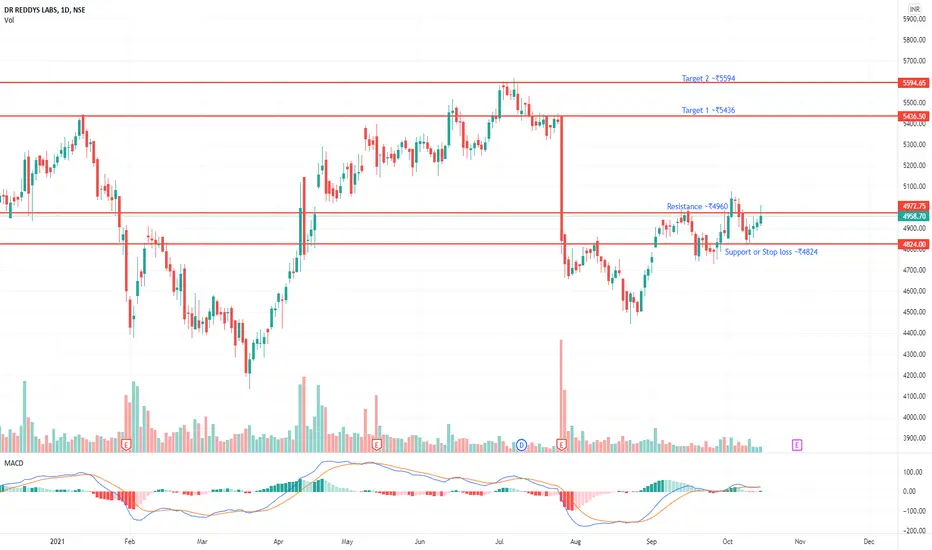
Long $DRREDDY CMP ₹4958.70Long $DRREDDY CMP ₹4958.70. Testing resistance. Failed to follow thru last time. Mini cup and handle pattern. Earning expectation could take price back to previous highs. Resistance ~₹4972 Target 1 ~₹5436 Target 2 ~₹5594 Stop Loss ~₹4824