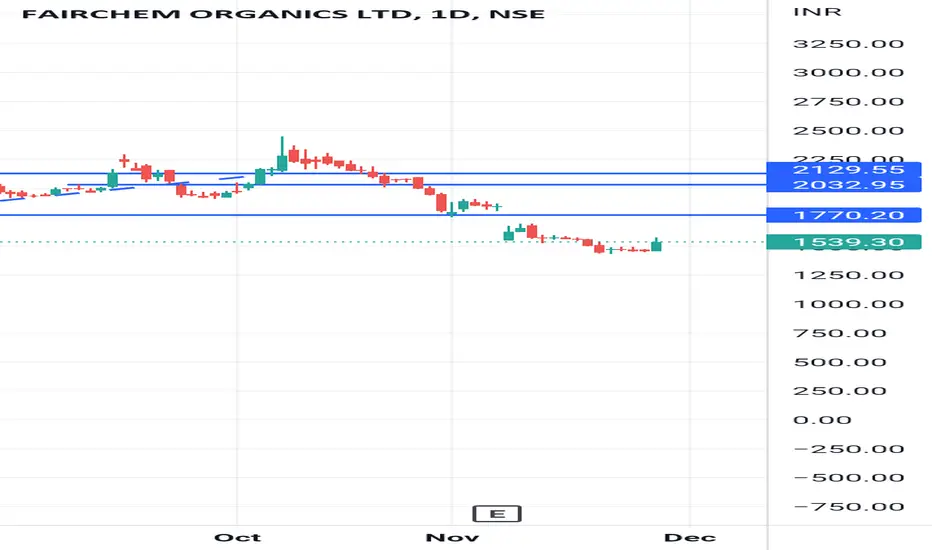
FAIRCHEM ORGANICS LTD S/RSupport and Resistance Levels:
Support Levels: These are price points (green line/shade) where a downward trend may be halted due to a concentration of buying interest. Imagine them as a safety net where buyers step in, preventing further decline.
Resistance Levels: Conversely, resistance levels (red line/shade) are where upward trends might stall due to increased selling interest. They act like a ceiling where sellers come in to push prices down.
Breakouts:
Bullish Breakout: When the price moves above resistance, it often indicates strong buying interest and the potential for a continued uptrend. Traders may view this as a signal to buy or hold.
Bearish Breakout: When the price falls below support, it can signal strong selling interest and the potential for a continued downtrend. Traders might see this as a cue to sell or avoid buying.
MA Ribbon (EMA 20, EMA 50, EMA 100, EMA 200) :
Above EMA: If the stock price is above the EMA, it suggests a potential uptrend or bullish momentum.
Below EMA: If the stock price is below the EMA, it indicates a potential downtrend or bearish momentum.
Trendline: A trendline is a straight line drawn on a chart to represent the general direction of a data point set.
Uptrend Line: Drawn by connecting the lows in an upward trend. Indicates that the price is moving higher over time. Acts as a support level, where prices tend to bounce upward.
Downtrend Line: Drawn by connecting the highs in a downward trend. Indicates that the price is moving lower over time. It acts as a resistance level, where prices tend to drop.
Disclaimer:
I am not a SEBI registered. The information provided here is for learning purposes only and should not be interpreted as financial advice. Consider the broader market context and consult with a qualified financial advisor before making investment decisions.
FAIRCHEMOR trade ideas
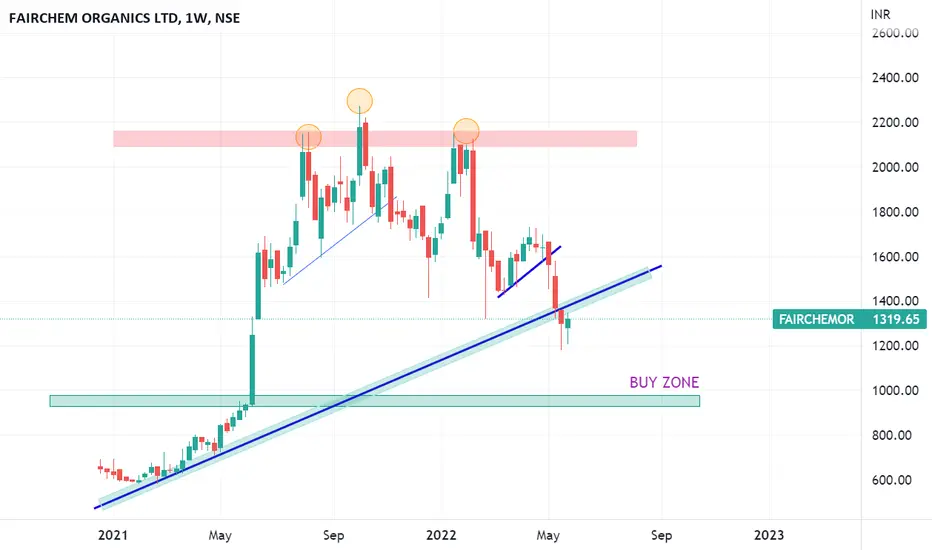
Fairchem organics - Long term wedge nearing breakout?Fundamentally strong company had a great run up and then collapsed. By looking at the chats, mmulti year breakout seems probable. My view is long.

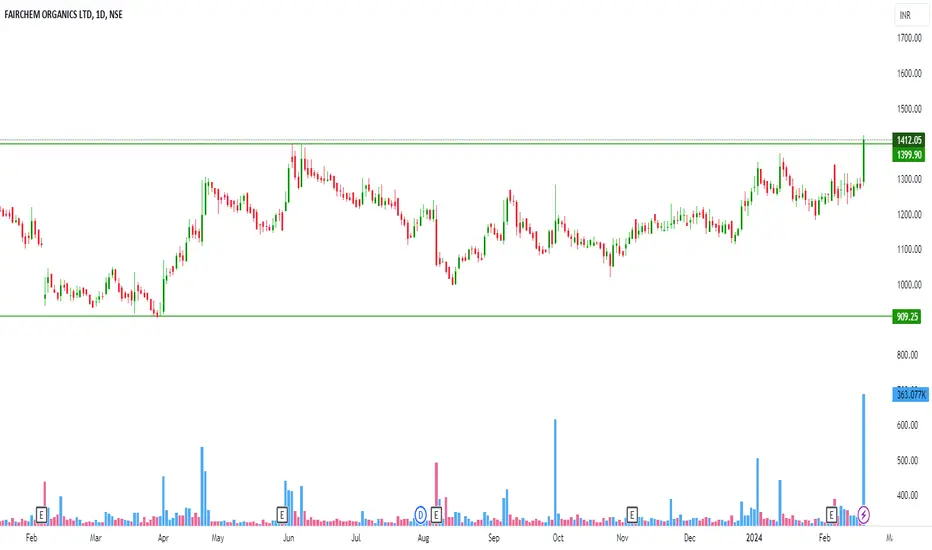
FAIRCHEMOR viewFAIRCHEMOR
Good buying happened today..
watching for next days
Charts for educational purposes only
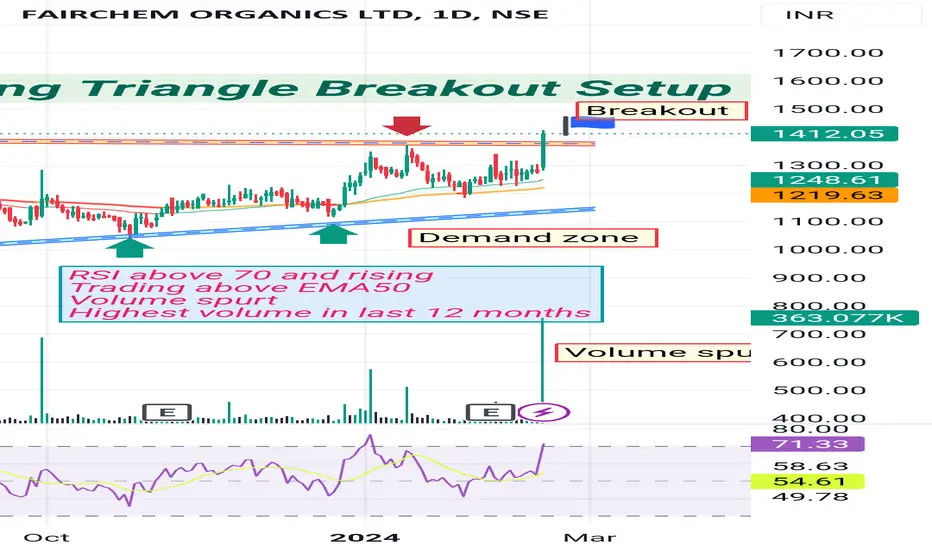
Breakout in FAIRCHEM ORGAscending Triangle Breakout setup
RSI above 70 and rising
Trading above EMA50
Volume spurt
Highest volume in last 12 months
Possible levels : 1700>>1768>>2070
Stoploss : 1280
Disc : for study, not a recommendation
FAIRCHEM OR : Multibagger Returns Soon !!FAIRCHEMOR stock has made Big Broadening Pattern
And around the support of Broadening pattern stock has made Ascending Triangle pattern
Also Stock has given Breakout of Ascending Triangle pattern
We can clearly see Breakout with Huge Green Candle!!!!
Stock can show 2100 levels in coming weeks
Which is 50% from here on.
Broadening Pattern target is 3000+
Which is more than 100% From current price.
Disclaimer : We are not SEBI registered analyst. Do your own research before taking any investment decision.
#stock #stockmarket #investing #money #finance #trading #investment


Fairchem Organics Limited - Keep an Eye📊 Script: FAIRCHEMOR (FAIRCHEM ORGANICS LIMITED)
📊 Nifty50 Stock: NO
📊 Sectoral Index: N/A
📊 Sector: Chemicals
📊 Industry: Specialty Chemicals
Key highlights: 💡⚡
📈 Script is trading at upper band of Bollinger Bands (BB) and giving breakout of it.
📈 Crossover in MACD coming soon.
📈 Double Moving Averages is giving crossover.
📈 Volume is increasing along with price as highlighted in chart.
📈 Script is trading at its resistance level which is 2136, if script is breaking its resistance level it may give rally of 6% around 2274 level.
📈 Current RSI is around 72.
📈 One can go for Swing Trade.
BUY ABOVE 2136
⏱️ C.M.P 📑💰- 2136
🟢 Target 🎯🏆 - 2274
⚠️ Important: Always maintain your Risk & Reward Ratio.
✅Like and follow to never miss a new idea!✅
Disclaimer: I am not SEBI Registered Advisor. My posts are purely for training and educational purposes.
Eat🍜 Sleep😴 TradingView📈 Repeat 🔁
Happy learning with trading. Cheers!🥂

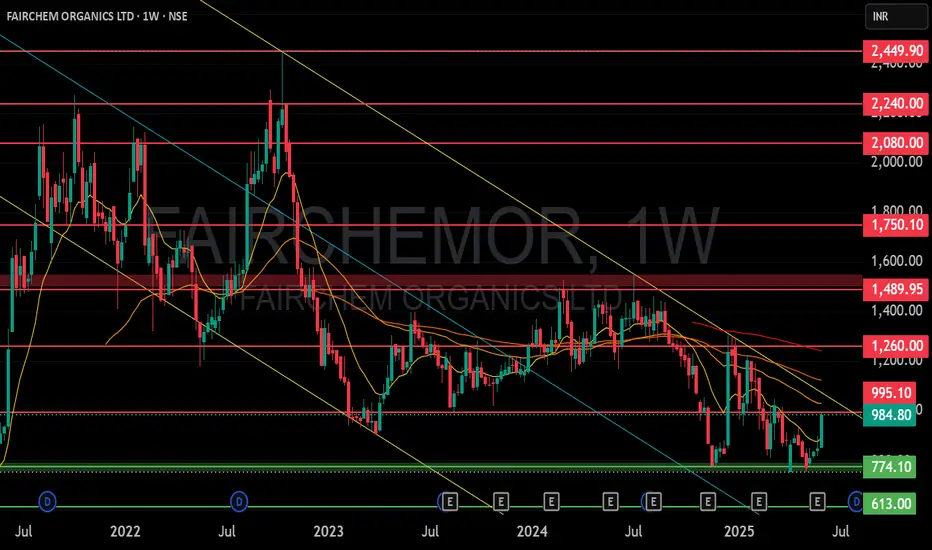
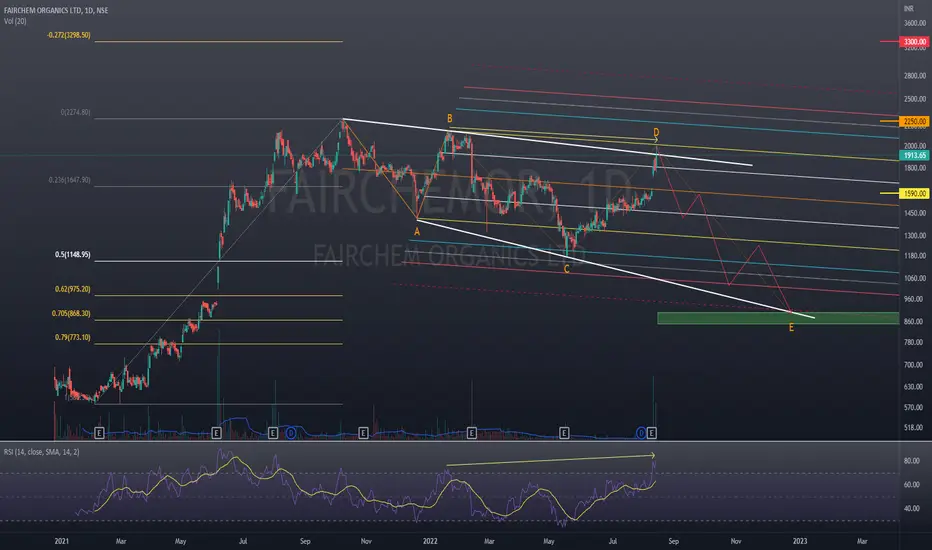
FAIRCHEM ORGANICS Trend AnalysisPrice is showing hidden bearish divergence with RSI on Daily & Weekly TF.
Descending broadening wedge pattern is forming as highlighted.
Fundamentally the stock is highly overvalued.
Good to accumulate around 850-900 levels for the following targets:
Short term swing target @ 1590 (76.67% ROI)
Medium term swing target @ 2250 (150% ROI)
Long term positional target @ 3300 (266.67% ROI)
Do your own due diligence before taking any action.
Peace!!
FAIRCHEM ORGANICSNON LOG: Weekly TF, price broke the weekly support TL and retested. Probability to go down is very high. Immediate Target is 950 to 1000