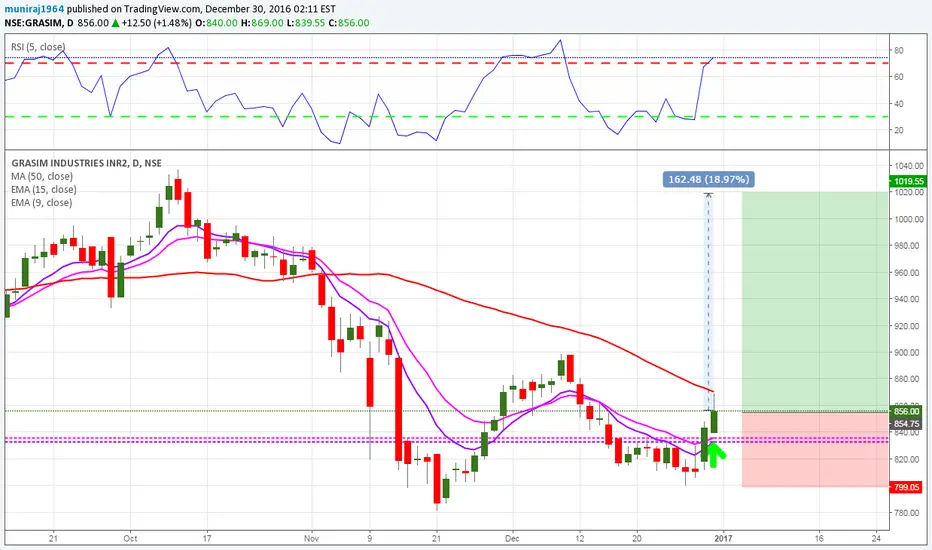
DNA BUY= 855 , SL -799 , TP-1019DAILY FINANCIAL WISDOM: Just as in trading "A sailor can't control the wind, but he can adjust the sails..."
GRASIM trade ideas
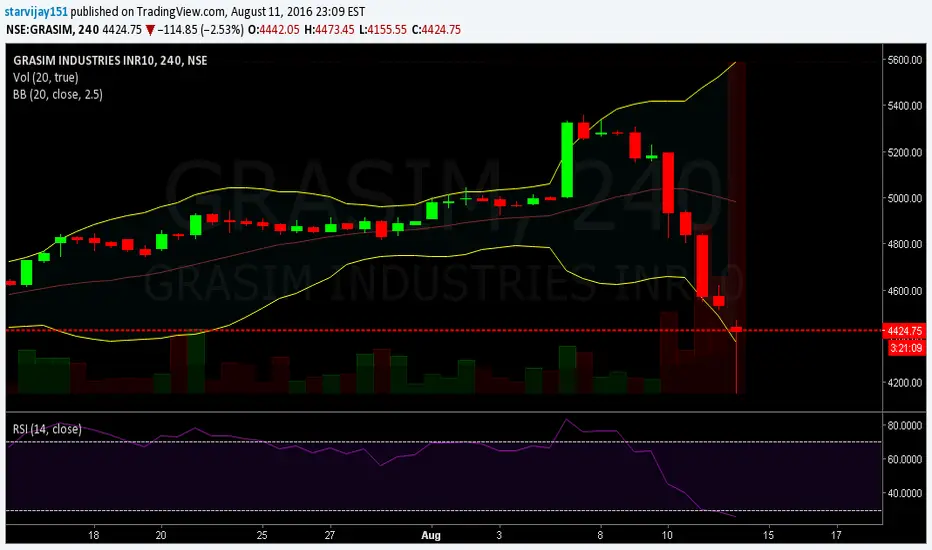
Grasim Industries - Technical Analysis - 8/12/2016Nothing can defy gravity forever in markets. Grasim industries stock's nonstop run from 3200 to 5400 has finally come to an end. Almost 1000 points, which took around 3 months to gain have been undone in just 3 days. There is a lesson for traders that, no matter how good things look, you need to keep your risk in check. Now let's work on levels which can give us good trading opportunities in days /weeks / months ahead.
A sharp bounce after a huge drop has come precisely from the first line of support area of 4200 - 4400. There is possibility that the stock can stabilize here and remain sideways or head north again. But we are more interested in the next best support level of 3800. Because when such high beta stock is on run, few hundred points are nothing. That's the reason we would like to lean against better levels so that in case of emergency we have an exit ;)
So casting a wide net between 3800 and 3500 during the drop may provide good buy side trading opportunities.
Besides, our trade set up in ICICI Bank has been working good and we are jobbing that 240 level from buy side.

$GRASIM building further short (see prior run up and selloff)$GRASIM building further short (see prior run up and selloff)
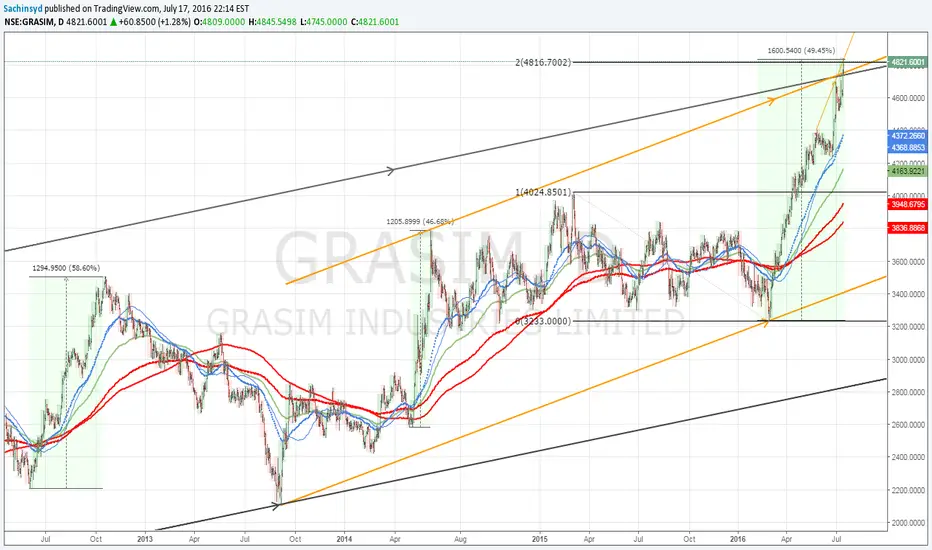
$GRASIM potential long term TOP$GRASIM potential long term TOP as major channel resis reached with parabolic rally of 45% similar to past 2 instances in 2013 and 2014

SHORT SELL GRASIM HEAD AND SHOULDERS PATTERNEventhough grasim is fundamentally strong company charts are showing weakness its a head and shoulder formation at top and ready for deep correction neckline support at 8200 a bounce expected from 8200 to 4300 and again fresh selling at 4323 levels to complete right shoulderany break below 4200 will provide target of 4000


$GRASIM short as long as under 4500$GRASIM short as long as under recent high LT channel resis in play now

GRASIM SELL SETUPDIS STOCK BROKEN ITS TREND LINE AND ITS TIME TO GO SHORT ...ENTRY STOP LOSS AND TARGETS GIVEN ON CHART.
IF YOU AGREE WITH MY VIEW DEN PLEASE HIT LIKE I REALLY APPRECIATE THAT.
TRADE WITH CARE
REGARDS
KING999
