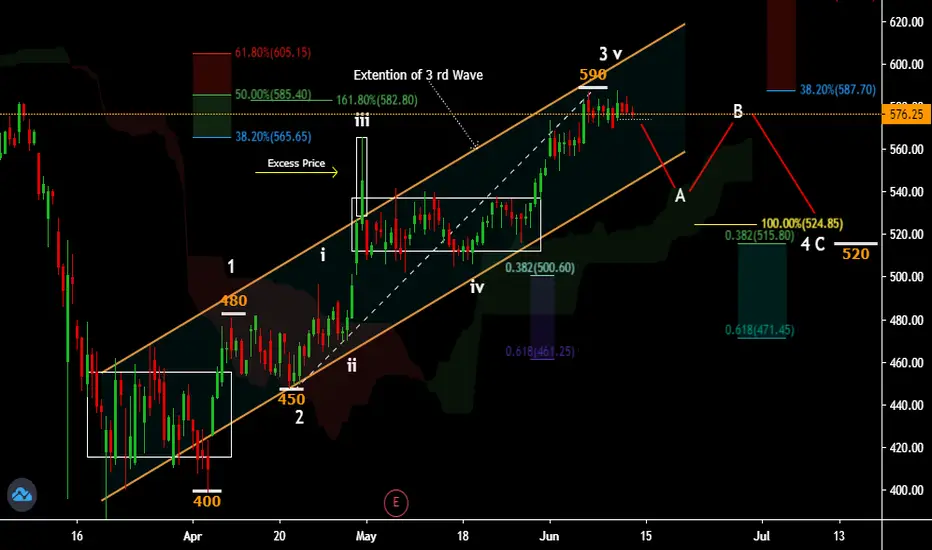
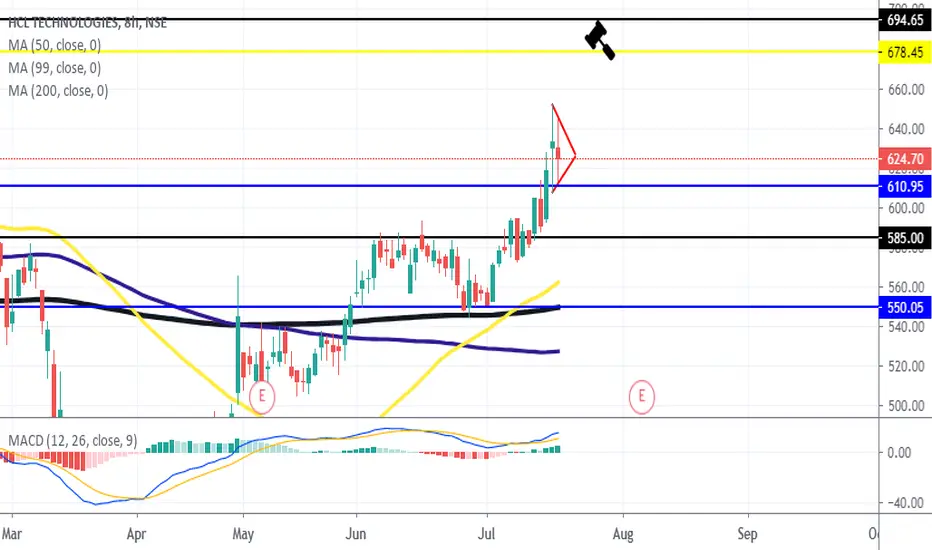
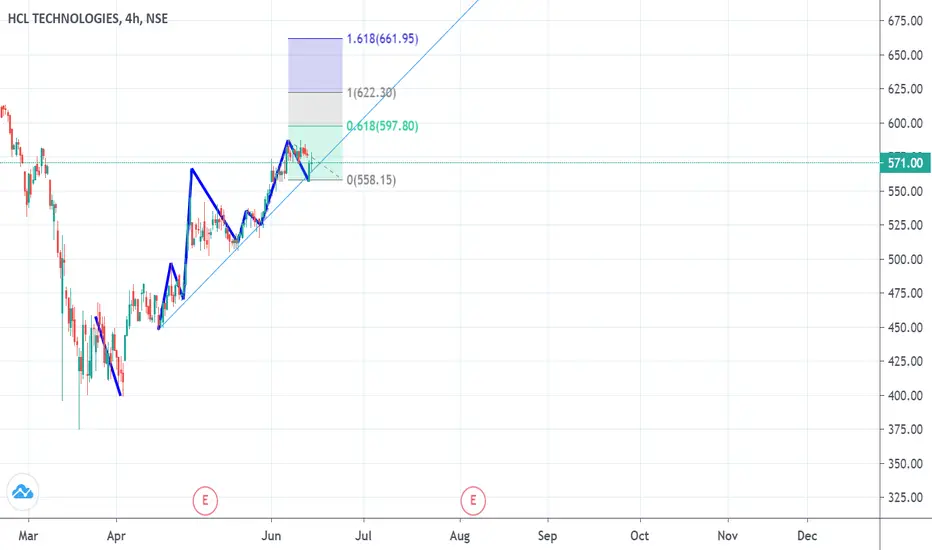
Trend Setup of HCL with Elliote Wave You will find me on my bio
Stocks Might Bearish Below 574 for Target Toward 550-5640-520.
Thanks
HCLTECH trade ideas
HCLTECH No More StrengthNSE:HCLTECH
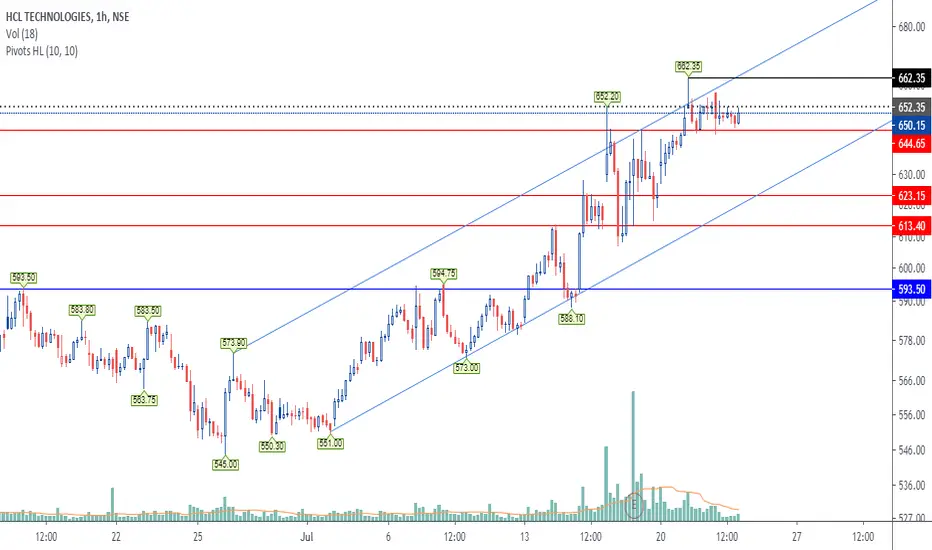
If you can see HCLTECH getting narrowing down its movement as its going up. And last couple of days its also not showing any strong bullish closing on Daily and 1H chart.
Volume is also indicating professionals are now not interested in higher prices.
We may consider this as weak stock now which may fall or best say it will show some retracement towards down sider.
I will consider this stock bearish only if it gives solid closing below 644 on 1H chart.
This bearish view will become invalid only above 662 closing basis.
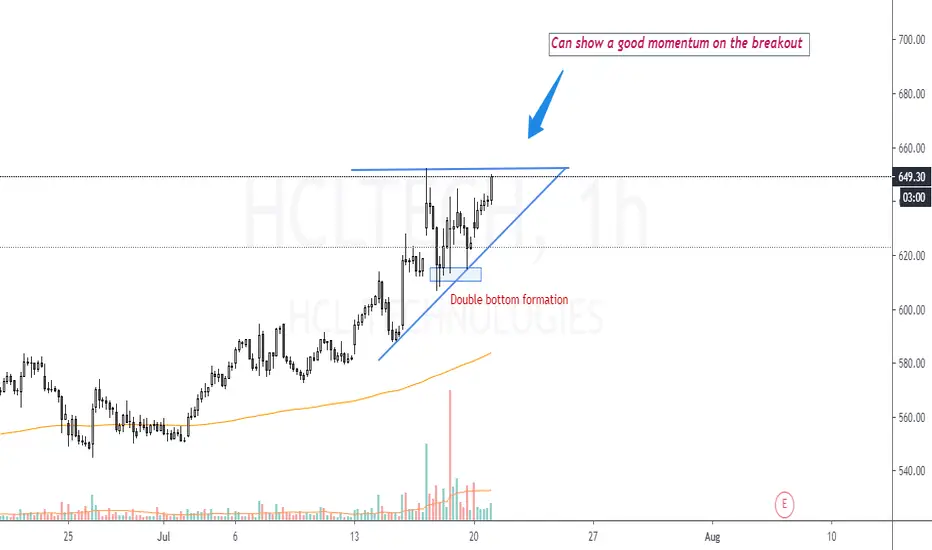
Pattern of the Day- Ascending TriangleGood momentum will be seen on breakout at the marked levels ahead of Quarterly results. Only buy when volume is heavy on breakout.
HCLTECH - Result announcement tomorrow - Created Doji#HCLTECH Quarter result will come tomorrow. Stock today Hit the 52 week High. but stock created a big doji and closed above the resistance line. Stock will be volatile for tomorrow. Level 640 & 650 has strong OI buildup compare to 620 and 610 level.
Showing Bullish result in Technical Parameter:
CCI in overbought zone
MACD is treading UP above 0
RSI near to overbought zone
William R% is bearish
Stoch reversing from overbought zone
MFI in overbought zone
ATR is decreasing since 5 day
Aggressive New Long
----------------------------------------------------------
Support : 585
Breakdown : 600
LTP : 627.65
Breakout : 653
Short Target : 700
----------------------------------------------------------
Positive & Negative Point:
1) Very Bullish in Daily/Weekly/monthly chart
2) Relative Strength - Benchmark index is increasing
----------------------------------------------------------
(Disclaimer: This is only for educational purpose and paper treading.)

First Female Head for an India IT Co. Having a quick gander at this one and it looks like the price discovery is still on going .
think another 2 days before this flag or possible descending triangle play out either way
SL 611
targeting just shy of 700 however we might just go up further ..
Long HCL Idea A declining wedge is formed so when the stock breaks out of it should hit those black lines which can be used for targets, Stop loss can be kept seeing the breakout keep the big momentums candle low as stoploss
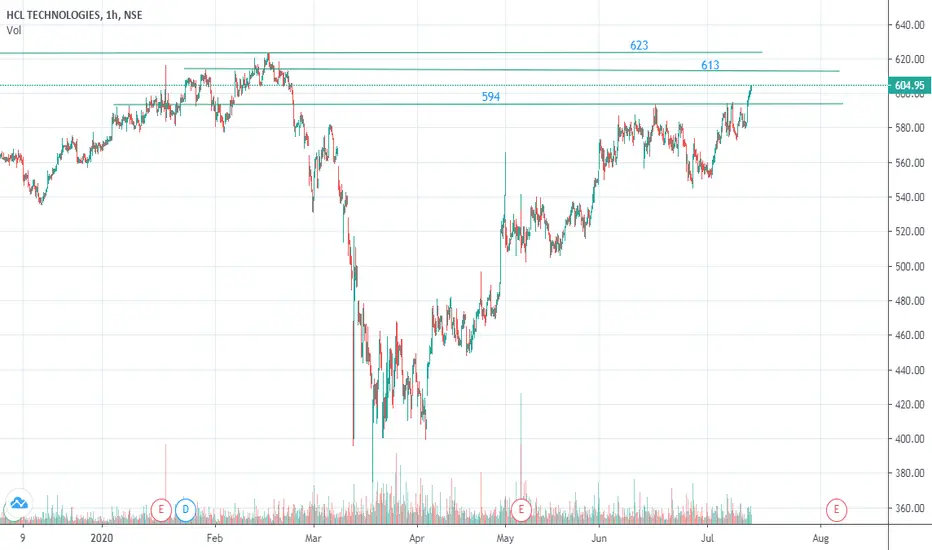
HCLTECHNSE:HCLTECH
IT Sector is in buzz, also results are there in coming days, hence it seems to be in upmove.
It can be entered with a sl of 594 for targets of 613 and 623, and beyond that further upside.
**********************************************************************************************************************************************
Hi all,
Its pleasure to have you all here.
I have started putting these charts as a contribution from my side to all people who are new to business, as I had to struggle a lot without any sources at disposal. So please consider this a just small contribution from my side.
Few Honest Disclosures:
1. Any idea shared is my personal view, its not a recommendation, neither any kind of paid propaganda, so please
do your bit of research.
2. Ideas shared does not mean that I trade all or have position in them, this is just a helping hand to all.
3. I expect no comments or like nor any negativity, as I said its just a small helping hand from my side, please plan your risk and trade as per your capacity.
4. To trade in Cash, options or futures is your sole choice and your own risk
5. I am no expert in Tech Indicators, I believe in support resistance and trendline theory, you may use this as a supplement theory for better results.
6. I work for my own living, this is a hobby which I do sincerely to help anyone who might come across my charts.
***********************************************************************************************************************************************
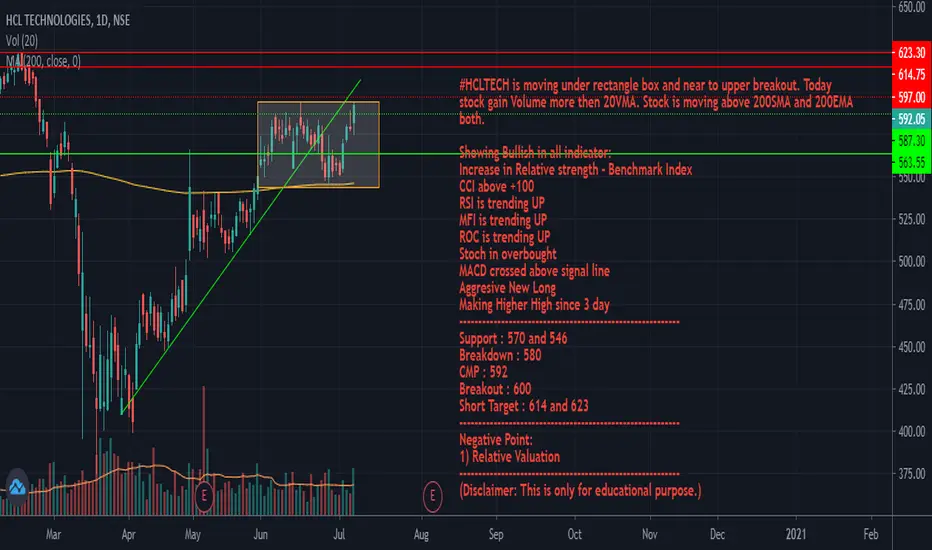
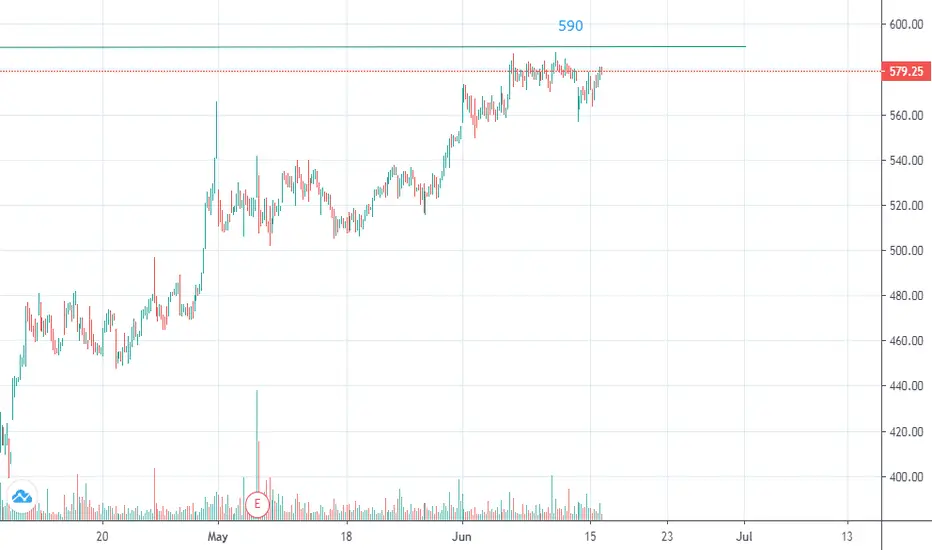
HCL TECH near to rectangle breakout - Very Bullish - Level#HCLTECH is moving under rectangle box and near to upper breakout. Today stock gain Volume more then 20VMA. Stock is moving above 200SMA and 200EMA both.
Showing Bullish in all indicator:
Increase in Relative strength - Benchmark Index
CCI above +100
RSI is trending UP
MFI is trending UP
ROC is trending UP
Stoch in overbought
MACD crossed above signal line
Aggresive New Long
Making Higher High since 3 day
----------------------------------------------------------
Support : 570 and 546
Breakdown : 580
CMP : 592
Breakout : 600
Short Target : 614 and 623
----------------------------------------------------------
(Disclaimer: This is only for educational purpose.)
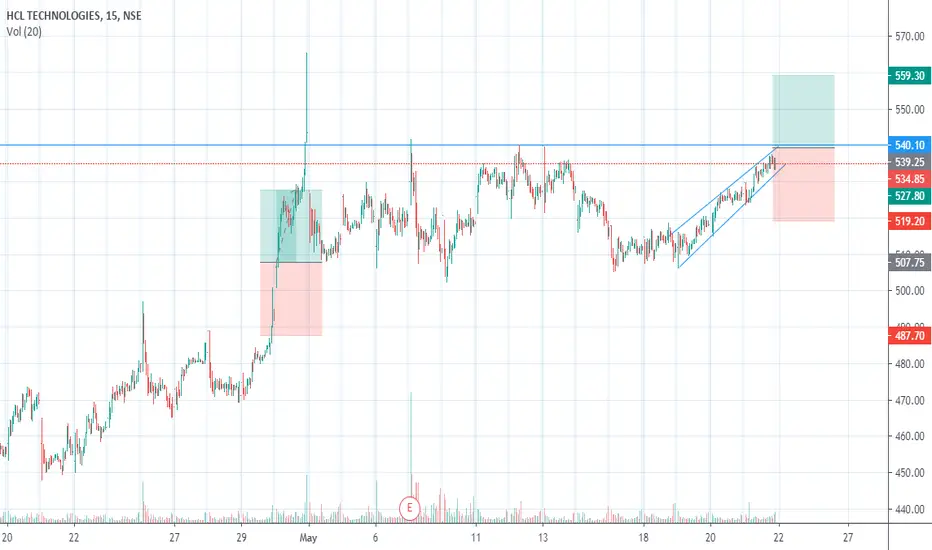
HCLTECH long - SetupNSE:HCLTECH gave a flag breakout but has resistance going ahead.
A close above 582 will put it in rocket.


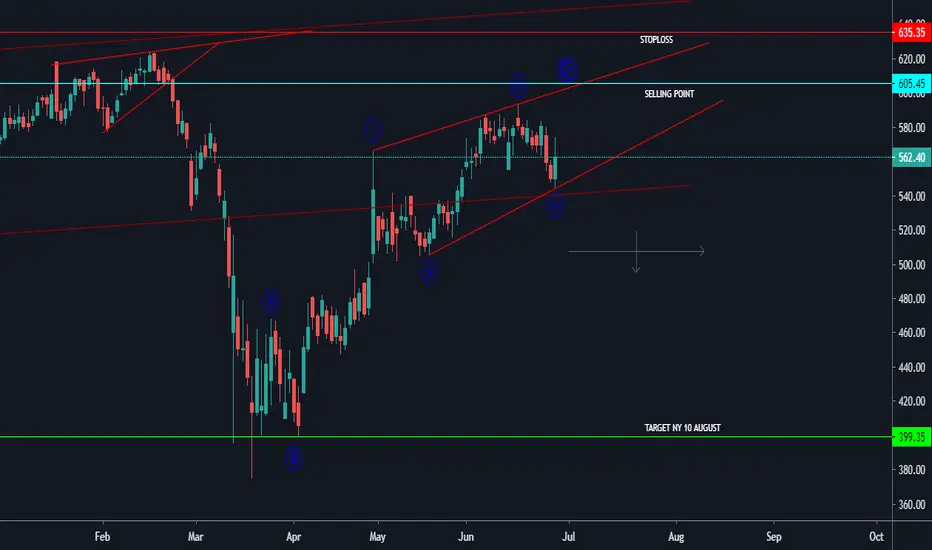
HCLTECH - GO SHORT @ 605 FOR A RR OF 1:7 BY 10 AUGUSTHCLTECH - GO SHORT @ 605 WITH A SL OF 635 AND A TARGET OF 400. TARGET SHOULD BE ACHIEVED BY 10 AUGUST 2020


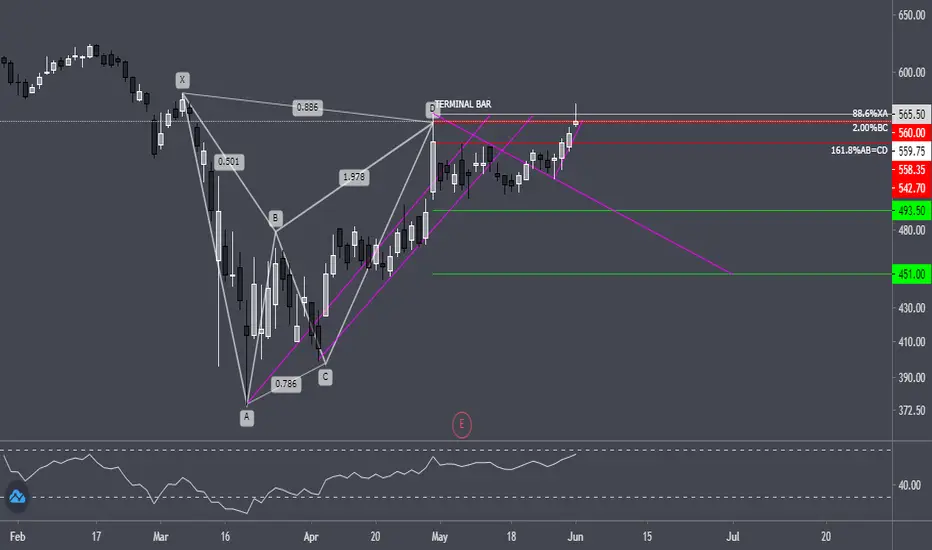
#BEARISH BAT HCLTECHBearish bat identified in daily time frame. type 2 completed PRZ test. i will look for reversal in hourly chart.
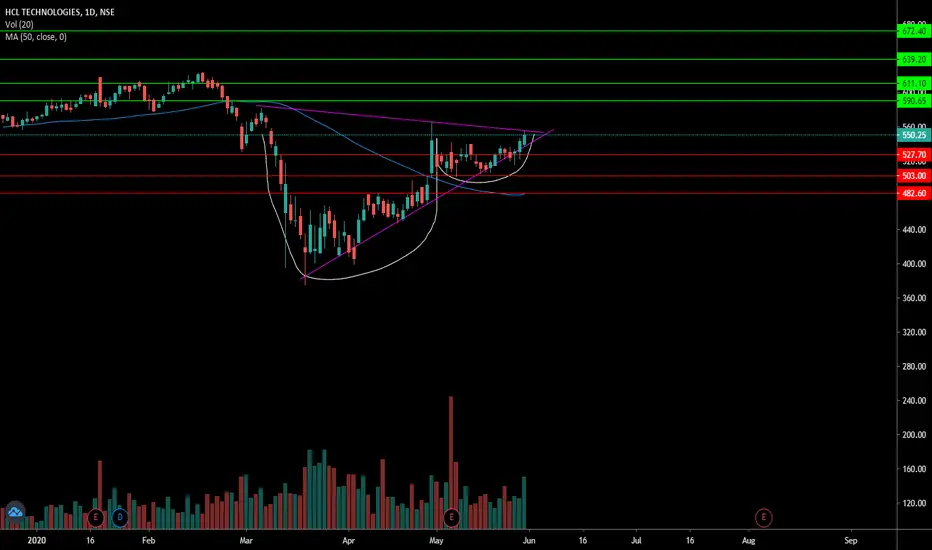
HCLTECH at the breakout level of 2 patternHcltech at the breakout point of 2 pattern.
Cup and handle
Pennant
Go long if its cross 556 on the closing basis on Monday
Support and resistance given on the chart. Cheers
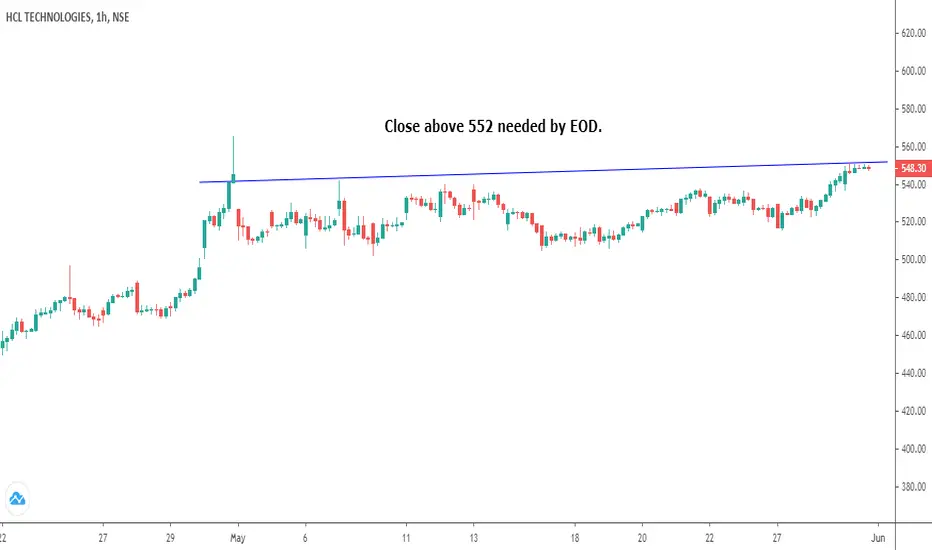
Close above 552 needed to resume uptrendClose above 552 needed to resume uptrend. Entire day struggling to cross 552
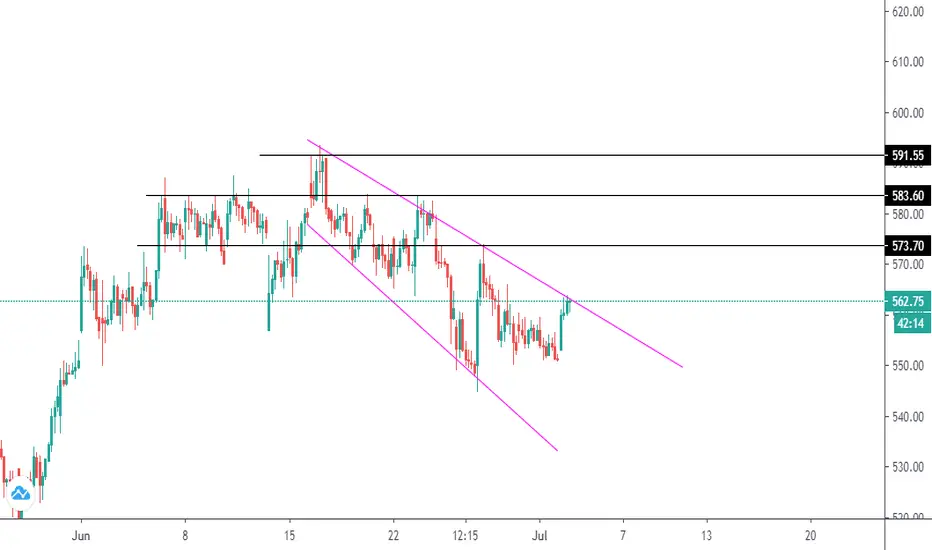
HCLTECH looking bearish for coming days.NSE:HCLTECH
As per price and volume we can clearly see strong rejection of higher prices. Daily chart is showing sideways trend.
As per the trend of higher TF HCLTECH looking good below 527 as per 30M chart for short with Sl above 537. Both entry and exit closing basis.
I am looking for targets of 515,506 in coming trading sessions.
