Technical Analysis of Hindustan Zinc Ltd(HINDZINC) Modify ChartTechnical Analysis of Hindustan Zinc Ltd (HINDZINC)
Key Observations from the Chart based on Technical Analysis:
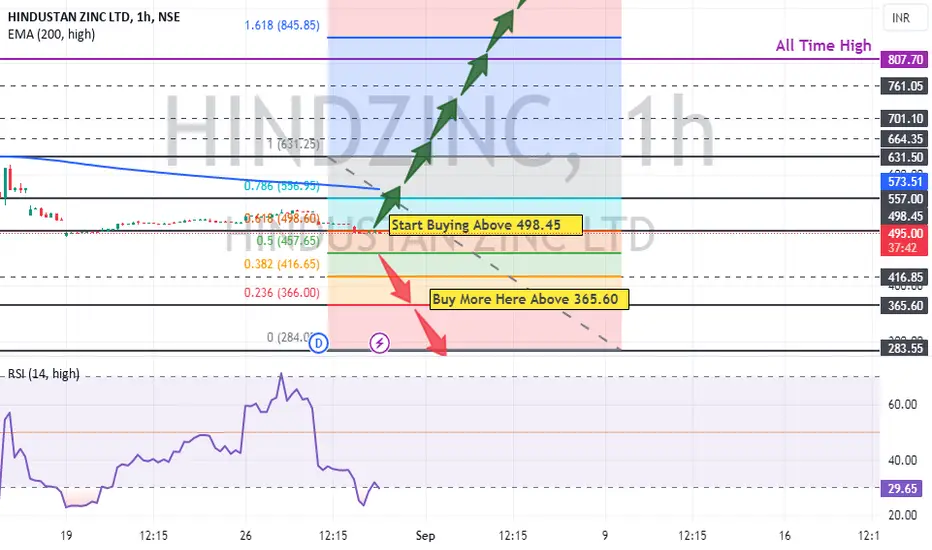
Price Action: The stock price has been consolidating in a range between approximately 480 and 500. This suggests a period of indecision among market participants.
Moving Average (EMA 200): The price is currently below the 200-day Exponential Moving Average (EMA), indicating a potential bearish trend. However, the EMA is relatively flat, suggesting a lack of strong momentum in either direction.
Volume: The volume appears to be moderate, with no significant spikes or declines. This could suggest that the current consolidation phase may continue for some time.
Relative Strength Index (RSI): The RSI is hovering near the neutral level of 50. This indicates that the stock is neither significantly overbought nor oversold.
Potential Trading Strategies:
Range Trading: If the stock continues to consolidate within the current range, traders might consider buying near the lower end of the range and selling near the upper end. However, this strategy requires careful risk management to avoid losses if the range breaks down.
Breakout Trading : If the price breaks out above the upper end of the range or below the lower end, it could signal a new trend. Traders might consider entering positions in the direction of the breakout. However, breakouts can be false, so it's important to use stop-loss orders to limit potential losses.
Additional Considerations:
Fundamental Analysis: - While this analysis is based on technical factors, it's also important to consider fundamental factors such as the company's financial performance, industry trends, and economic conditions.
Risk Management: Always use appropriate risk management techniques, such as stop-loss orders, to protect your capital.
Conclusion:- Hindustan Zinc Ltd appears to be in a consolidation phase, with no clear directional bias. Traders might consider range trading or breakout trading strategies, but should be cautious and use appropriate risk management techniques. It's also essential to consider fundamental factors before making investment decisions.
Disclaimer: This analysis is based solely on the technical analysis of the stock and does not constitute financial advice. Always consult with a financial advisor before making investment decisions. Do your own research before buying this stock and you are responsible for your loss. I am not SEBI registered person to suggest any stock and this is just my personal opinion only for educational purposes.
Thanks for your support as always
HINDZINC trade ideas
Technical Analysis of Hindustan Zinc Ltd (HINDZINC)Technical Analysis of Hindustan Zinc Ltd (HINDZINC)
Key Observations from the Chart based on Technical Analysis:
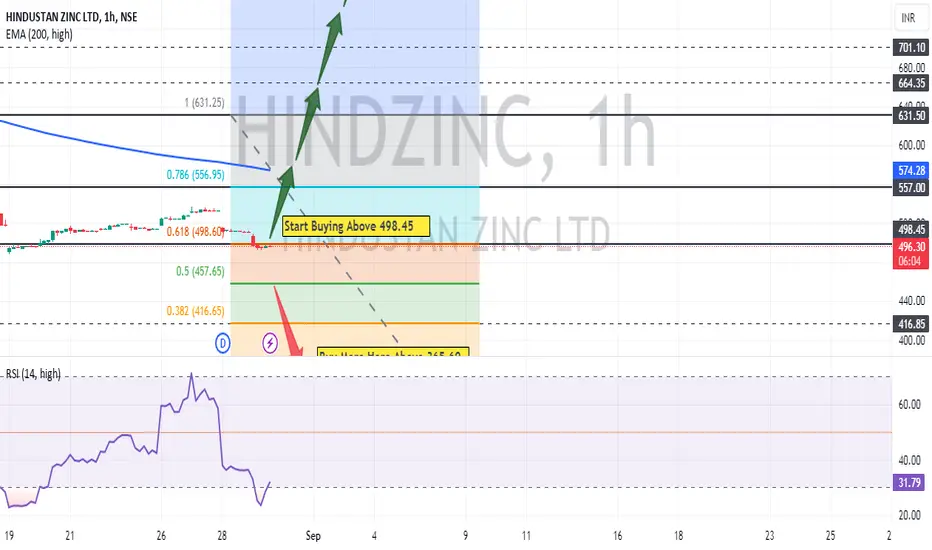
Price Action: The stock price has been consolidating in a range between approximately 480 and 500. This suggests a period of indecision among market participants.
Moving Average (EMA 200): The price is currently below the 200-day Exponential Moving Average (EMA), indicating a potential bearish trend. However, the EMA is relatively flat, suggesting a lack of strong momentum in either direction.
Volume : The volume appears to be moderate, with no significant spikes or declines. This could suggest that the current consolidation phase may continue for some time.
Relative Strength Index (RSI): The RSI is hovering near the neutral level of 50. This indicates that the stock is neither significantly overbought nor oversold.
Potential Trading Strategies:
Range Trading: If the stock continues to consolidate within the current range, traders might consider buying near the lower end of the range and selling near the upper end. However, this strategy requires careful risk management to avoid losses if the range breaks down.
Breakout Trading: If the price breaks out above the upper end of the range or below the lower end, it could signal a new trend. Traders might consider entering positions in the direction of the breakout. However, breakouts can be false, so it's important to use stop-loss orders to limit potential losses.
Additional Considerations:
Fundamental Analysis: - While this analysis is based on technical factors, it's also important to consider fundamental factors such as the company's financial performance, industry trends, and economic conditions.
Risk Management: Always use appropriate risk management techniques, such as stop-loss orders, to protect your capital.
Conclusion: - Hindustan Zinc Ltd appears to be in a consolidation phase, with no clear directional bias. Traders might consider range trading or breakout trading strategies, but should be cautious and use appropriate risk management techniques. It's also essential to consider fundamental factors before making investment decisions.
Disclaimer: This analysis is based solely on the technical analysis of the stock and does not constitute financial advice. Always consult with a financial advisor before making investment decisions. Do your own research before buying this stock and you are responsible for your loss. I am not SEBI registered person to suggest any stock and this is just my personal opinion only for educational purposes.
Thanks for your support as always
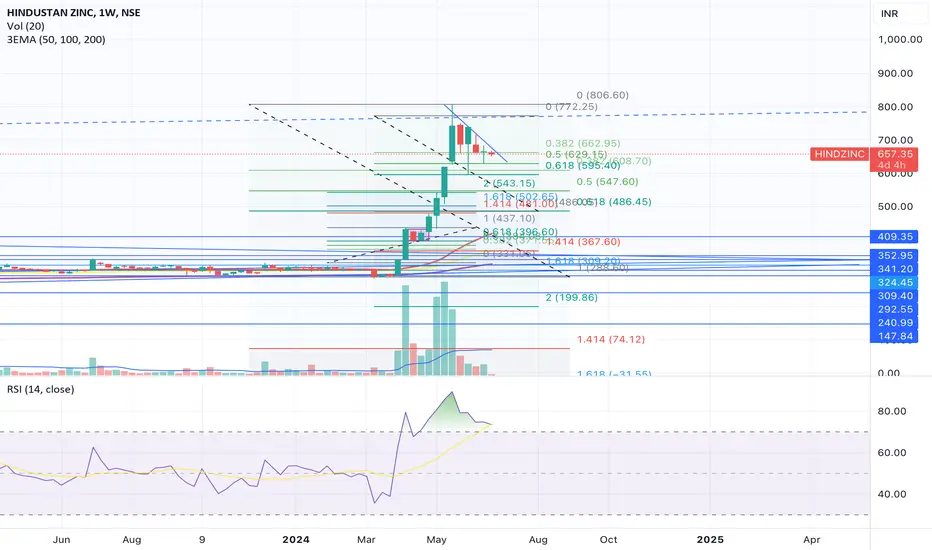
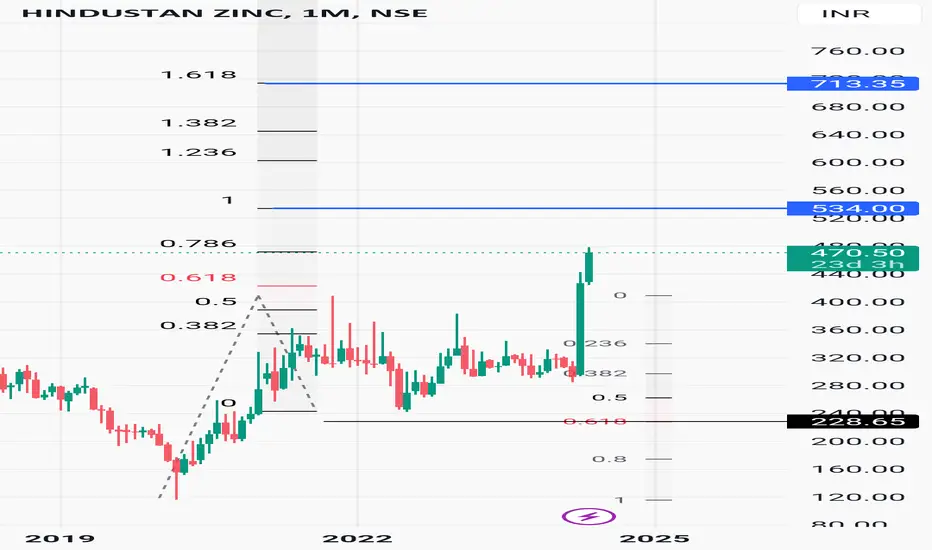
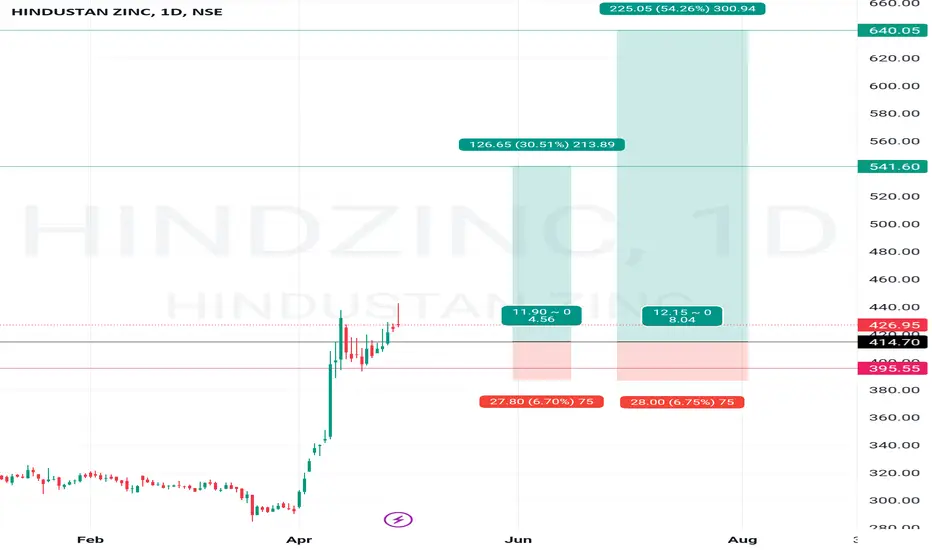
Hindustan Zinc LTDA Flag Pattern is a technical analysis chart pattern that typically indicates a continuation of the previous trend. In the context of Hindustan Zinc, if the stock is forming a Flag Pattern and breaks out above the resistance level, it suggests that the price could potentially continue its upward movement.
To estimate a potential price target, you would generally measure the height of the flagpole (the distance between the start of the flag and the beginning of the flag) and then add this height to the breakout point. In your case, if the target is projected to be around 520 points, that indicates a significant bullish signal, assuming the breakout is confirmed and supported by strong trading volume.
It's essential to also consider other factors such as overall market conditions, company fundamentals, and potential news or events that could impact the stock price. Always use technical analysis in conjunction with other tools and research to make informed investment decisions.

Hindzinc: Silver lining?be ready for the pennant breakout...the scrip already have taken a long run and this small retracement may be just there to lose the weak hands, it may run good again once price breaks the small trendline on the upper side.
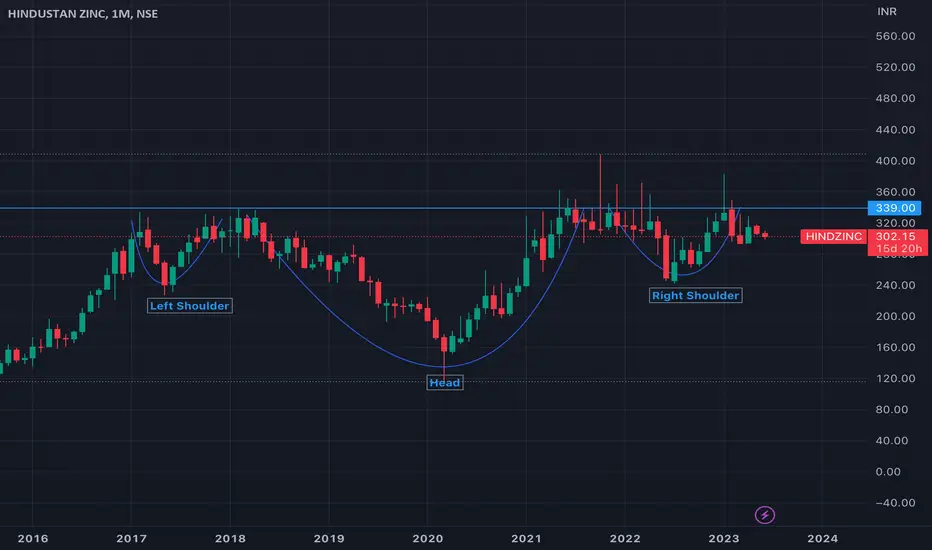
HIndustan Zinc looking bullishHindustan Zinc has completed the long-term Head & Shoulders Pattern recently and is looking bullish with an upside of INR 150 from current levels in the near term of 12-18 months horizon.
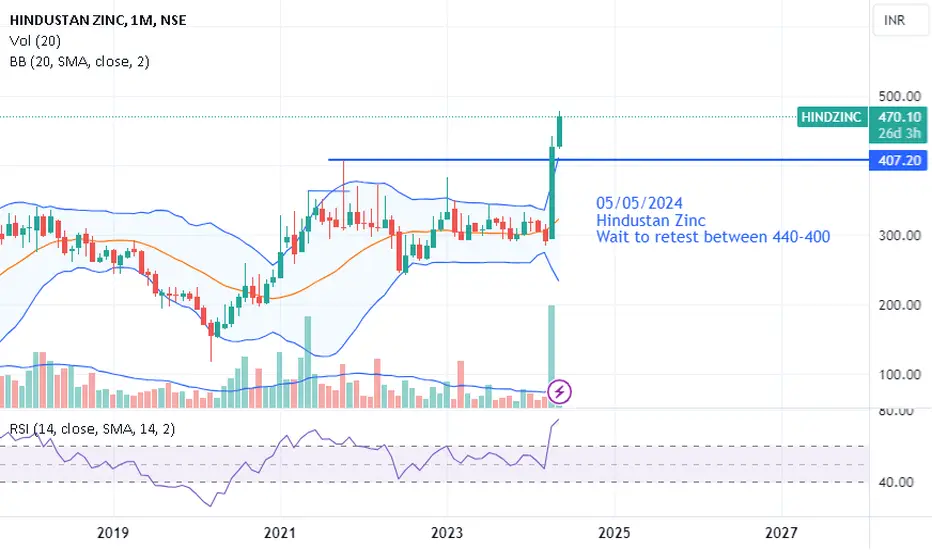
Multiyear breakout hind zinkStock did not give us a chance to enter but has given a very strong breakout after long time
we should wait for price retracement to 370-400
Look for any bullish candle on weekly time frame near 100 ema or near strong support

Multiyear breakout hind zinkStock did not give us a chance to enter but has given a very strong breakout after long time
we should wait for price retracement to 370-400
Look for any bullish candle on weekly time frame near 100 ema or near strong support

HINDZINC Achieved All The Targets 🚀🚀🚀 Study Shared on 02/05/2024 ..
Hindustan Zinc in Zinc-Lead and Silver business is world’s 2nd largest integrated Zinc producer and now the 3rd largest Silver producer. The company has a market share of ~75% of the growing Zinc market in India with its headquarters at Zinc City, Udaipur along with Zinc-Lead mines and smelting complexes spread across the state of Rajasthan.

Hzl Going For All New High Hindustan zinc limited. Massive breakout. Going for new highs in upcoming days.
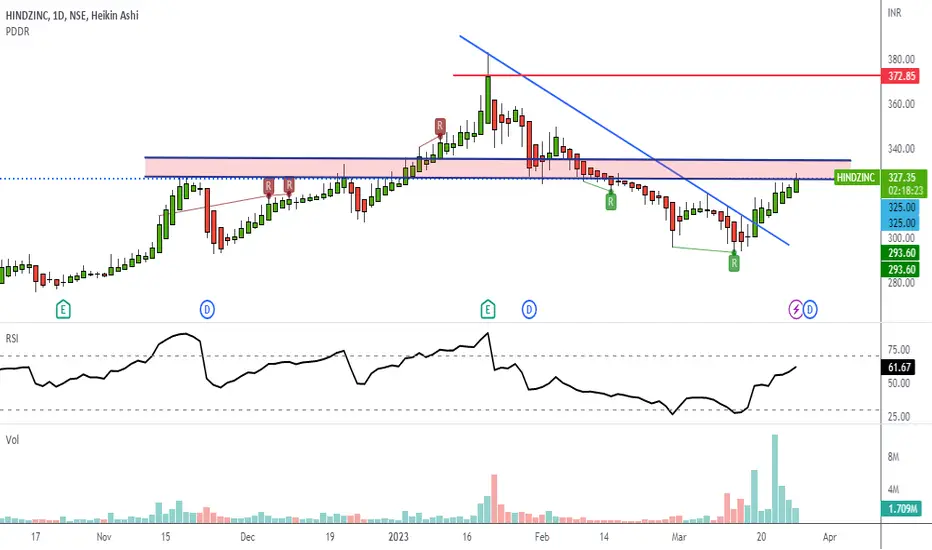
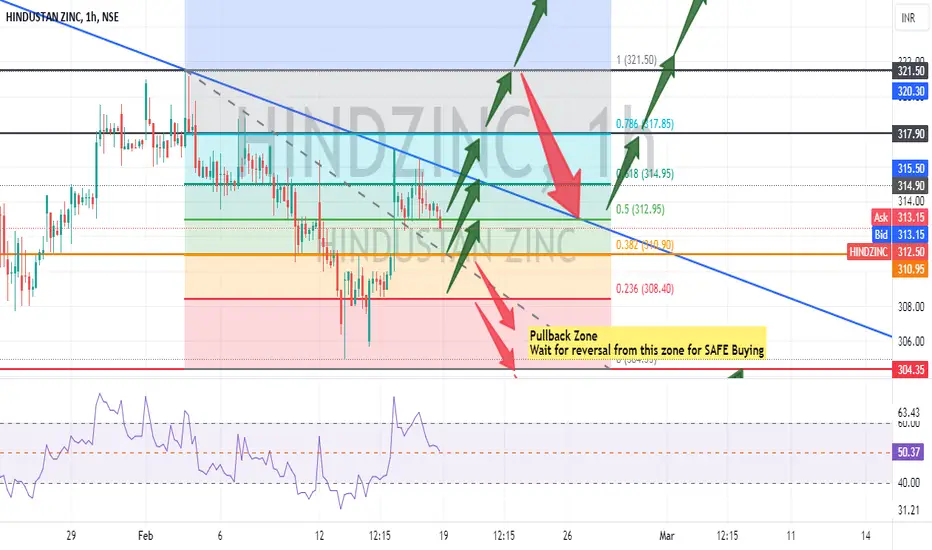
Hindustan Zinc - An Overview About Buy - Sell or HoldBased on the chart and technical analysis done by ForexTrader4all, here are some potential support and resistance levels for HINDZINC:
Support:
308.40: This level is a horizontal support line that the stock price has bounced off of twice in the past year.
312.50: This is the level of the stock's low on February 17, 2024.
314.90: This level is a horizontal support line that the stock price has bounced off of three times in the past year.
Resistance:
317.90: This level is a horizontal resistance line that the stock price has tested but failed to break through twice in the past year.
321.50: This level is the high that the stock reached on January 19, 2024.
It is important to note that support and resistance levels are not guaranteed to hold. The stock price could break through either of these levels in the future.
Do your own research before buying this stock because this is my personal opinion and I am NOT SEBI registered
I am overall BULLISH in this stock
Thanks for your support at always
#HINDUSTAN ZINC #HINDZINC"Record annual silver & metal production with strong cost resilience amidst lower zinc prices;
PAT at INR 7,759 Crore."
Key Highlights :
Hindustan Zinc is now the 3'd largest silver producer globally, with highest silver annual
production, up 5% y-o-y
Holds 2nd largest zinc reserves and resources globally
Industry leading production growth rate with best-ever annual metal production
Highest-ever quarterly refined metal production for 04 FY24, up 6% sequentially
1st decile of the global zinc mines cost curve; lowest annual COP in last 3 years at US$
1,117/MT
Quarterly Revenue up by 3% and EBITDA up by 2%
Ranked first globally in S&P Sustainability Assessment in Metals and Mining sector
Hindzinc: Silver shining?formed the most explosive pattern ever the high tight flag, need to close above 440 to confirm the BO but we may want it to consolidate at least 2 or 3 weeks more before it Breaks-out, it will form a proper base and confirm the strength of BO. It may easily double from here is this goes well!
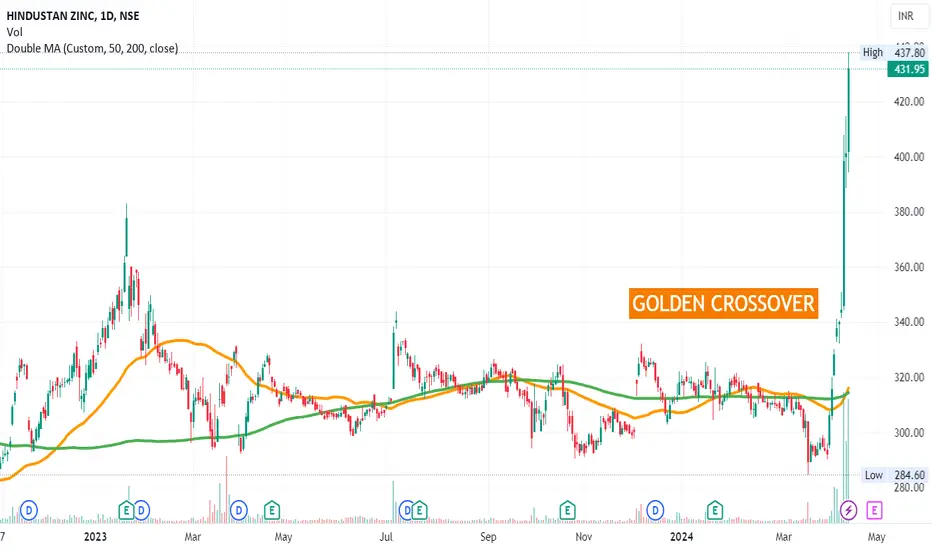
Golden Crossover - HINDZINC📊 Script: HINDZINC
📊 Sector: Non Ferrous Metals
📊 Industry: Mining / Minerals / Metals
Key highlights: 💡⚡
📈 Golden Crossovers are seen into the Script.
📈 Golden Crossover is where slow moving average line crosses fast moving average above.
📈 Although Script is trading at All Time High we may see some bullish rally.
⏱️ C.M.P 📑💰- 431
⚠️ Important: Always maintain your Risk & Reward Ratio.
✅Like and follow to never miss a new idea!✅
Disclaimer: I am not SEBI Registered Advisor. My posts are purely for training and educational purposes.
Eat🍜 Sleep😴 TradingView📈 Repeat 🔁
Happy learning with trading. Cheers!🥂
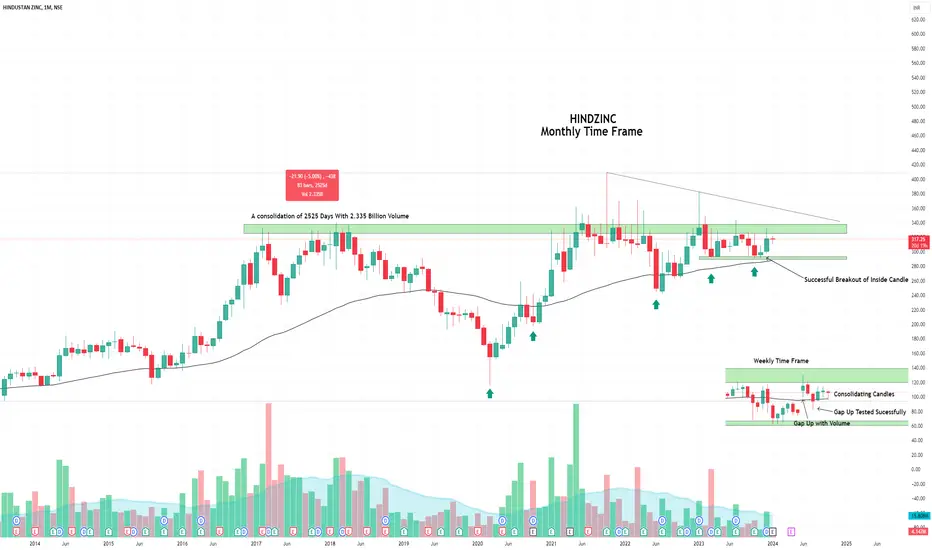
HINDZINC, A consolidation of 2525 Days with 2.335 Billion VolumeHindzinc is successfully testing its lows with a gap up strength move on Weekly time frame and successfully testing the lows. It has given the inside candle breakout on monthly time frame too.
The stock looks to break the highs and I will look for a preferable entry.
CMP- 317.25/-
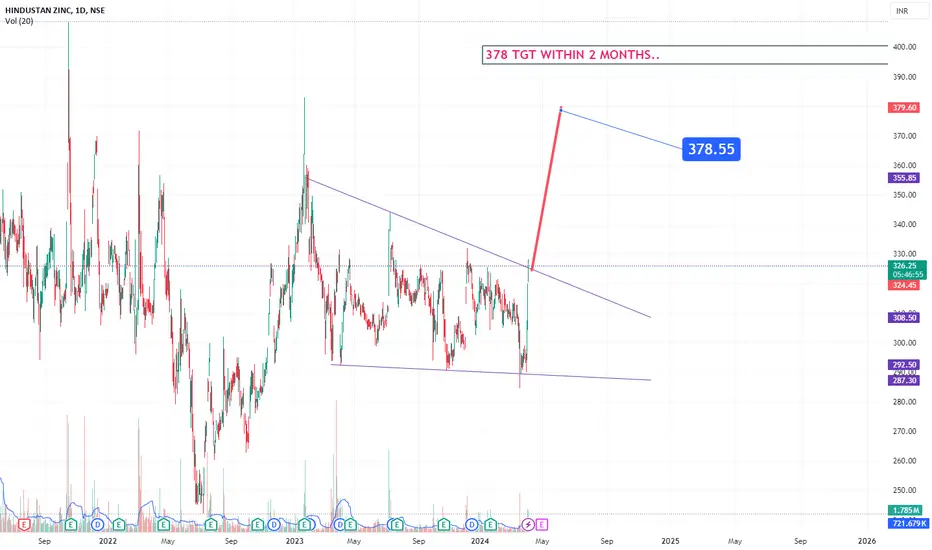
HINDZINC....BuyGave a breakout..IS giving a breakout as we speak...so buy...to the 378 Tgt calculated as per triangle patttern....Traders do keep a stop of the candle low...
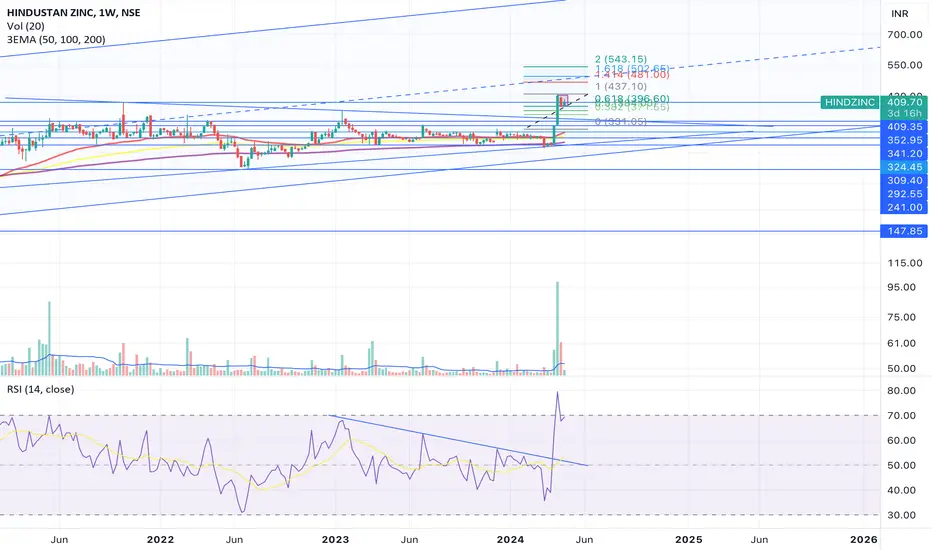
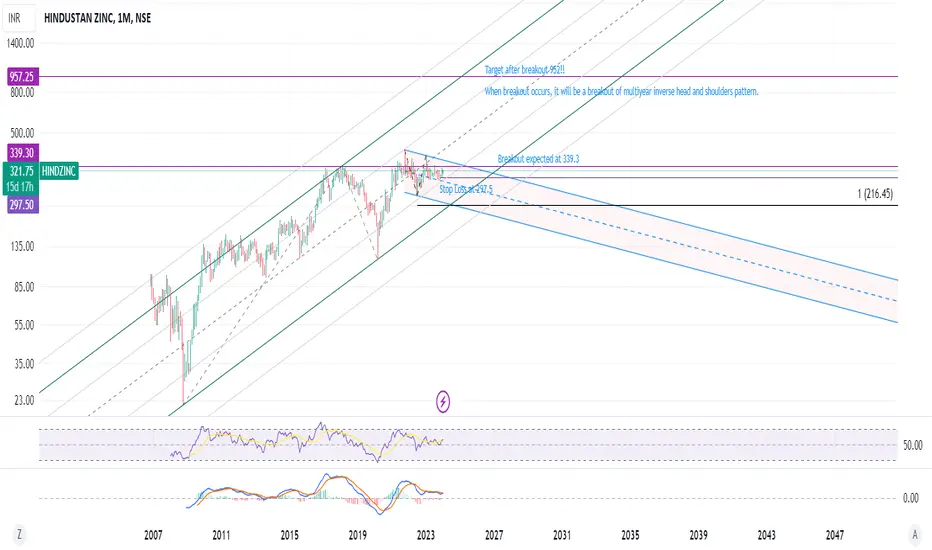
Hindustan Zinc: 3X possible after breakoutHindustan Zinc is setting up for a breakout of a multi year inverse head and shoulders pattern!!
When price breaks out up of 339.3 on a monthly closing basis; anticipate an accelerated upward move which can go as high as 952. Stop loss can be set at 297.5. If stop loss hits, anticipate one more swing low to 216 levels before stock resumes uptrend.
Stock also has a history of providing healthy dividends; stock is in a long term uptrend!
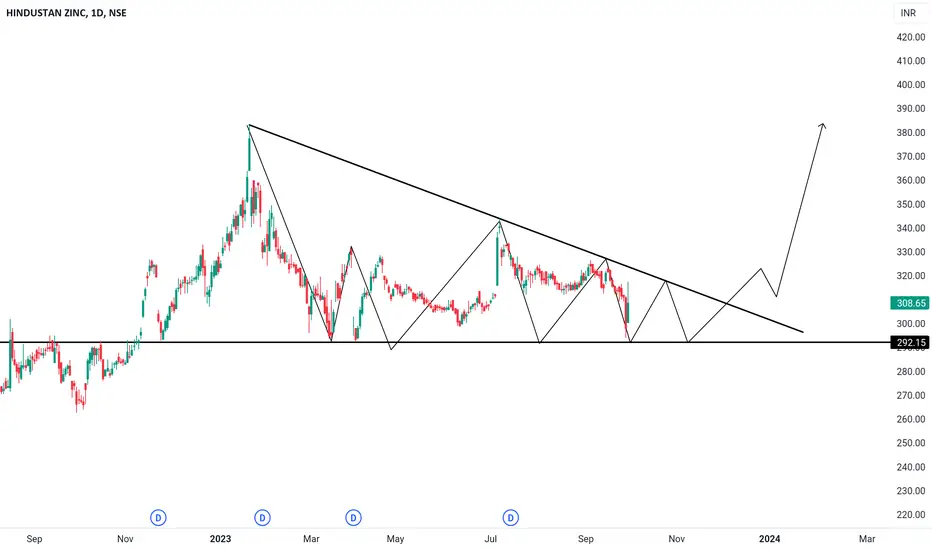
Hindustan zinc near breakout Descending traingle pattern
Buy after breakout
For tip
I m dealing with
1.positional trade
2.swing trade
3.intraday trade
Note- don't deal in F&O
Feel free to contact 82696 13561
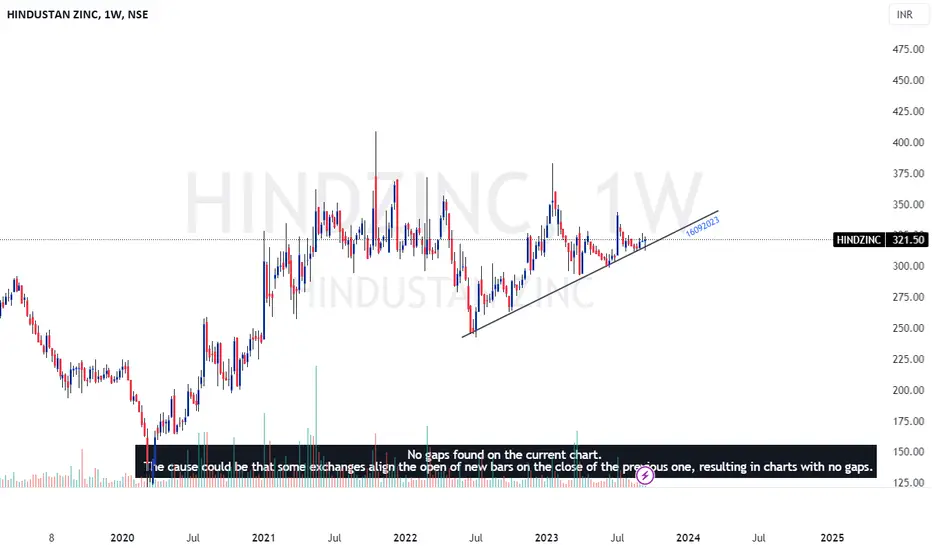
Hindustan Zinc1) Multiple Inside Bars formed from 1st week of July
2) Bouncing from Trendline (which was formed over 66 weeks)
3) Stop Loss could be around 3.5% to 5%
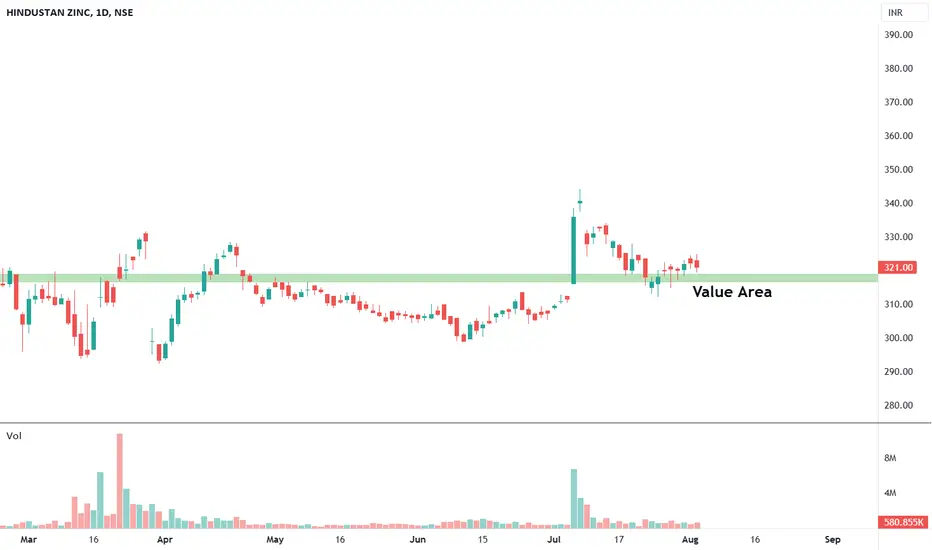
HINDZINC viewsThis script is being observed trading consistently above value area from 26th July 23.
It will be worth to observe this script for study purposes hereafter.
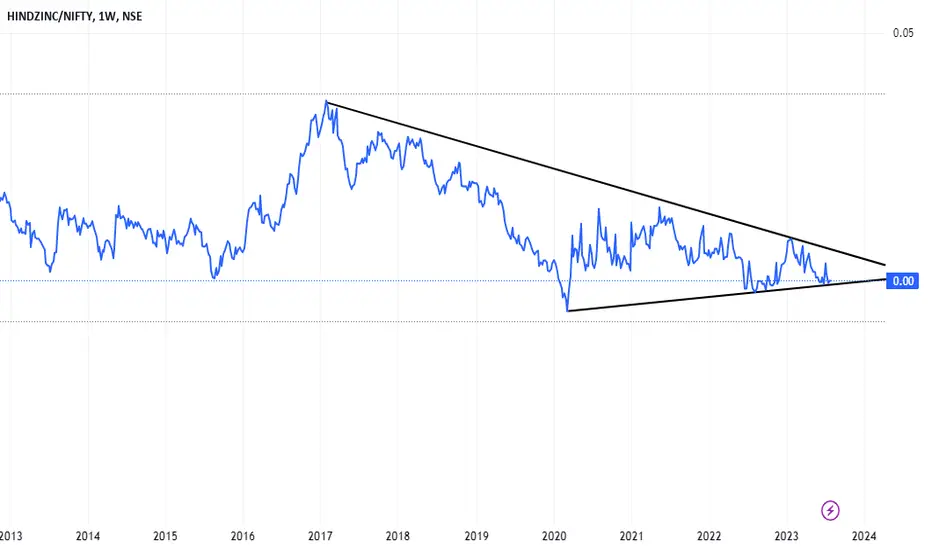
HINDZINCIt is at support level in ratio chart and here risk reward is much favorable. So long can be considered here with small SL
Breakout Possible Stock! #HINDZINCBreakout Possible Stock!
Hindustan Zinc Ltd. #HINDZINC
1- Rising above Volume Profile
2- MACD Positive Crossover
3- High Weekly Volumes
Note: Technical Analysis is for Educational Purpose. I am not SEBI registered. Consult your financial advisor for any Investment Advice.
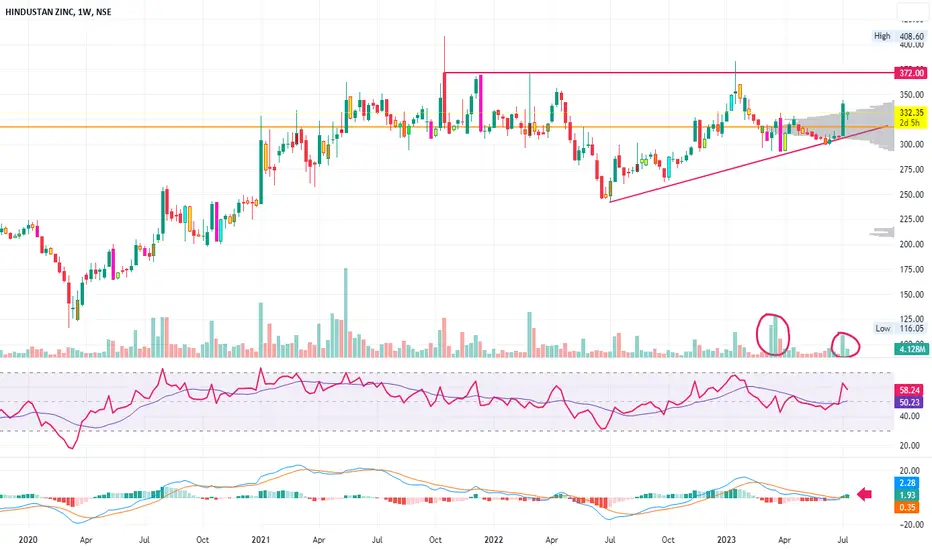
HINDZINC is ready for breakoutHINDZINC above 335 can give breakout towards 360 372 zone
With SILVER and COPPER price rising there could be some action in #HINDZINC