HINDZINC trade ideas
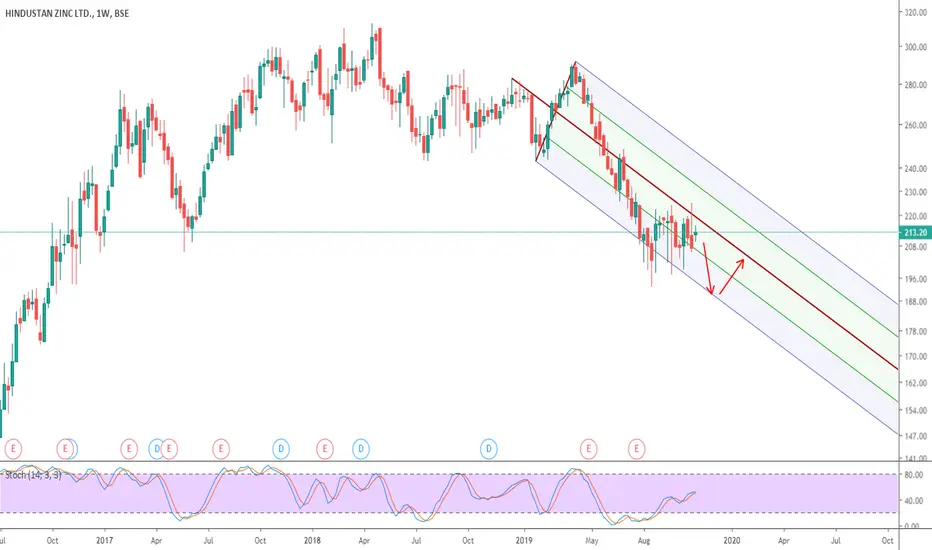
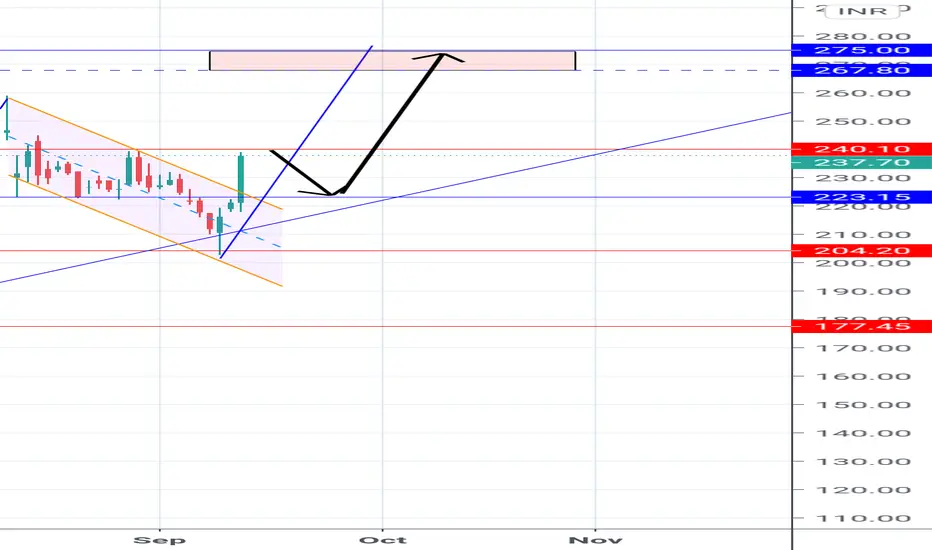
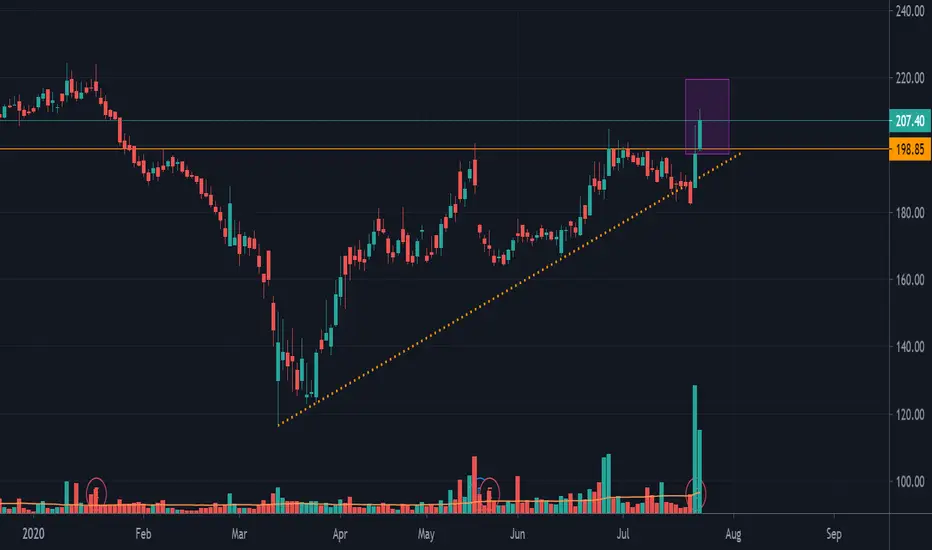
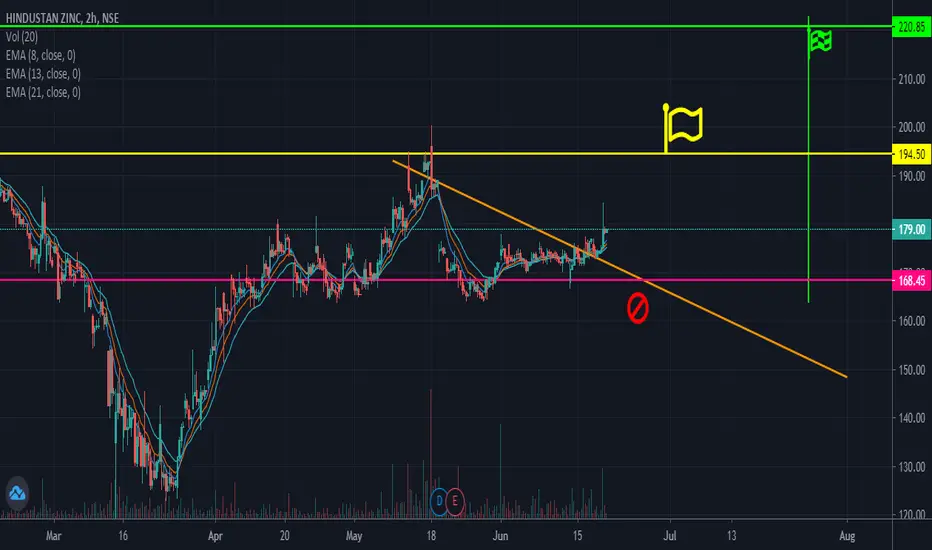
LONGTechnically we can see it is following the Trendline and a flag pattern is formed and the targets are yet to reach soon. So my expected Target as of now is 265 Range.
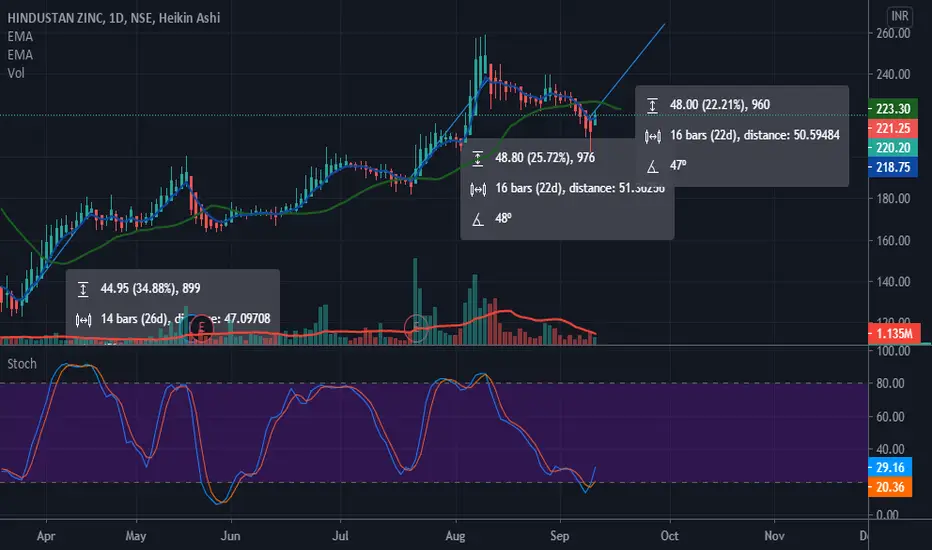
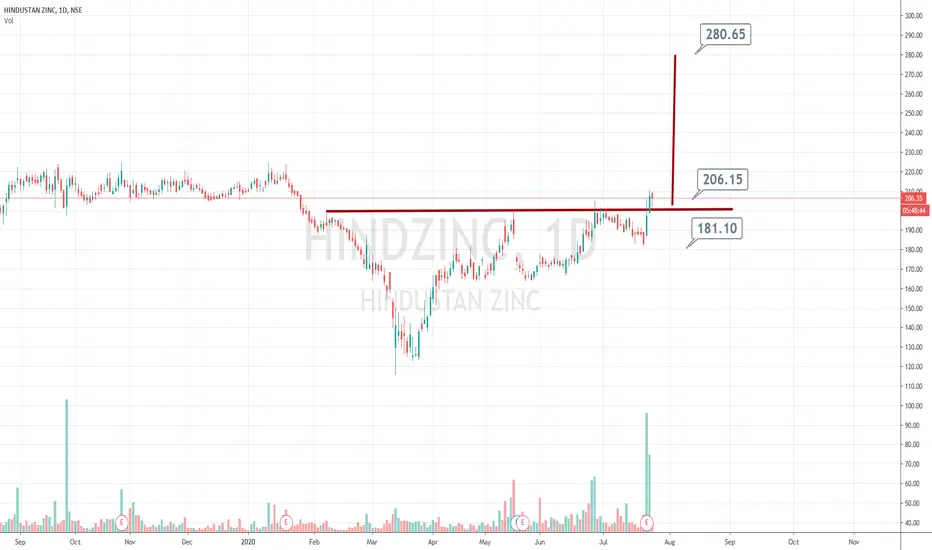
Hindustan zinc all set for big move (For my study purpose)Hindustan zinc all set for big move (For my study purpose)
SL at your own risk
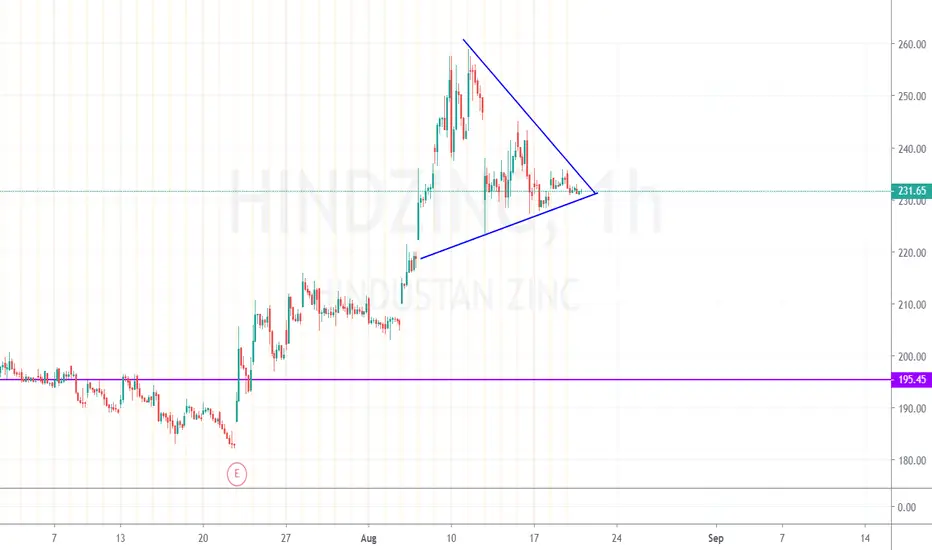
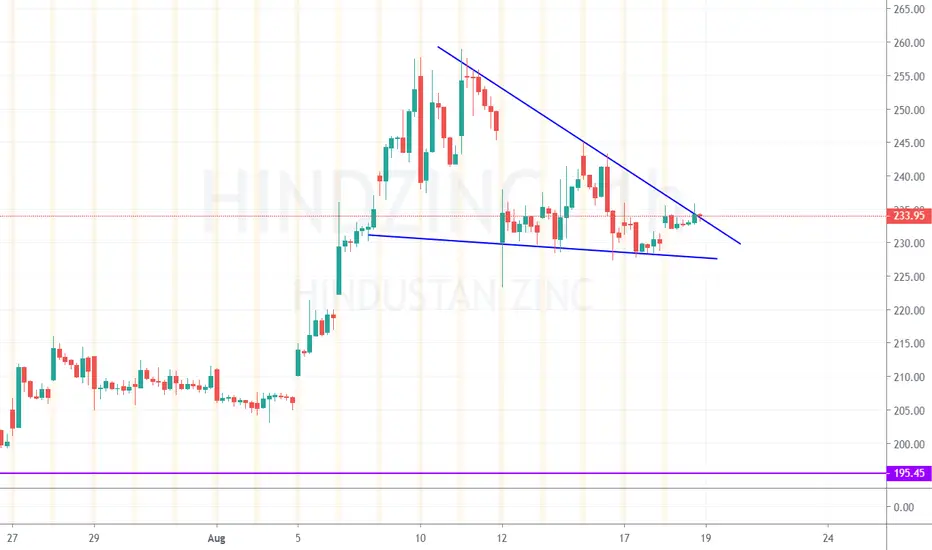
hindzinc trading in Sm triangle wait for break outhindzinc trading in Sm triangle wait for break out
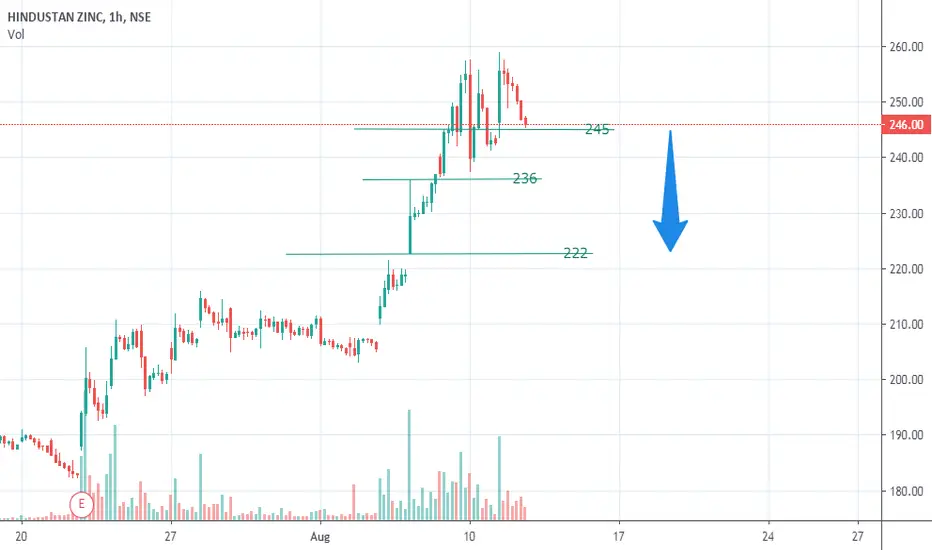
HIND ZINCTHE WAY SILVER HAS FALLEN, THIS MIGHT HAVE A JOYRIDE ON DOWNSIDE, IF HOLDING THIS, BE CAUTIOUS.
LEVELS ARE UPDATED ON CHARTS
******************************************************************************************************************************************************************
Hi all,
Its pleasure to have you all here.
I have started putting these charts as a contribution from my side to all people who are new to business, as I had to struggle a lot without any sources at disposal. So please consider this a just small contribution from my side.
Few Honest Disclosures:
1. Any idea shared is my personal view, its not a recommendation, neither any kind of paid propaganda, so please
do your bit of research.
2. Ideas shared does not mean that I trade all or have position in them, this is just a helping hand to all.
3. I expect no comments or like nor any negativity, as I said its just a small helping hand from my side, please plan your risk and trade as per your capacity.
4. To trade in Cash, options or futures is your sole choice and your own risk
5. I am no expert in Tech Indicators, I believe in support resistance and trendline theory, you may use this as a supplement theory for better results.
6. I work for my own living, this is a hobby which I do sincerely to help anyone who might come across my charts.
***********************************************************************************************************************************************
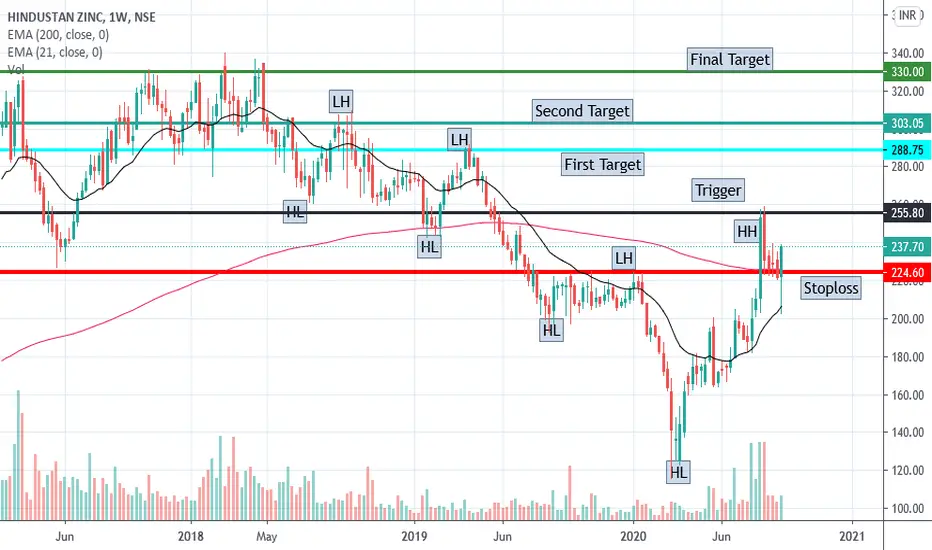
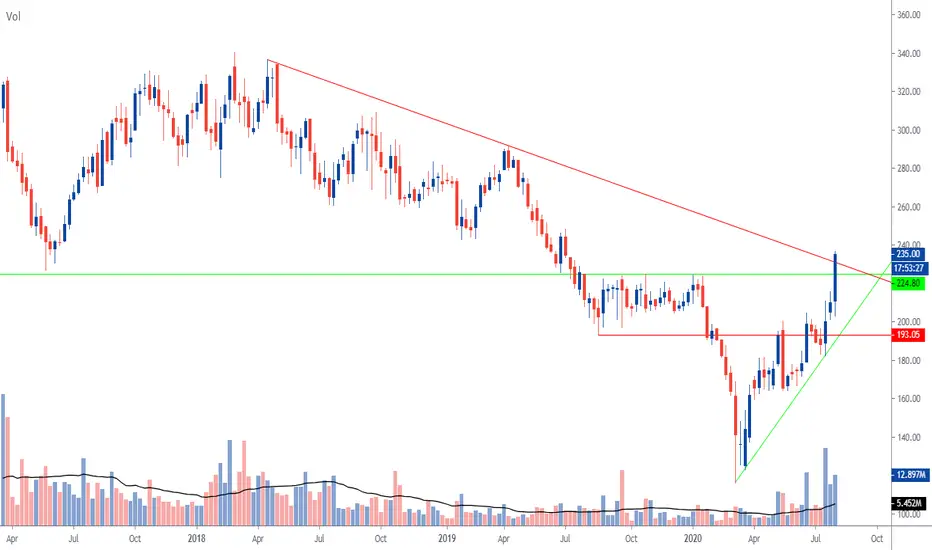
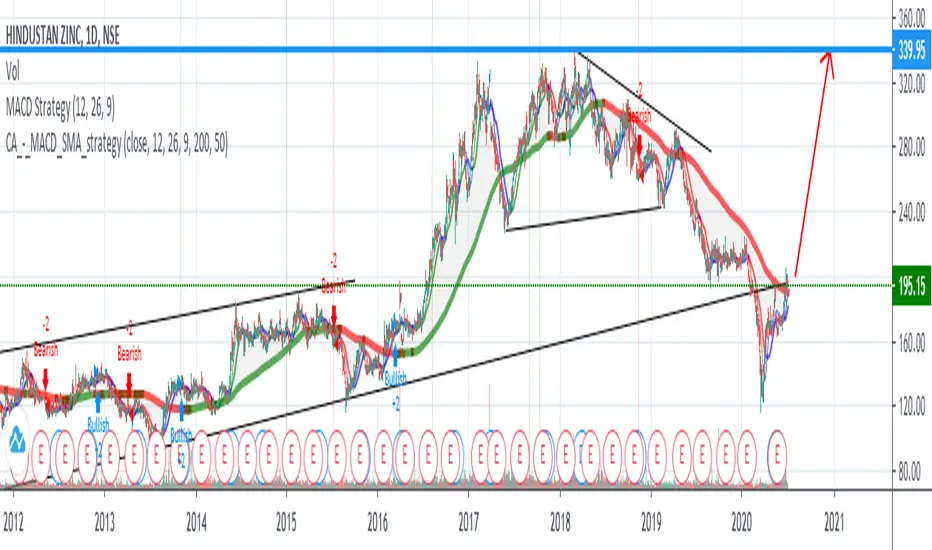
HINDZINC breaks two and half year downtrendHINDZINC which was trading in downtrend from April 2018 has broken the trend line with good volumes.
Also it coincides with short term resistance level at 225.
One can look to go long in HINDZINC with Stop loss of below 193.
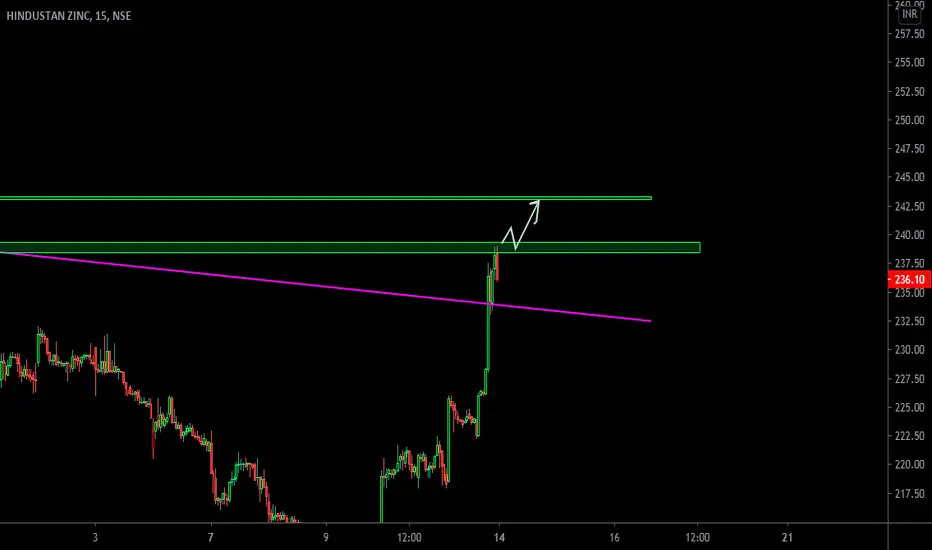
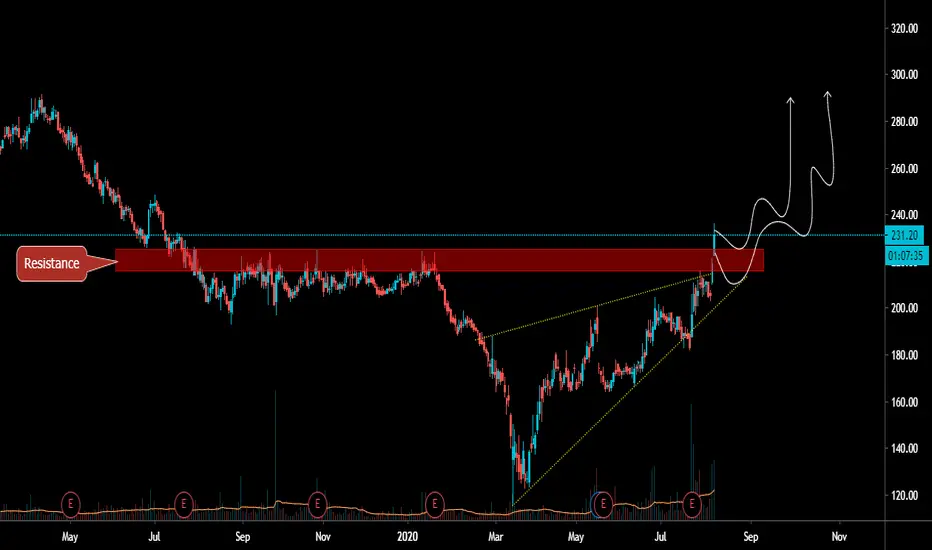
Hind Zinc Above Resistance price above resistance and and looks good now .
we will enter at the retest of the zone.
no need to panic when price is settle in the support zone. we may see some wick down so we will add some at the support of trend line (yellow line)
Buy : 210 - 220
Stop : 170
Target : 250 , 270 , 290 , 350

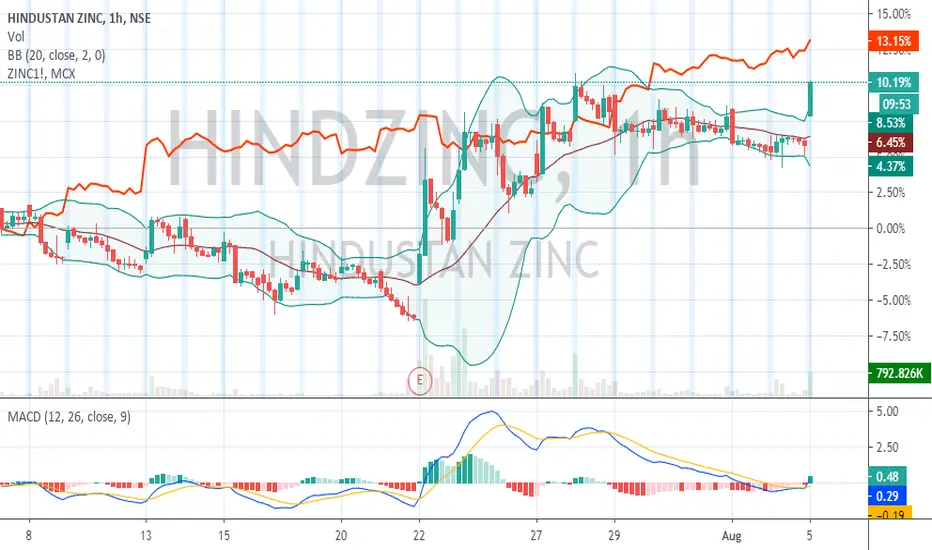
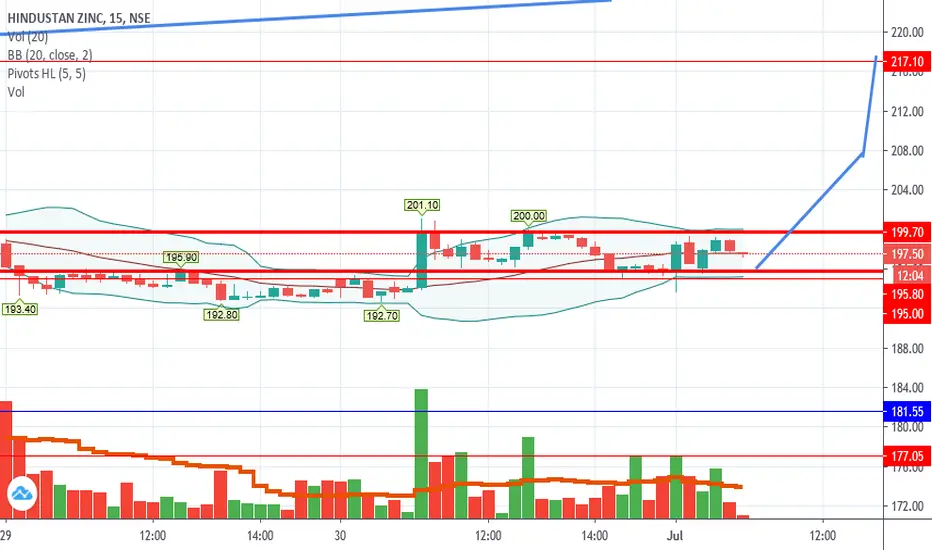
Price of ZINC moving up- HINDUSTAN ZINC in FocusZinc is showing some positive upside action and it may go
So if Zinc moves up then we can see target of Hindustan Zinc from 226-230 Levels In coming days with a Sl of 203
Hindustan zinc also broke bollinger band in 1 hour chart which is a sign of bullishness
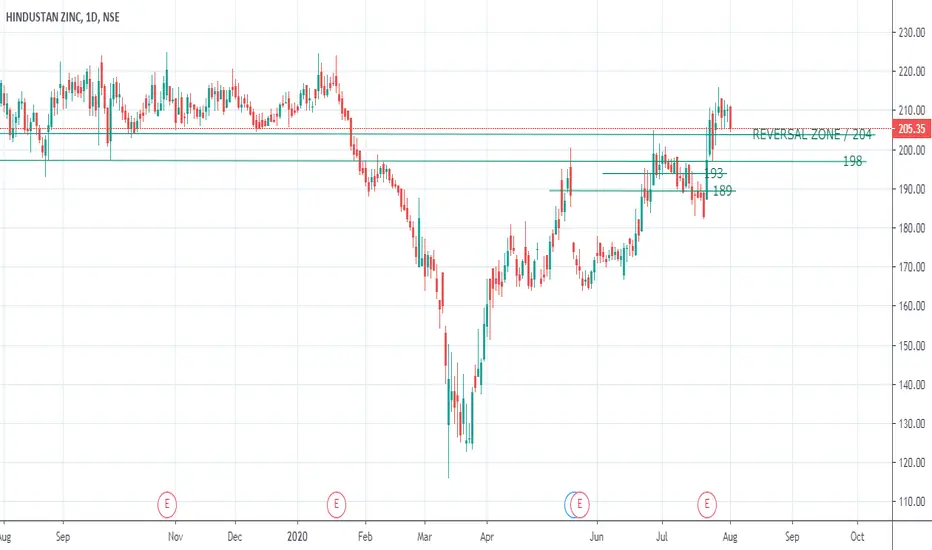
HINDUSTAN ZINCNSE:HINDZINC
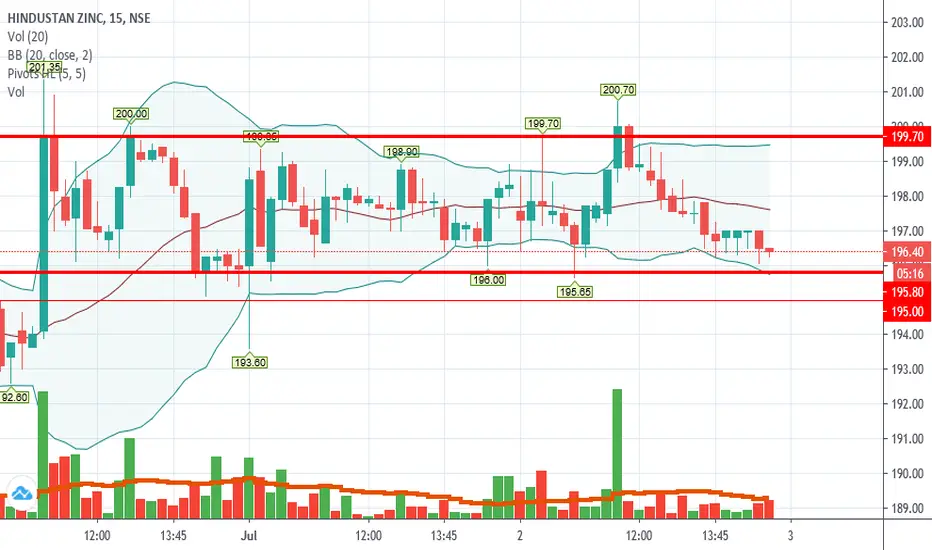
FROM CHART ITS VISIBLE THAT 204 LEVELS SEEMS TO BE SUPPORT
IF BROKEN, CAN TEST 198, 193 AND 188
ON UPSIDE IT CAN TEST RECENT SWING HIGH OF 215
******************************************************************************************************************************************************************
Hi all,
Its pleasure to have you all here.
I have started putting these charts as a contribution from my side to all people who are new to business, as I had to struggle a lot without any sources at disposal. So please consider this a just small contribution from my side.
Few Honest Disclosures:
1. Any idea shared is my personal view, its not a recommendation, neither any kind of paid propaganda, so please
do your bit of research.
2. Ideas shared does not mean that I trade all or have position in them, this is just a helping hand to all.
3. I expect no comments or like nor any negativity, as I said its just a small helping hand from my side, please plan your risk and trade as per your capacity.
4. To trade in Cash, options or futures is your sole choice and your own risk
5. I am no expert in Tech Indicators, I believe in support resistance and trendline theory, you may use this as a supplement theory for better results.
6. I work for my own living, this is a hobby which I do sincerely to help anyone who might come across my charts.
***********************************************************************************************************************************************
HINDZINCIn this chart, Hindustan zinc faceing a resistanace on daily n weekly chart....if the stock cross the line and settle above the resistance ...then buy immidately for a long position ...with a target of - 250-260.
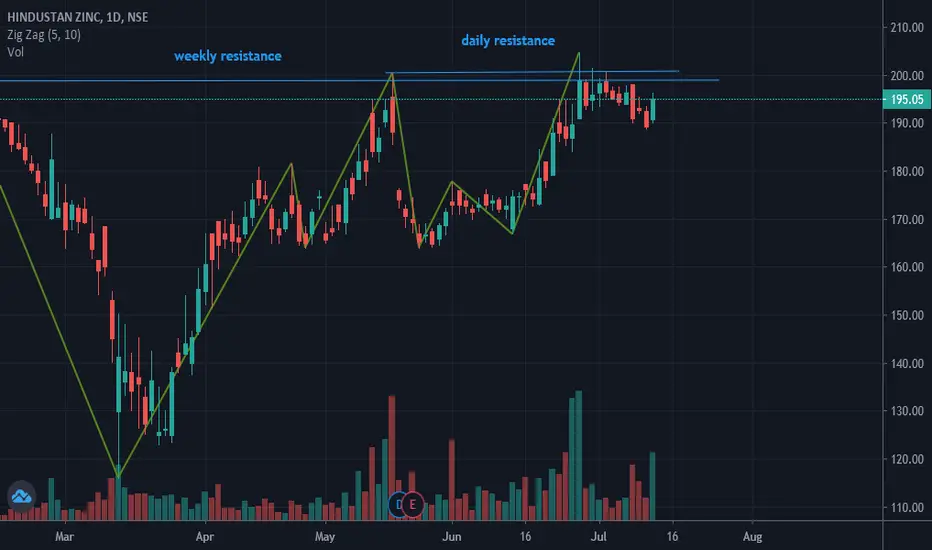
#HINDZINC #BANKNIFTY #NIFTY #NSE #BSE #TRADING #COVID19 #METALS #HINDZINC
HINDZINC
CMP: 178.45
Target 1: 195
Target 2: 221
SL: 169
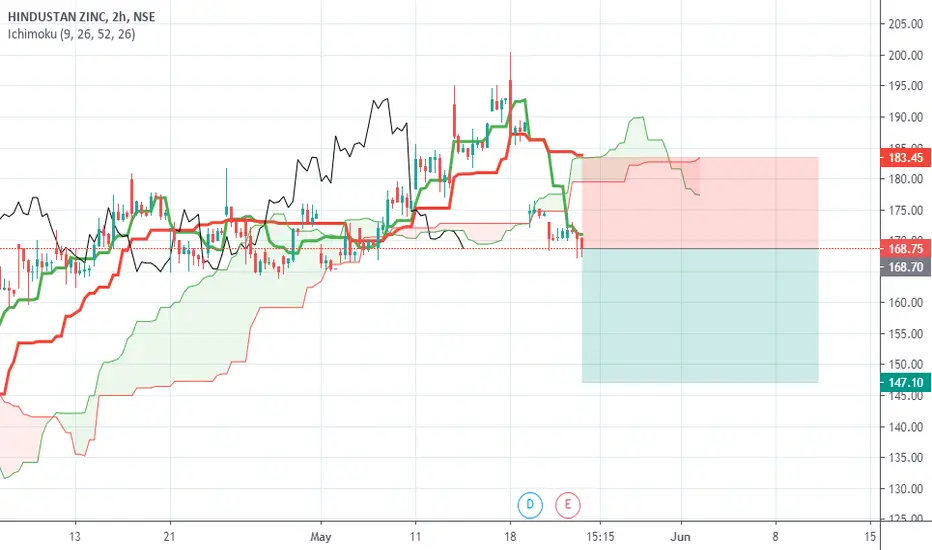
HINDZINC Short position Based on Resistance Support formation HINDZINC Short position Based on Resistance Support formation Stop loss & Target provided in Chart
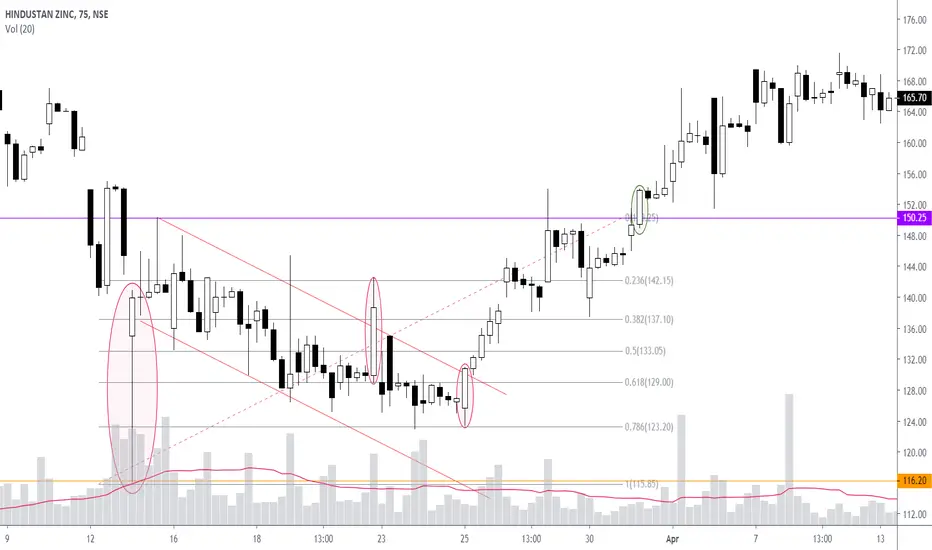
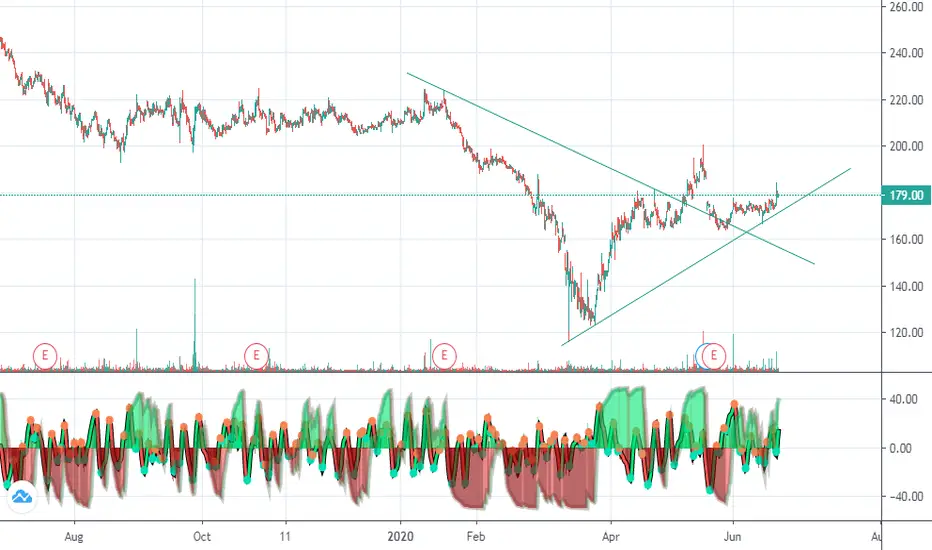
HOW CANDLESTICKS CAN HINT A BOTTOM - ANALYSIS!**NOT A RECOMMENDATION TO BUY**
A single candle by itself is rarely sufficient reason to forecast an immediate reversal. It could, however, be one clue that the prior trend may
be changing. HERE in this chart a Hammer that formed after an extended sell off hinted sth is cooking for the HINDZINC stock as the bears tried to push the stock lower after a large hammer is formed ,bulls defended and came out successfully holding the bottom that was tested by hammer , In Japanese terms hammer implies to market to be testing the depth of the water! Long white candlestick (BULLISH) on a higher timeframe neat the bottom range of the established hammer showed that bulls are coming back in force to absorb all the selling force and successfully defended as shown in the chart of Hindusthan Zinc .
Small body candles denoting high wave,inverted hammer and spinning tops with high volume sessions indicated the accumulation of the stock while the prices went to test the hammer!
all the above factors combined with a trendline break and the prices failing to reach the lower end of the channel showed that a rally is to be expected & on the break of resistance zone 150.2 and it did breakout with a strong white candle showed an BUY oppurtunity!
price's holding with volume and long shadow with smaller bodies after appearance of hammer all signified the bulls are taking charge through accumulation on reaction to the hammer signified a wothwhile watch!
this can provide a meaningful insight for future analysis in a different stock and sector is the essence behind sharing this analysis!though it is past it can repeat in some other scrip so that there shows a valuable signal to BUY!