Indus – will it still tower?Although the news about SupremeCourt rejecting plea of Vodafone & Indus Towers on AGR hits the market sentiments, which apparently takes the equation of getting back the dues from Vodafone to Indus further far.
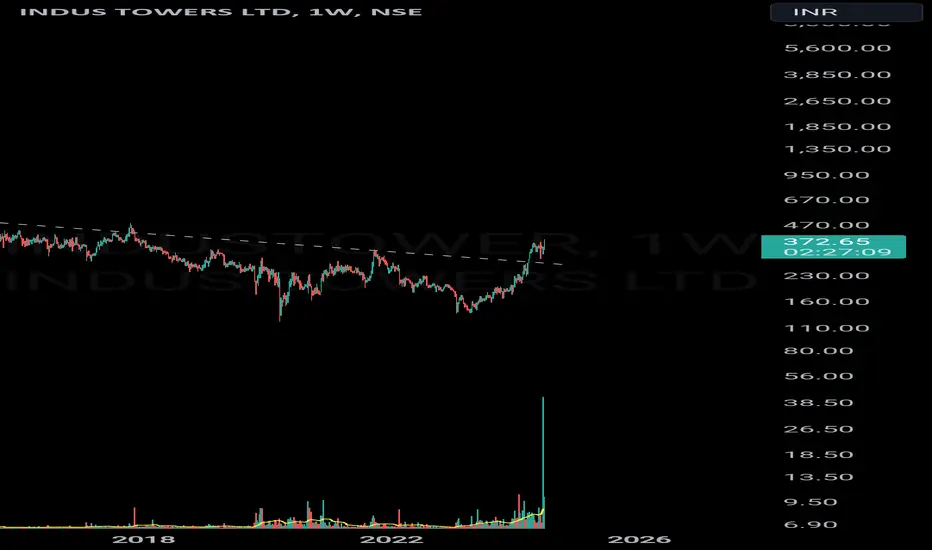
Technically looking -- the chart on weekly timeframe shows its a clear retest of Triangle Pattern breakout.
The fundamentals of the Company are still intact.
Airtel will be parent.
New circumstances and New avenues.
Among all these ~20% price correction seems Good Opportunity.
Is it Fresh Entry Point for someone looking the chart NOW!
It has psychological barrier ₹500 to TAKE ON. What things would support it going forward?
Will be interesting to see...
INDUSTOWER trade ideas

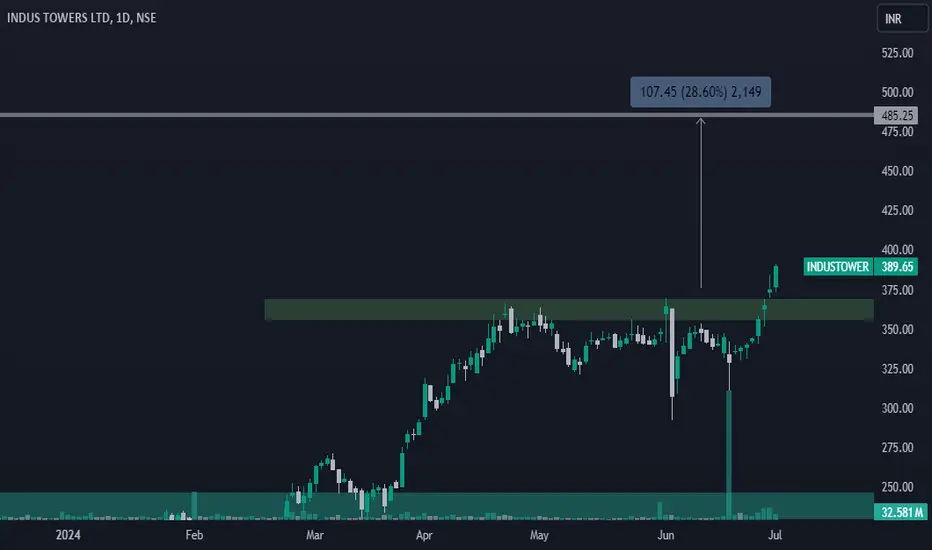
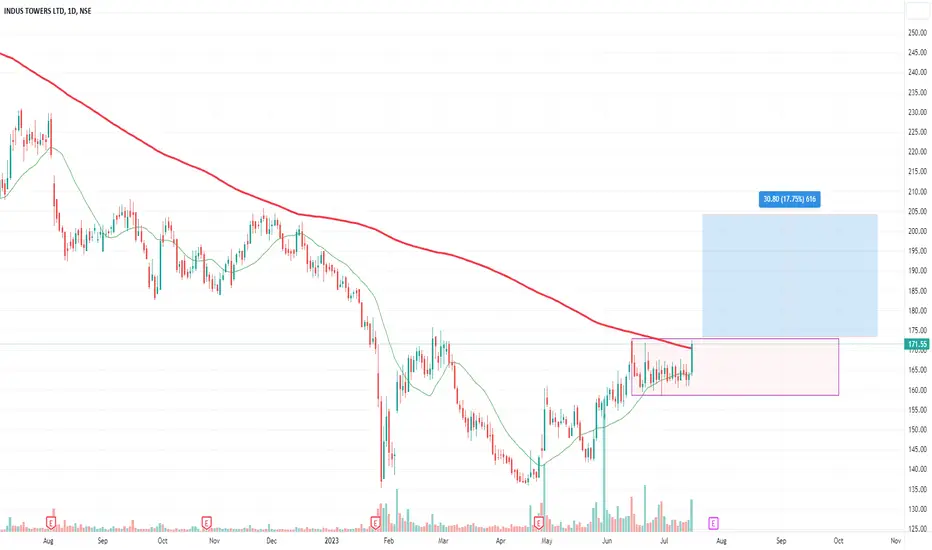
INDUSTOWER 1DAYIndusTower might take a break in this area.
I'm not a SEBI-registered analyst. All posts and levels shared are just for educational purposes. I'm not responsible for any losses or profits. No claims, all rights reserved.

INDUS TOWER long RR 1:3Indus tower
Current Price :
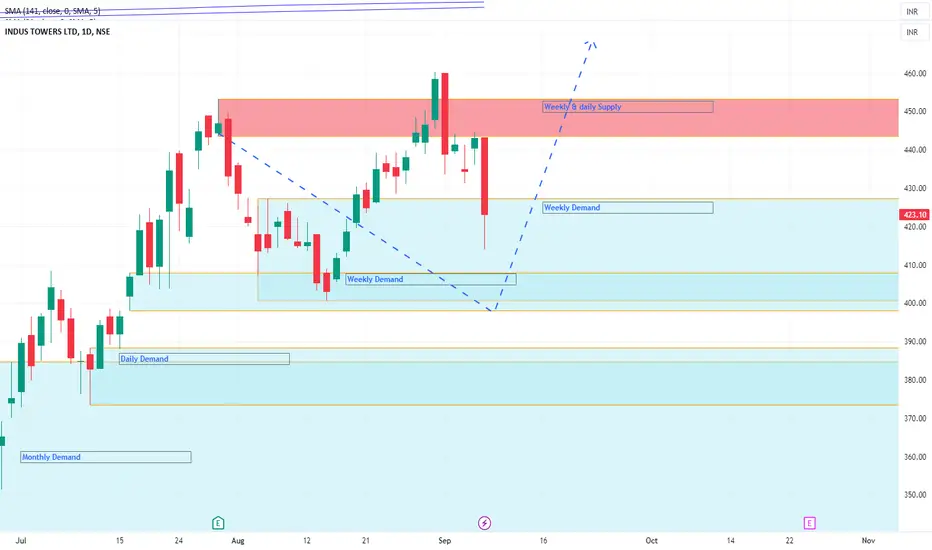
Indus Tower Daily Supply 444
Indus Tower Weekly Supply
MTF Analysis
Indus Tower Yearly DMIP 203
Indus Tower 6 Month Breakout 335
Indus Tower Qtrly Rally 295
Indus Tower Monthly Demand BUFL 385
Indus Tower Weekly DMIP 427
Indus Tower Weekly BUFL 408
Indus Tower Daily DMIP 388
ENTRY 408
SL 373
Target 512
Last High 460
RR 2.97
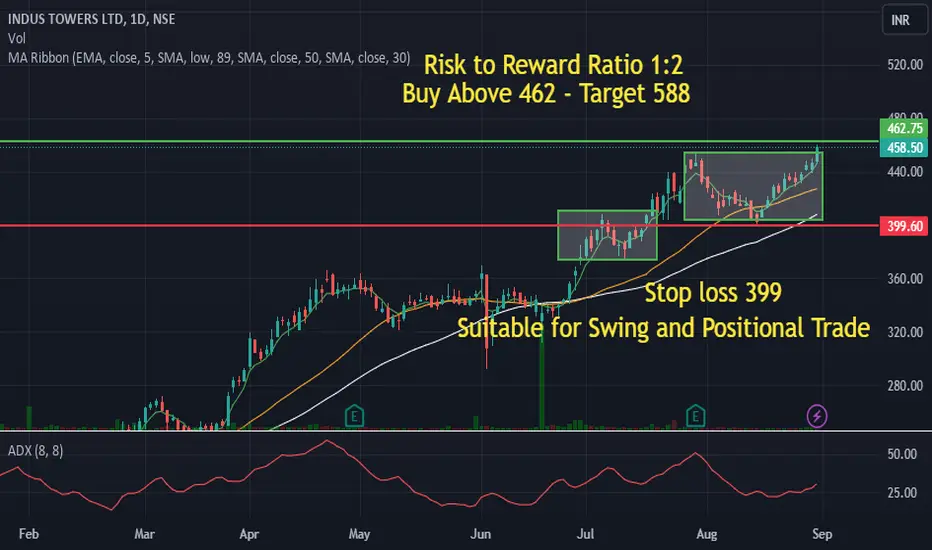
Darvas Box Strategy - Breakout Stock - Swing / Positional TradeDisclaimer: I am Not SEBI Registered adviser, please take advise from your financial adviser before investing in any stocks. Idea here shared is for education purpose only.
Stock has given break out. Buy above high. Keep this stock in watch list.
Buy above the High and do not forget to keep stop loss, Suitable for swing trading and also for Positional Trade. Exit if Price Close below 50 SMA.
Target and Stop loss Shown on Chart. Risk to Reward Ratio/ Target Ratio 1:2.
Be Discipline, because discipline is the key to Success in Stock Market.
Trade what you See Not what you Think.
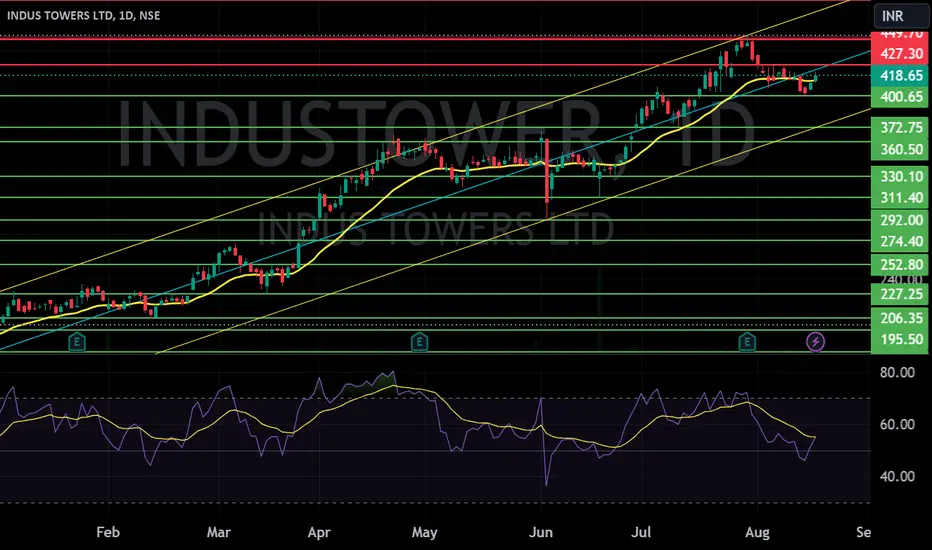
INDUS TOWERS LTD S/RSupport and Resistance Levels:
Support Levels: These are price points (green line/share) where a downward trend may be halted due to a concentration of buying interest. Imagine them as a safety net where buyers step in, preventing further decline.
Resistance Levels: Conversely, resistance levels (red line/shade) are where upward trends might stall due to increased selling interest. They act like a ceiling where sellers come in to push prices down.
Breakouts:
Bullish Breakout: When the price moves above resistance, it often indicates strong buying interest and the potential for a continued uptrend. Traders may view this as a signal to buy or hold.
Bearish Breakout: When the price falls below support, it can signal strong selling interest and the potential for a continued downtrend. Traders might see this as a cue to sell or avoid buying.
20 EMA (Exponential Moving Average):
Above 20 EMA: If the stock price is above the 20 EMA, it suggests a potential uptrend or bullish momentum.
Below 20 EMA: If the stock price is below the 20 EMA, it indicates a potential downtrend or bearish momentum.
Trendline: A trendline is a straight line drawn on a chart to represent the general direction of a data point set.
Uptrend Line: Drawn by connecting the lows in an upward trend. Indicates that the price is moving higher over time. Acts as a support level, where prices tend to bounce upward.
Downtrend Line: Drawn by connecting the highs in a downward trend. Indicates that the price is moving lower over time. It acts as a resistance level, where prices tend to drop.
RSI: RSI readings greater than the 70 level are overbought territory, and RSI readings lower than the 30 level are considered oversold territory.
Combining RSI with Support and Resistance:
Support Level: This is a price level where a stock tends to find buying interest, preventing it from falling further. If RSI is showing an oversold condition (below 30) and the price is near or at a strong support level, it could be a good buy signal.
Resistance Level: This is a price level where a stock tends to find selling interest, preventing it from rising further. If RSI is showing an overbought condition (above 70) and the price is near or at a strong resistance level, it could be a signal to sell or short the asset.
Disclaimer:
I am not a SEBI registered. The information provided here is for learning purposes only and should not be interpreted as financial advice. Consider the broader market context and consult with a qualified financial advisor before making investment decisions.
INDUSTOWER Breakout: Time to JoinINDUSTOWER has shown a strong uptrend since January 2024, recently consolidated, and has now broken out again. This renewed momentum suggests it's an opportune time to join the trend.

INDUS TOWERSINDUS TOWERS has breakout and retest major resistance level then some of consolidation level also breakout TGT up to ATH and this is only for educational purpose
Indus Tower | Super Stock SeriesIndus tower super structure
Looks good for med term to LT.
Good example to study.
This chart is posted to enhance your learning. Do check with your financial advisor before taking any trade.
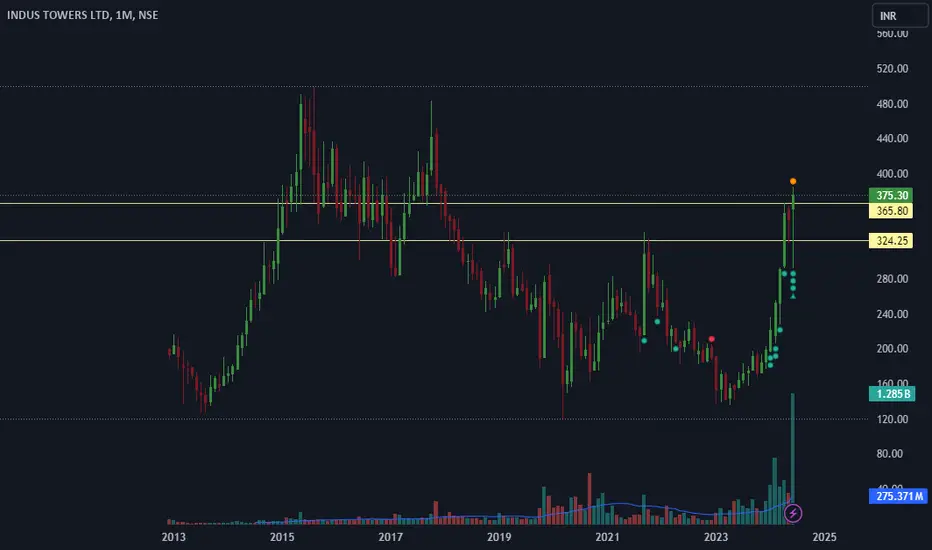
INDUSTOWER 1monthit is a golden opportunity for long term investors
I Am Not SEBI Registered Analyst. All Post and Levels Posting is only for educational and knowledge purpose. I Am not responsible for your any kind of loss or profit.
No Claim, All Rights Reserved.‼️
IndustowerPresently in F&o ban list
Very strong chart
Good Fundamentals
Potential for good results
Presently rising in a channel
Stock price closing Below this channel will result in weak structure whereas above 365 with volume can expect a good rally
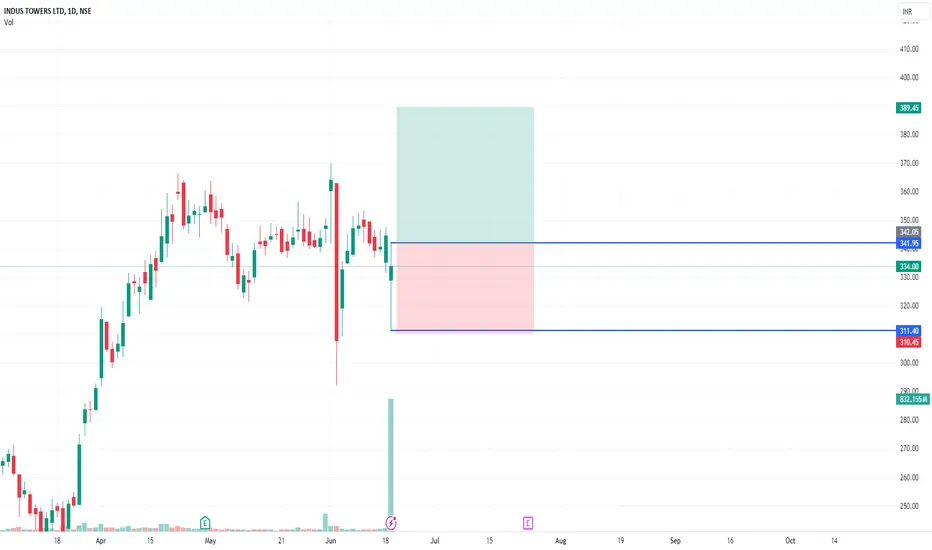
INDUS TOWER LONG/BUYTrade Setup long in Indus Tower
1. Monthly/weekly/Daily TF Bullish
2. Consolidating near a Big Breakout area
3. Block Deal happened b/w 311-340 and low is tested already in 3rd 5 min Candle
4. 2 Bullish Hammers on 5 Min TF & SL is Slightly Big as it is a positional Trade
5. Marked blue is a strong Breakout Level
6. 325-320 is Strong CIP Level
7. Hence Went Long
8. Buy @335-340 SL-310 target 450-470
Fundamentally this company is strong and also the part of rural developing economy alongside, which will benefit India in coming years definitely

swing pick - go long - this stock is picked after market close based on delivery qty data.
- follow this stock for next 5 days , if entry not triggered with in 5 days , ignore pick
- if price crosses today's high , go long
- keep candle low as sl , for tgt keep 1:1.5 Risk Reward
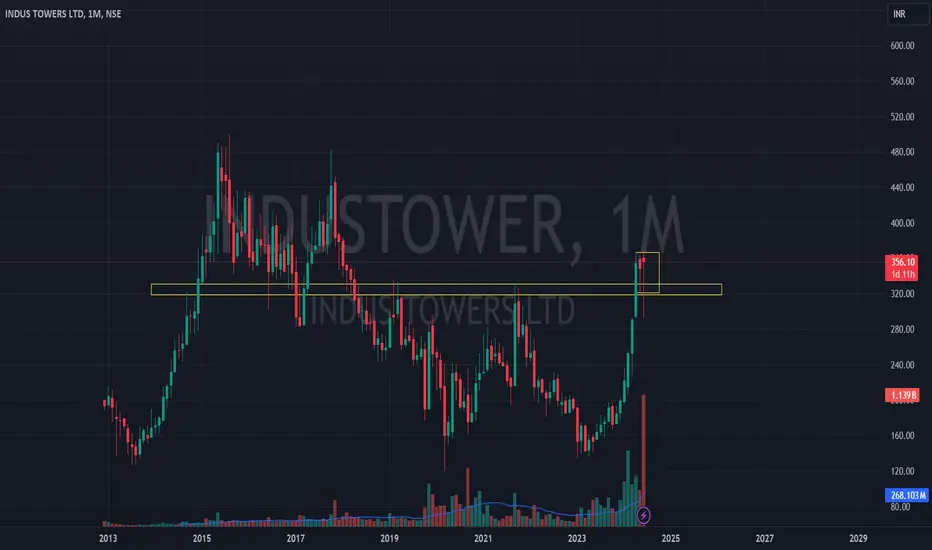
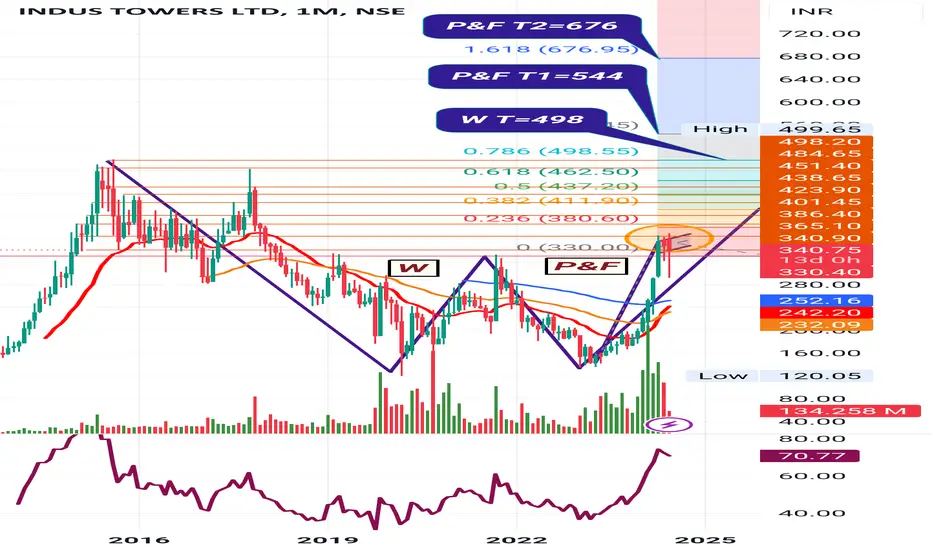
Indus Tower Ltd.*Indus Towers Ltd*
*W* Formation on Yearly Basis.
P&F on Monthly Basis.
Price BreakOut Needed & to be Sustained.
Multiple Resistance Marked.
Strong Vol Consolidation in past few months. Continued Traction required. To be Watched.
RSI: 1H <D<W=M. However, all in Bullish Zone but Hourly TF.
EMAs: Widening Gaps amongst 20/ 50/ 100/ 200 on Weekly TF.
Telecom Sector Picking Up. Rollout of 5G gaining pace.
Vodafone dues payoff will be a huge trigger for re-rating.
*Trail SL with Upside*
*Book Profit as per Risk Appetite*
*Do Your Own Research as well. This is an Opinion*
*_Happy Investing_* 🤓
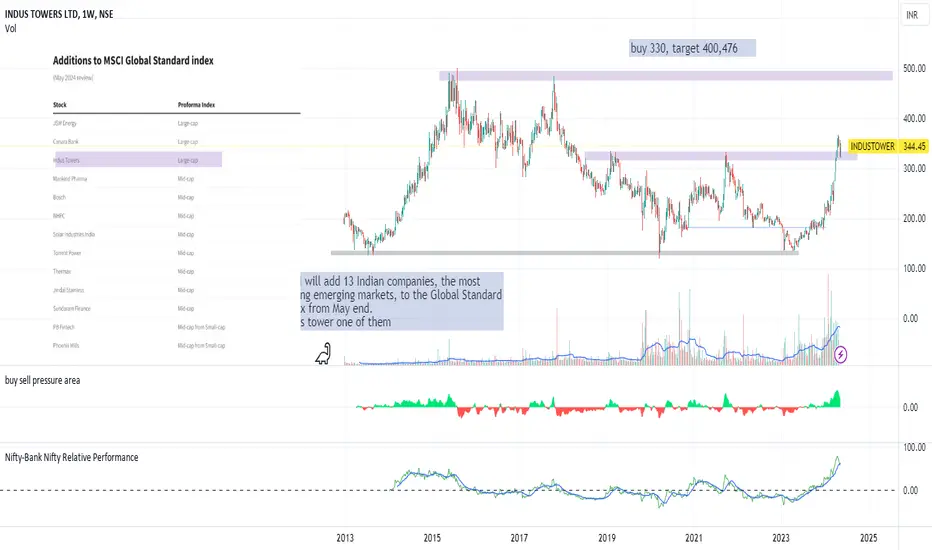
indus towerMSCI will add 13 Indian companies, the most among emerging markets, to the Global Standard Index from May end.
These include JSW Energy , Canara Bank (CNBK.NS), Indus Towers in the large-cap segmen
Indus Tower ready for up move 17 %It seems to be moving upward and will give 17 % 1st target.
With 10% stop loss add more and more.

#Industowers#Industowers Stock is looking good, it is in good uptrend, giving trend line breakout also, once the stock breaks 421 levels on daily closing basis, then it will face resistance near our first target zone 348 and then next resistance near our second target zone 384. Keep a stop loss closing below 300. giving a good risk reward.
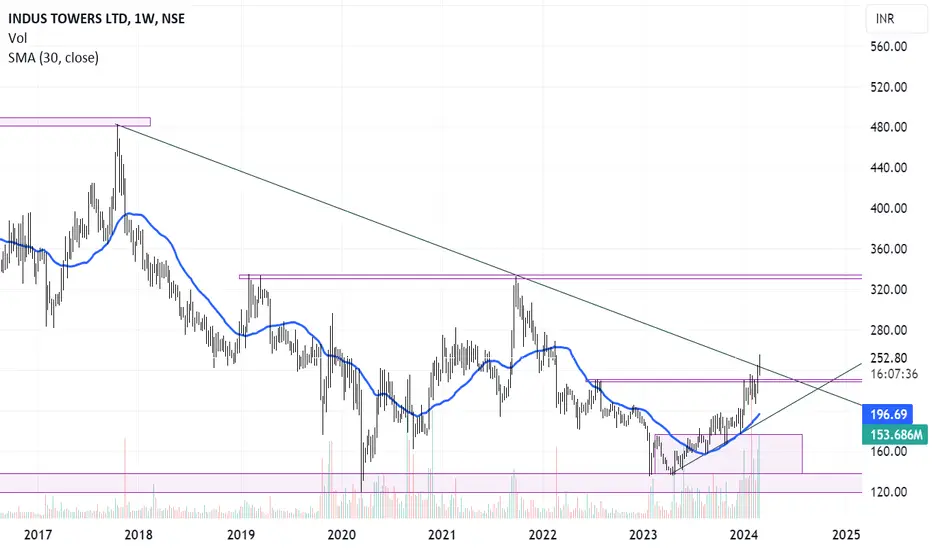
Weekly and monthly breakeout stock or soon to be break outIndus tower stock trades on indian market is going to ready for break out after six years . It is on rounding bottom pattern . On both weekly and monthly it is ready for break out . On both time frame rsi is also on higher side .

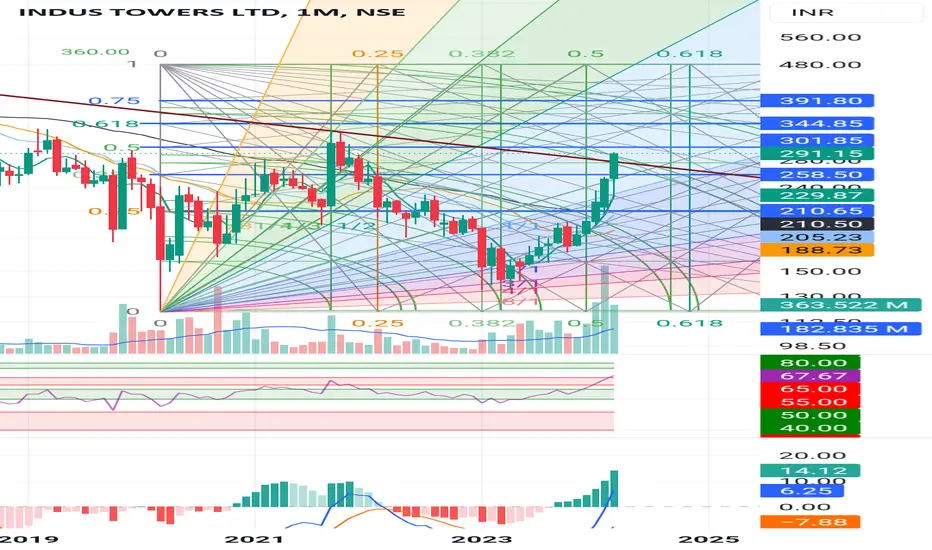
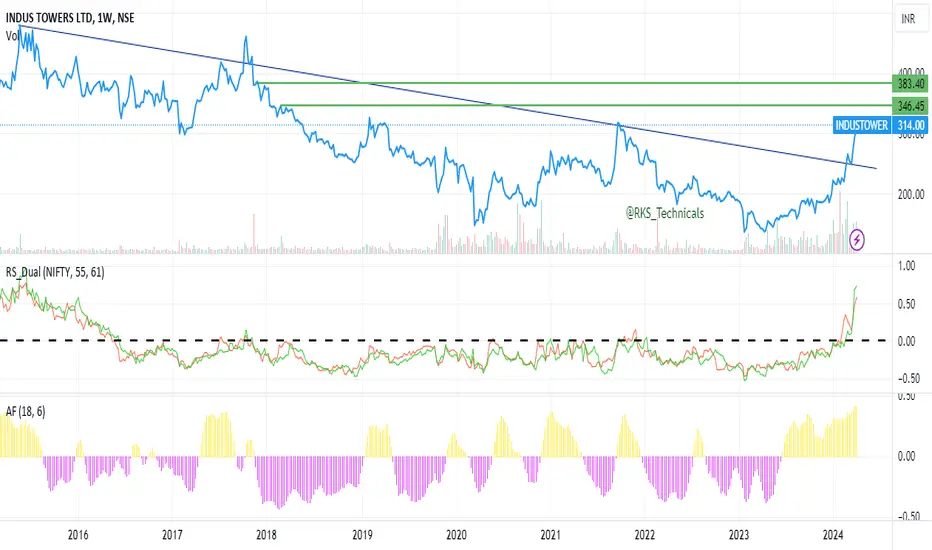
INDUSTOWER Turning Bullish after 2017 Double TopHello Traders,
Let's delve into an analysis of INDUSTOWER today.
In 2017, the stock exhibited a Double Top pattern, resulting in a significant bearish turn and a substantial drop from approximately 470 levels to 145 as of April 2023.
However, a positive turn occurred when a Double Bottom formed at 145 levels in April 2023 (refer to the chart). Subsequently, the stock underwent a consolidation phase, leading to the development of Higher Highs and Lower Lows.
Notably, from the 145 levels, the stock has yielded an impressive 80% return to date.
The encouraging news is that technically, the stock shaped a Descending Triangle pattern since 2017.
This week, a robust breakout occurred, complemented by a breakthrough of its previous resistance, marked by a bullish candle on the weekly chart and substantial volume confirmation.
In essence, we can confidently affirm "BANG ON with Multiple Confirmations."
This signals a distinct bullish trend in the stock, presenting an opportune moment for entry with proper Risk Management. If it maintains levels between 230-250, I strongly believe it could easily ascend to 330 levels within a few weeks.
That's the gist of it, folks.
If you find merit in this idea, your support would be greatly appreciated.
Share your thoughts on INDUSTOWER in the comments below.
Happy Trading. All the best!!
Industower has a breakout out resistanceIndustower has been moving higher after the rumours of telecom policy and finally after the actual policy decision major buying seen with high volumes. We now see a major resistance level breakout today, Buy with targets of 353,432 & 500.
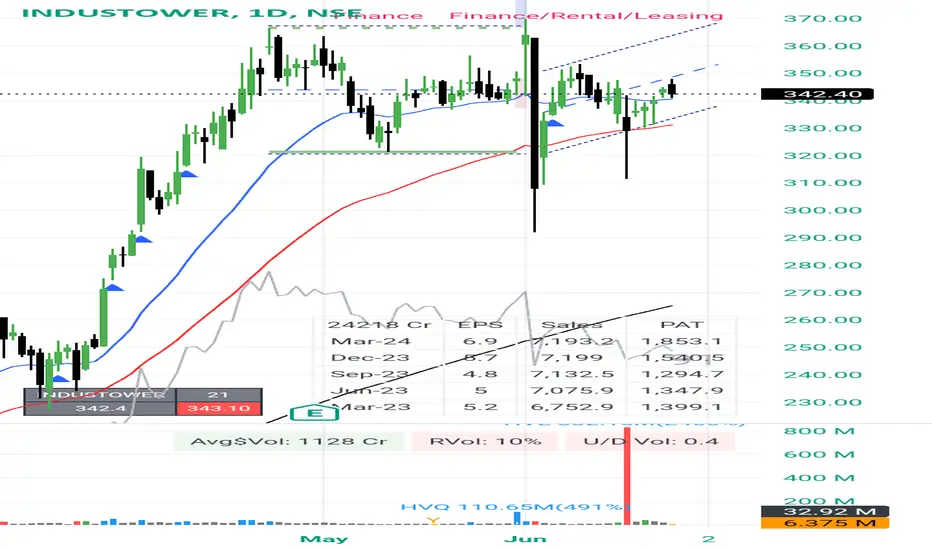
Strong ability to service debt as the company has a low Debt to EBITDA ratio of 0.82 times
Healthy long term growth as Net Sales has grown by an annual rate of 27.65% and Operating profit at 34.04%
With a growth in Net Sales of 4.7%, the company declared Very Positive results in Jun 21
The company has declared positive results for the last 2 consecutive quartersNET SALES(Q) Highest at Rs 6,797.00 crPBDIT(Q) Highest at Rs 3,516.70 cr.PBT LESS OI(Q) Highest at Rs 1,820.10 cr.4
The technical trend has improved from Sideways on 14-Sep-21 and has generated 16.27% returns since then Multiple factors for the stock are Bullish like MACD, Bollinger Band
With its market cap of Rs 73,693 cr, it is the biggest company in the sector and constitutes 60.83% of the entire sector
Its annual Sales of Rs 19,115.90 are 54.63% of the industry.
Industower low debt exposure to telecom and largecap for comfort
If you like the idea, like & subscribe

Indus towersHas given a weekly Gap Up Breakout of the long term trendline
Initial Entry can be taken now and more positions can be added above 301