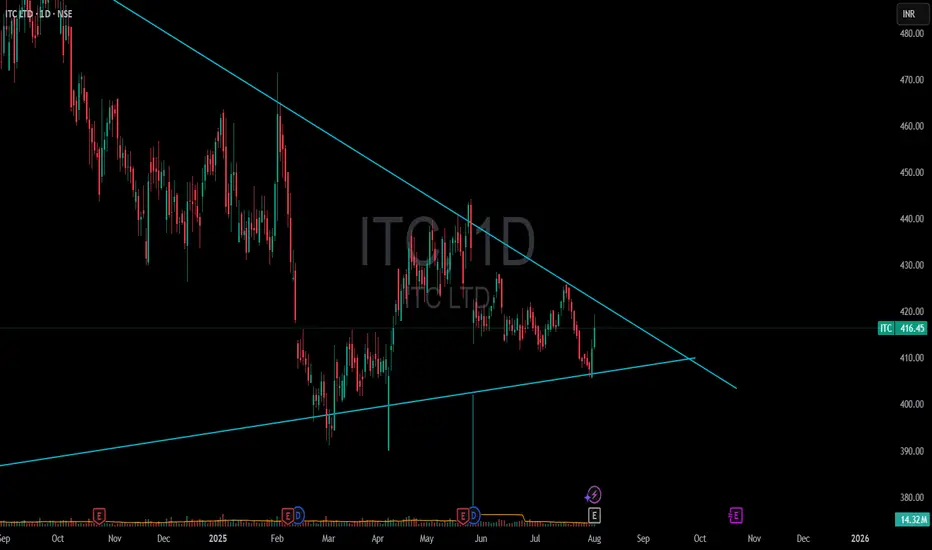
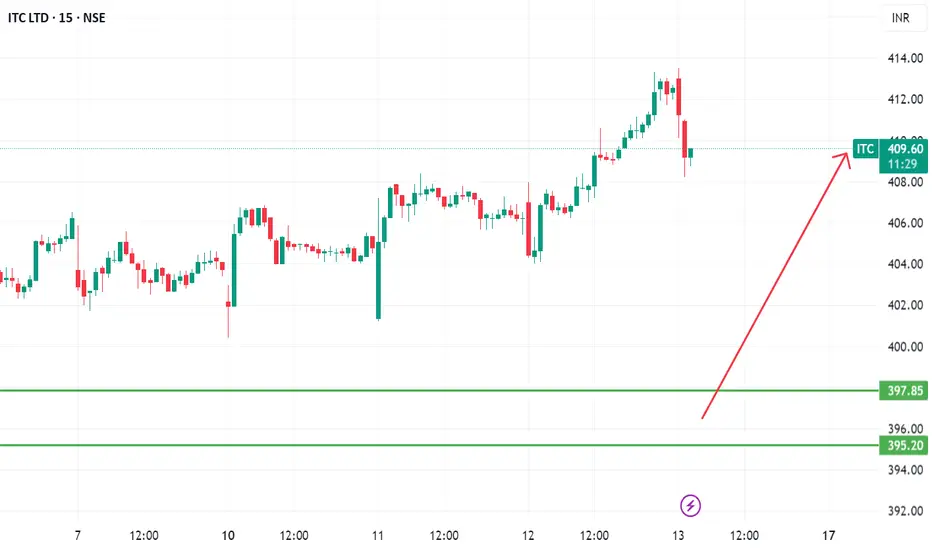
ITC 1D🔺 Triangle Pattern (likely Symmetrical/Ascending Triangle)
Current Price Zone: ₹416
Pattern Type: Likely Ascending Triangle (if higher lows are forming against a horizontal resistance)
Resistance Level: Around ₹416–420
Breakout Confirmation: Needs a strong bullish candle above resistance with significant volume.
📊 What to Watch:
Volume:
A genuine breakout should happen with above-average volume. Watch the 50-period or 20-period average volumes on daily or 1H chart.
Breakout Candle:
Should close above ₹420 ideally. A breakout without closing above resistance is risky.
Retest Possibility:
Sometimes, price may break out and retest the breakout level before continuing the uptrend. Don’t panic if it slightly dips and holds support near ₹416.
🎯 Target Levels After Breakout:
You can calculate the triangle breakout target like this:
Target = Height of triangle + Breakout point
Let’s assume the base of triangle is from ₹375 to ₹416 = ₹41 range
Breakout Target = ₹416 + ₹41 = ₹457
📌 Extended Target (Momentum-based): ₹475–₹500 zone
📌 If volumes + broader market support: ₹500+ is possible, especially in swing or positional setups.
📉 Invalidation (Risk Management):
If after breakout, price falls below ₹410–408 with volume, it could be a false breakout.
Keep a stop-loss below previous swing lows or support trendline.
🧠 Summary:
✅ Triangle breakout with volume = bullish confirmation
🎯 Targets: ₹457 → ₹475 → ₹500
❗ Risk zone: below ₹410
🔁 Retest is common before upmove continues
Disclaimer: The information provided is for educational and informational purposes only and should not be considered as financial advice. Investing in the stock market involves risk, and past performance is not indicative of future results. Please consult with a certified financial advisor or conduct your own research before making any investment decisions. We are not responsible for any losses incurred as a result of using this information. Stock market investments are subject to market risks; read all related documents carefully.
ITC trade ideas
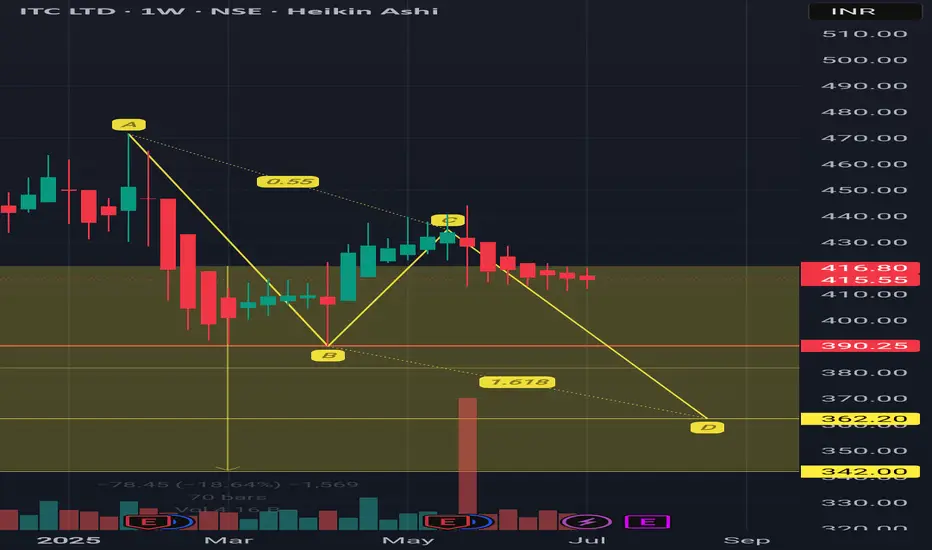
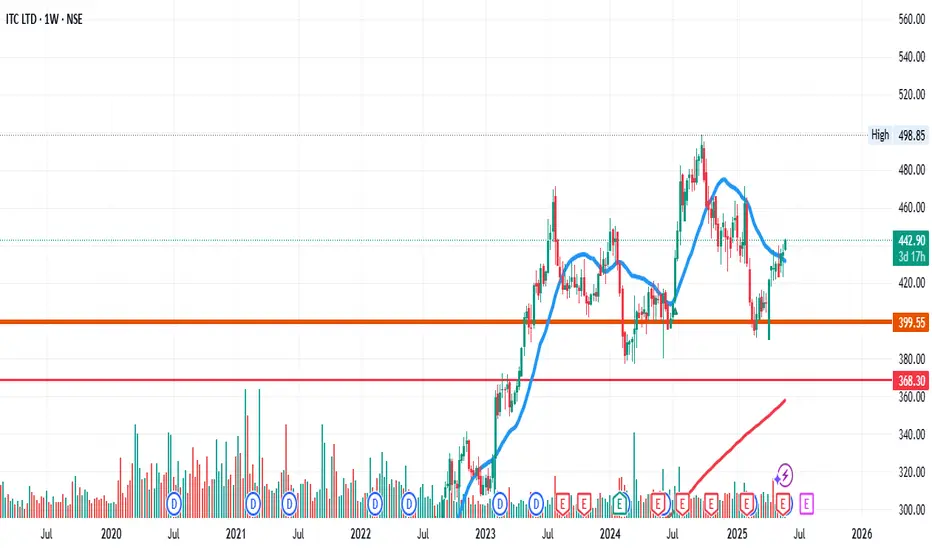
Will ITC go further down to 342 As per Harmonic PRZ pattern, if support level at 390 breaks, ITC can go further down to 362 and 342 in few weeks
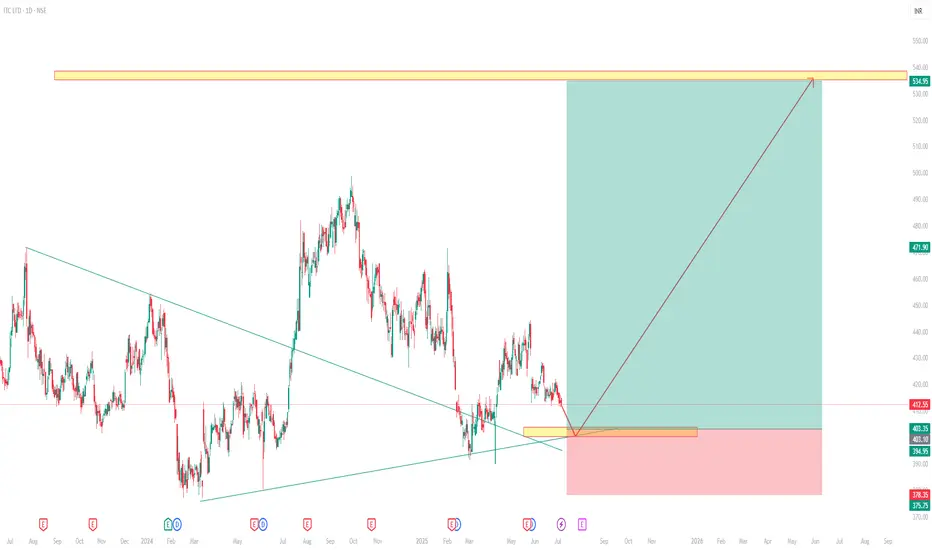
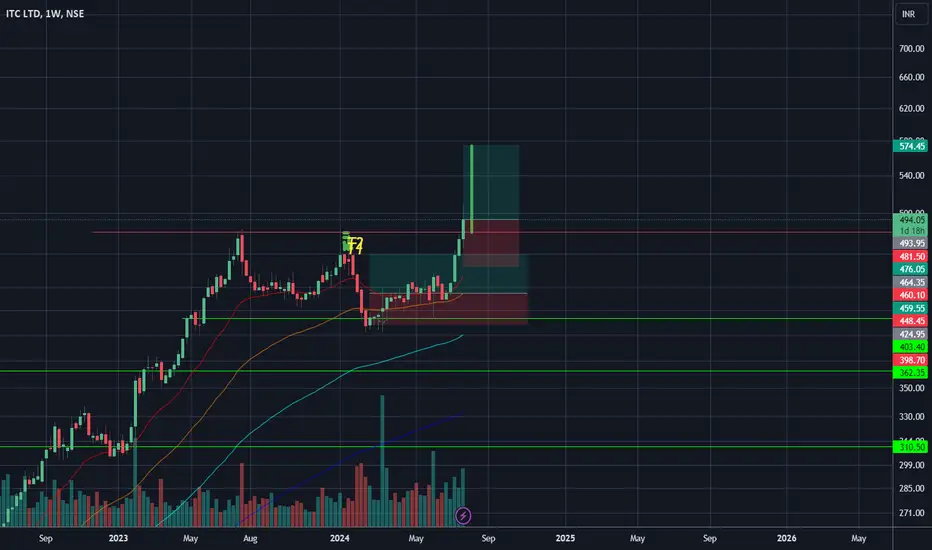
ITC - Long - TGT 534ITC showing the Bull run .
The stock is expected to thit the levels of 534.
The price might retrace to the levels of 402 before flying high the higher levels.
Below 373 might change the direction of the stock.
ITC🔷 ITC Trade Setup Summary
Key Element Details
Trade Type BUY (Long)
Entry Price ₹416
Stop Loss ₹380
Target Price ₹604
Risk ₹36
Reward ₹188
Risk-Reward 5.2 : 1
Last High ₹498
Last Low ₹392
✅ Trade is trend-aligned across all timeframes.
📌 Entry at ₹416 is at the top of a demand cluster (monthly to intraday) – ideal for breakout continuation.
🔷 Setup Logic
✅ All trends UP: From Yearly down to 60 min – strong alignment.
📈 Entry sits just above a dense demand cluster (₹380–₹416) – smart and safe.
🛡️ Stop Loss (₹380) is protected by all demand zones.
🎯 Target (₹604) is realistic long-term, breaking past the previous high of ₹498.
🔷 Strategy Recap
Action Price Reason
BUY ₹416 Breakout above demand zones (DMIP)
SL ₹380 Below demand cluster (safe risk)
Target ₹604 Swing target, above previous high
🔷 Verdict
✅ Good RR (5.2:1) — even a 30–40% move to target gives excellent profit.
✅ Ideal for swing or positional traders.
⚠️ Watch for price consolidation around ₹416–₹420 before breakout.
🔷 Multi-Timeframe Demand Zone Breakdown
Timeframe Zone Type Zone Range (₹) Avg Price Remarks
Yearly BUFL 340 – 307 324 Strong long-term demand base
Half-Yearly BUFL 340 – 307 324 Matches yearly zone
Quarterly BUFL 372 – 357 365 Consolidation before breakout
Monthly DMIP 416 – 380 398 Entry sits on top of this zone
Weekly DMIP + Swap 416 – 380 398 Strong structure at entry area
Daily DMIP 402 – 380 391 Repeated buying interest
Intraday DMIP 407 – 394 401 Confirming strong near-term demand
ITC LOOKING BULLISHITC looking bullish on this price range. see the consolidation and volume are also gud on green candle. 20 ma and 200 ma support on weekly time frame.
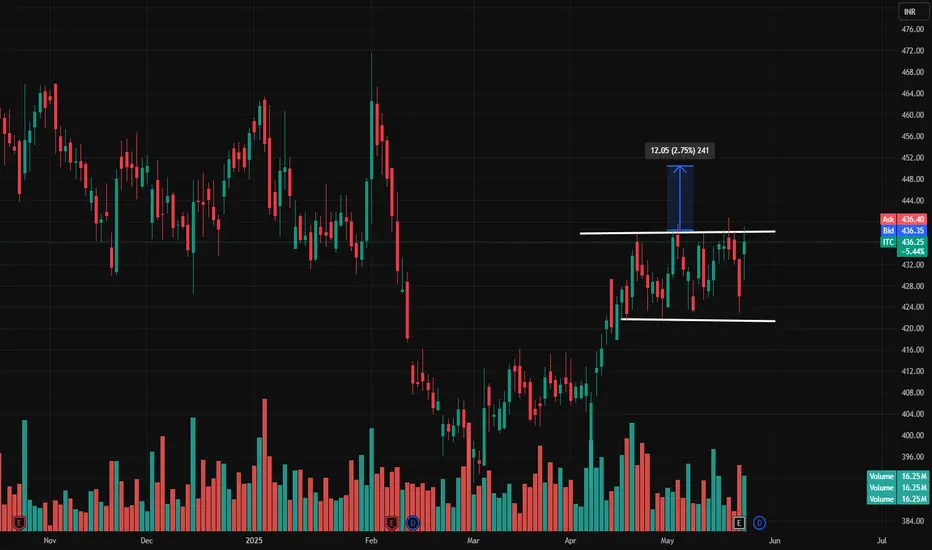
ITC Ltd – Breakout Watch!ITC has been consolidating between ₹424–₹438 for weeks. Today, it’s testing the upper range, signaling a possible breakout with a target near ₹450–₹452.
🔹 Resistance: ₹438
🔹 Support: ₹424
🔹 Volume: 16.18M (rising)
A close above ₹439 with strong volume could confirm the breakout. Watch closely — this move could offer a quick swing opportunity! ⚡
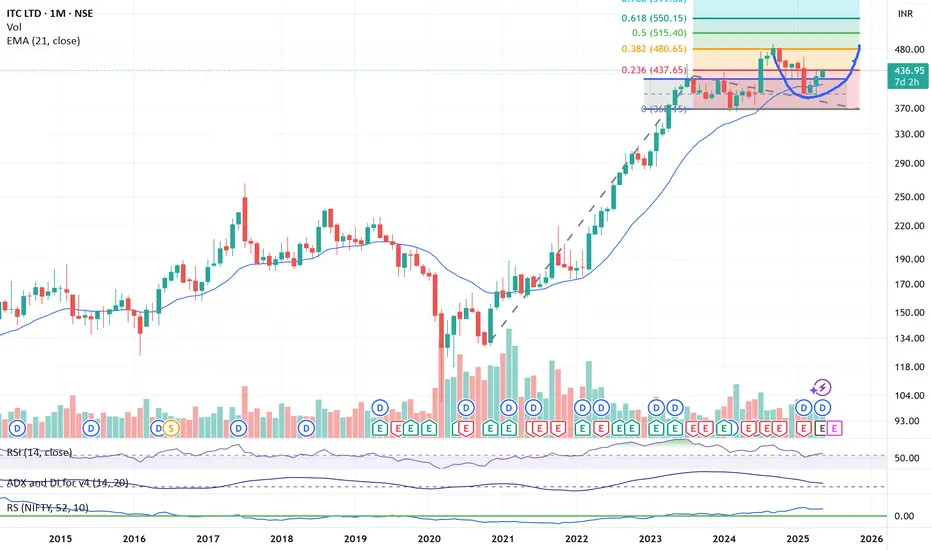
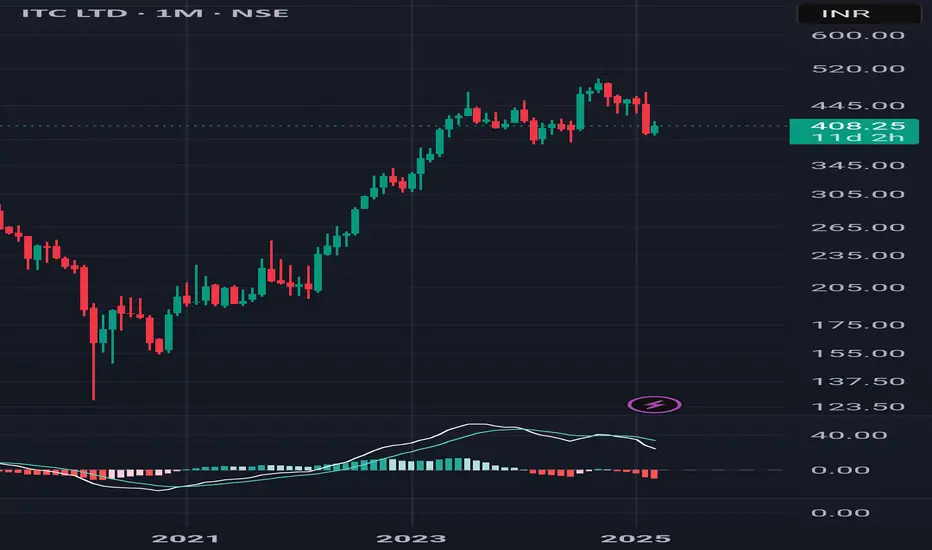
Ye Chart Kuch Kehta Hai (ITC Ltd)ITC making consecutive 3 months higher high, early sign of cup formation and target is for cup breaking out point as golden ration of Fib. retracement. FMCG Sector turn-around and poised for growth. Multiple sign clearly indicates that ITC is picture perfect chart for growth.
Low cheat option, may turn around and ready for cup formation.
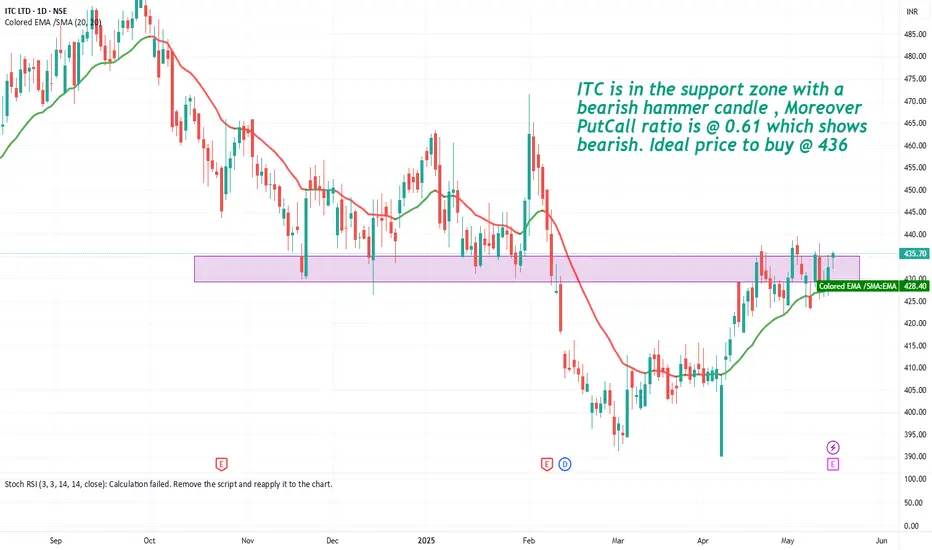
ITC looks bearishItc is in a strong support zone for a few days and closed on 16th may with a strong bearish hammer candle which means the buyers are on the top , and the put to call ratio is 0.61 which denotes that many investors are in buying mode. Mostly uptrend to happen next week
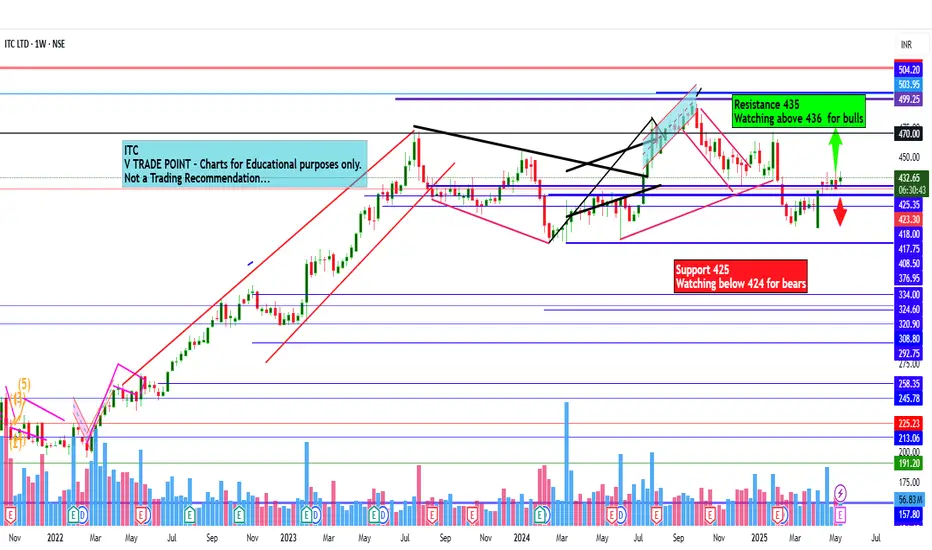
ITC Ltd view for Intraday 16th May #ITC ITC Ltd view for Intraday 16th May #ITC
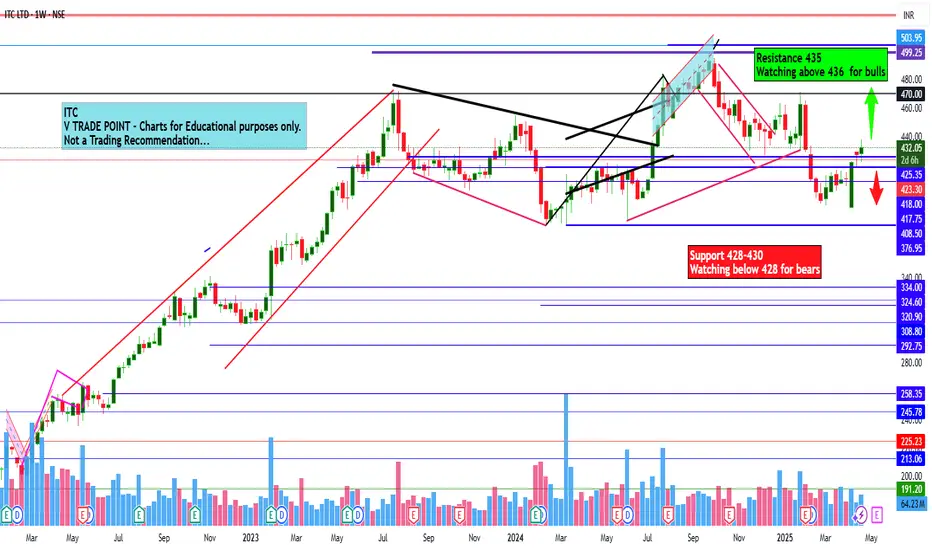
Resistance 435 Watching above 436 for upside momentum.
Support area 425 Below 430 ignoring upside momentum for intraday
Watching below 424 for downside movement...
Above 430 ignoring downside move for intraday
Charts for Educational purposes only.
Please follow strict stop loss and risk reward if you follow the level.
Thanks,
V Trade Point
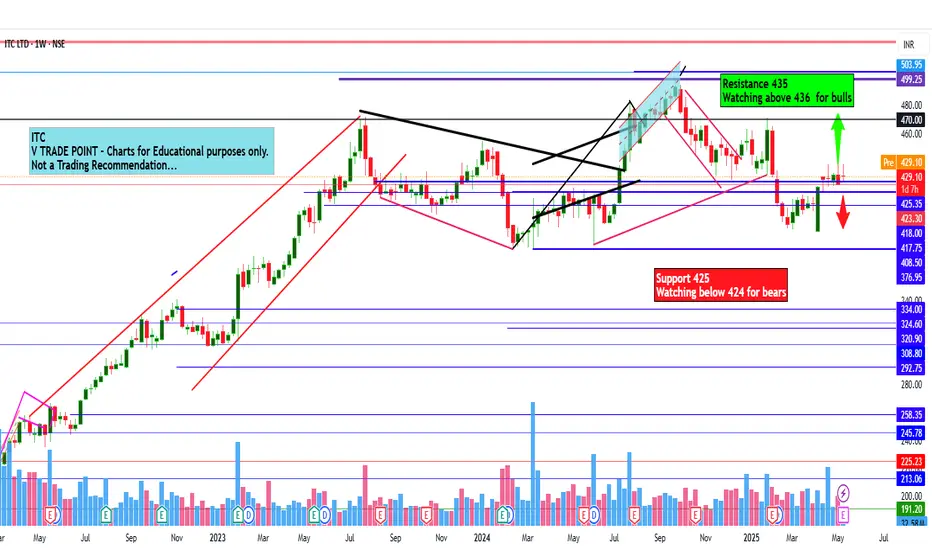
ITC Ltd view for Intraday 15th May #ITC ITC Ltd view for Intraday 15th May #ITC
Resistance 435 Watching above 436 for upside momentum.
Support area 425 Below 430 ignoring upside momentum for intraday
Watching below 424 for downside movement...
Above 430 ignoring downside move for intraday
Charts for Educational purposes only.
Please follow strict stop loss and risk reward if you follow the level.
Thanks,
V Trade Point
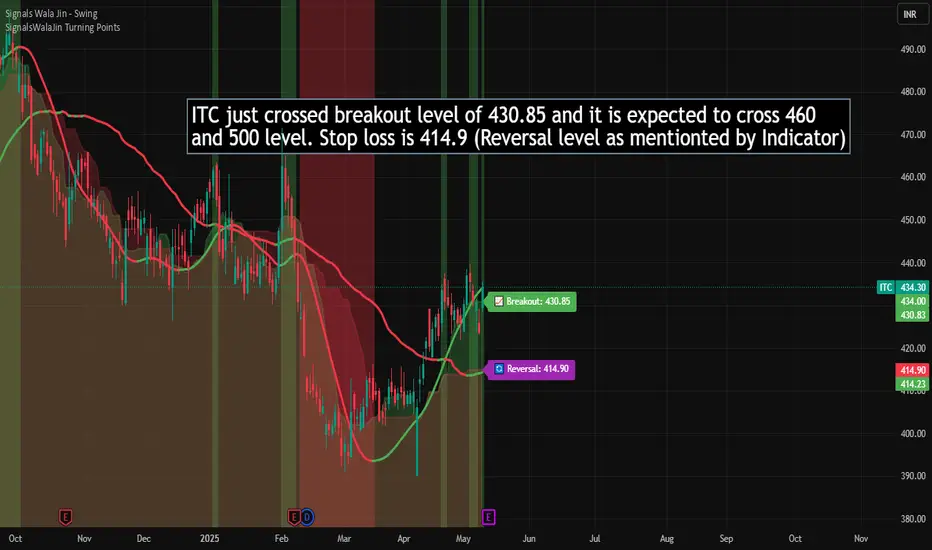
ITC is above breakout level and in bullish zone. ITC just crossed breakout level of 430.85 and it is expected to cross 460
and 500 level. Stop loss is 414.9 (Reversal level as mentioned by Indicator)
ITC Ltd view for Intraday 23rd April #ITC ITC Ltd view for Intraday 23rd April #ITC
Resistance 435 Watching above 436 for upside movement...
Support area 428-430 Below 430 ignoring upside momentum for intraday
Watching below 428 for downside movement...
Above 435 ignoring downside move for intraday
Charts for Educational purposes only.
Please follow strict stop loss and risk reward if you follow the level.
Thanks,
V Trade Point
ITC Ltd view for Intraday 21ST April #ITCITC Ltd view for Intraday 21ST April #ITC
Resistance 429-430 Watching above 430 for upside movement...
Support area 420 Below 425 ignoring upside momentum for intraday
Watching below 419 for downside movement...
Above 425 ignoring downside move for intraday
Charts for Educational purposes only.
Please follow strict stop loss and risk reward if you follow the level.
Thanks,
V Trade Point

ITC .. Make or breakITC 427 is at make or break situation. In chart it has given a Raising flag with HS pattern.
Good resistance at 441 suggests ITC may test the resistance before falling down to 393, 359

ITC WEAK TREND 380-360ITC WEAK TREND 380-360
ITC recently acquired Century Pulp and Paper from Aditya Birla Real Estate for ₹3,498 crore. This acquisition is expected to expand ITC's paper capacity by 48%

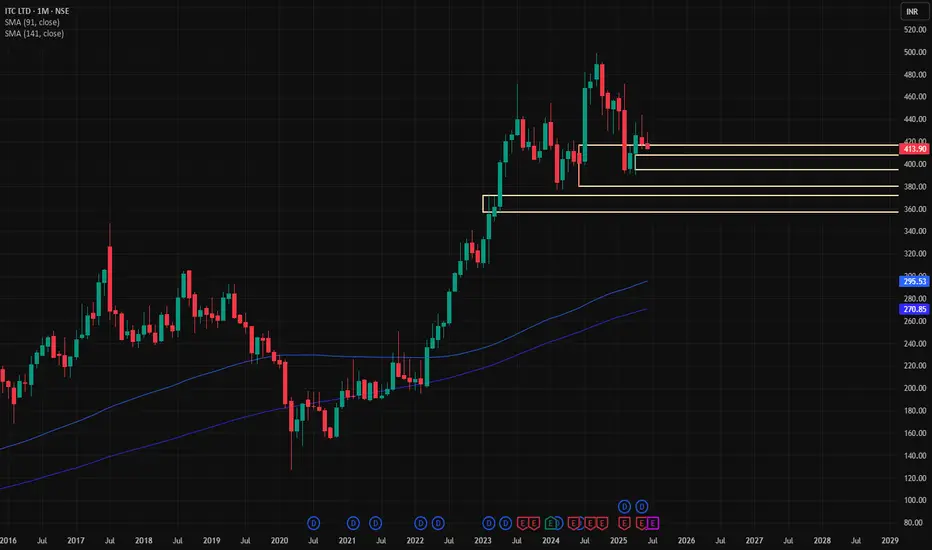
#ITC Demand Zone An ITC Demand Zone refers to a specific price level or area on a chart where the buying interest in ITC Limited (a leading Indian conglomerate with businesses in FMCG, hotels, paperboards, packaging, agri-business, and IT) is significantly strong. This concept is used in technical analysis to identify key levels where the price of ITC's stock might find support and reverse upward. Demand zones are critical for traders looking to enter long positions at favorable prices.
#ITC Demand Zone Weekly timeframe #ITC (ITC Limited) demand zone on the weekly timeframe, you would look for areas where the price has historically shown strong buying interest (support zones).

ITC short term target could be 300ITC on weekly time frame has broken support channel.
Moreover, it has formed crab pattern.
With this it has potential for 300 with following levels.
380 / 360 / 350 / 320 / 300.
SL:425

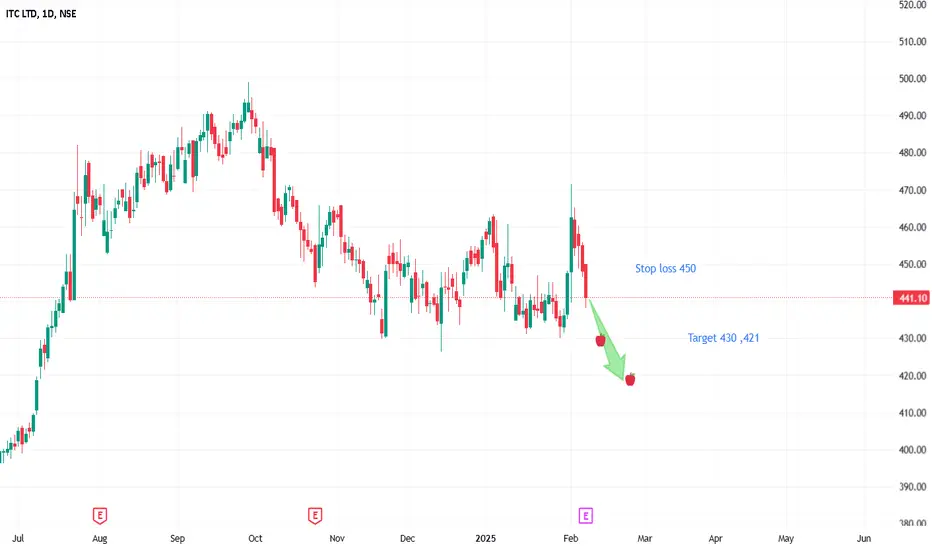
ITC Analysis for result.Analyzed ITC with different technique and trend. It is looking weak and result is there today. So lavels are share with stop loss and target.
ITC - TECHNICAL VIEWISCLAIMER
it's just my technical view. I'M NOT A SEBI REGISTERED ANALYST. Before taking trade or Invest consult your financial advisor.
✅Here we provide TECHNICAL Levels and Charts.💯
✅This channel is for educational and self analysis purposes only!
CONTACT : 6374741690

ITC | LONG | SWINGITC has formed a reverse H&S pattern on the Hourly chart as you can see from this image.
Price is now holding the Weekly Pivot and this is a good sign of reversal from the lows.
Long trade can be entered for a Target of 450 price level.
SL - 435
