analysisAnalysis of Laurus Labs Ltd. Chart (Weekly Timeframe)
1. Channel Trend & Breakout
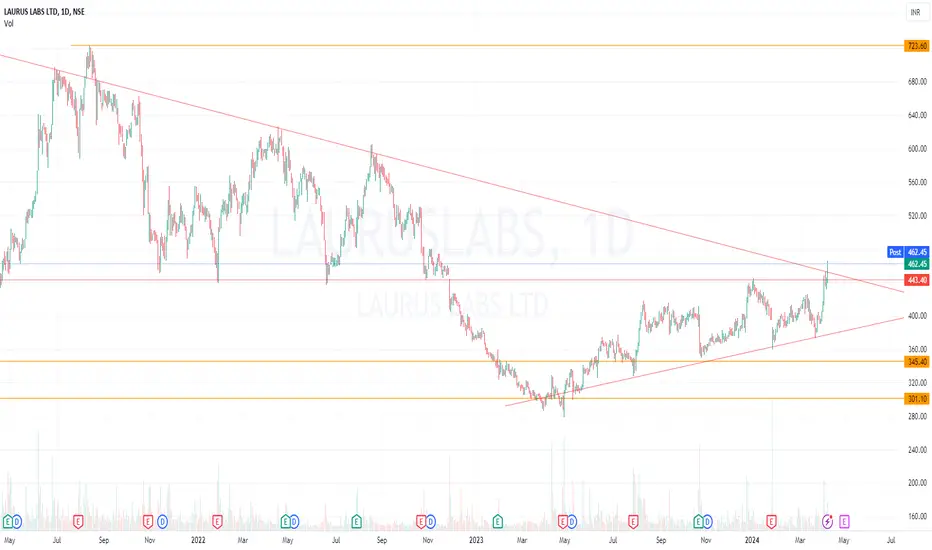
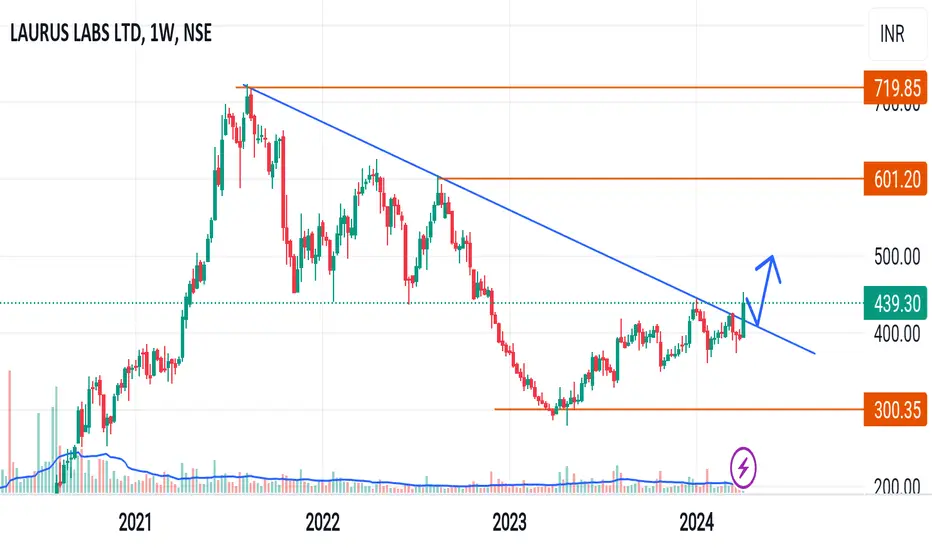
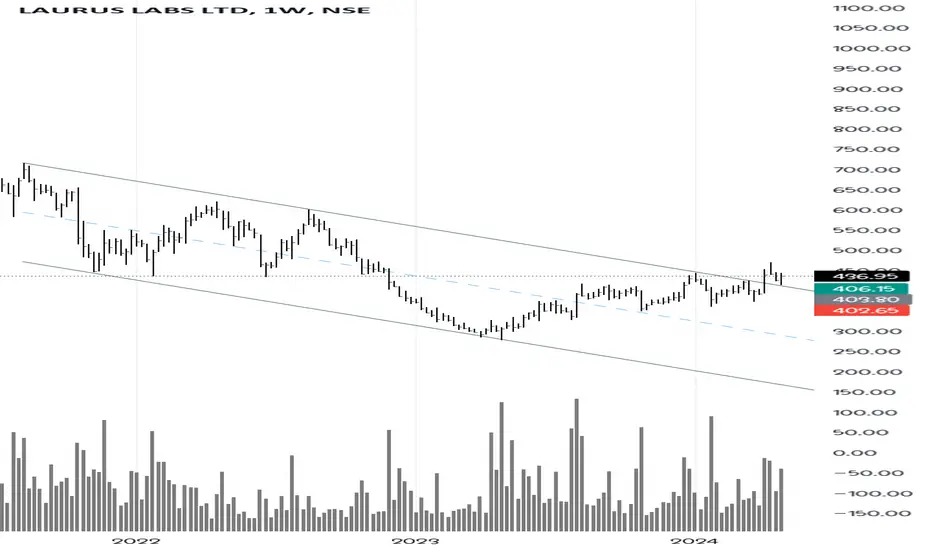
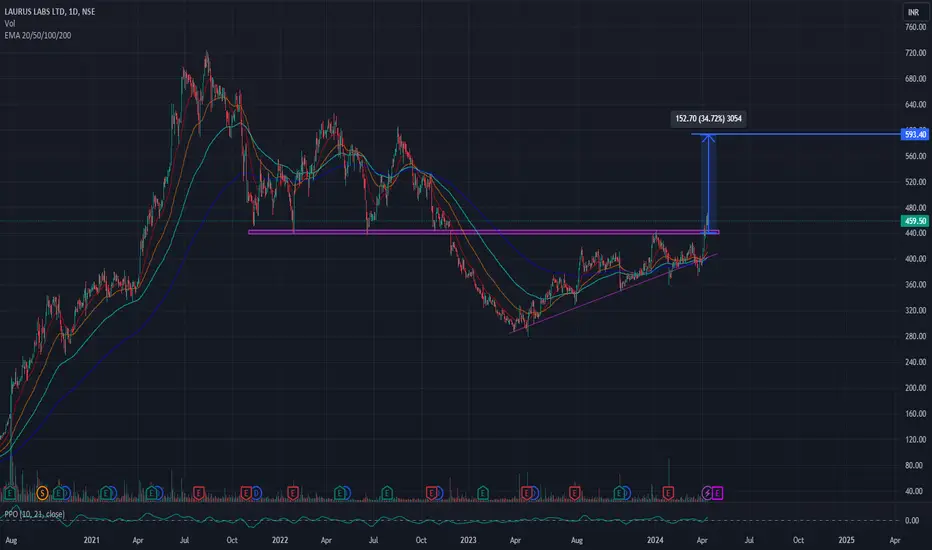
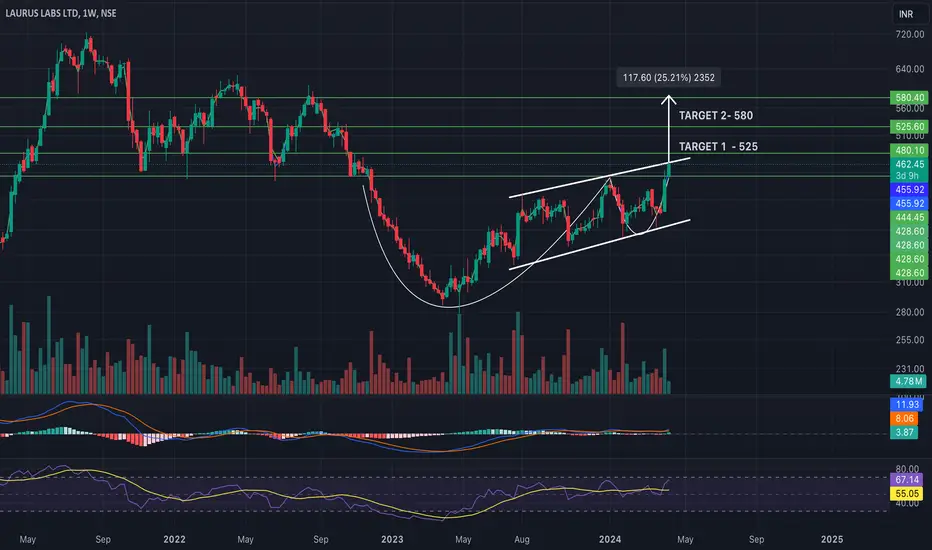
Upward Channel: The chart shows a clear upward trend within a rising channel, starting from around mid-2022 and continuing into late 2024.
Breakout: The price has just broken out of the upper boundary of the channel near the ₹500 level, suggesting potential bullish momentum. A breakout above a rising channel typically indicates that the stock may continue to rally in the short-to-medium term.
Volume Confirmation: The breakout is supported by a significant spike in volume (11.09M), which confirms the strength behind this breakout. High volume during a breakout usually strengthens the case for sustained upward momentum.
2. Resistance Levels
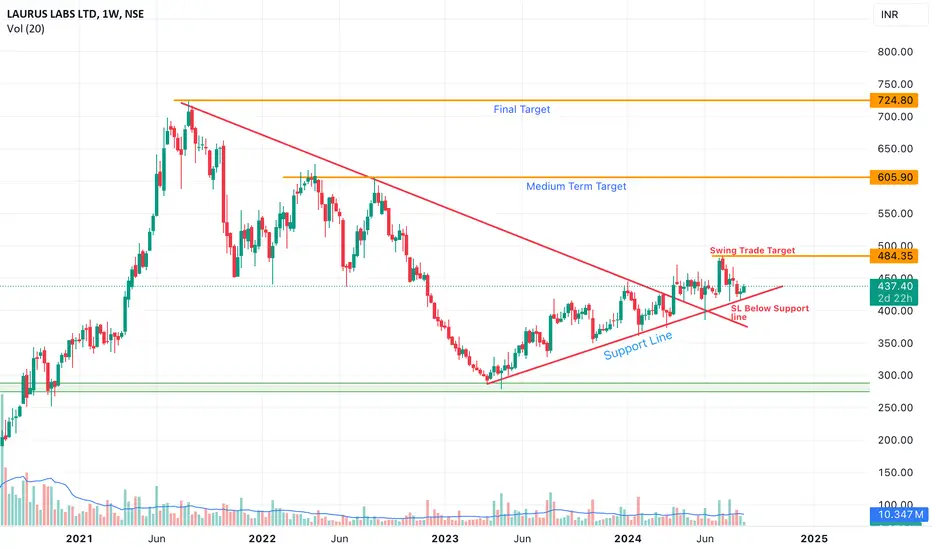
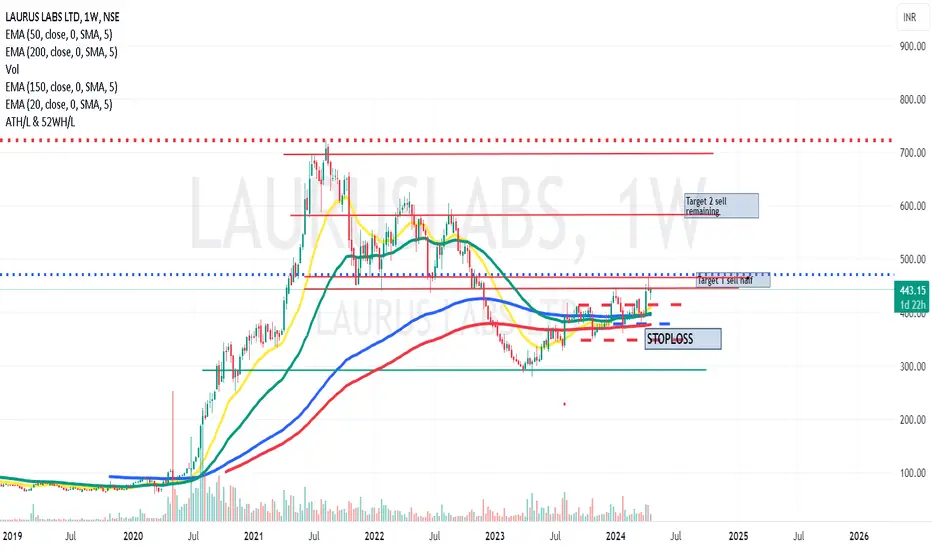
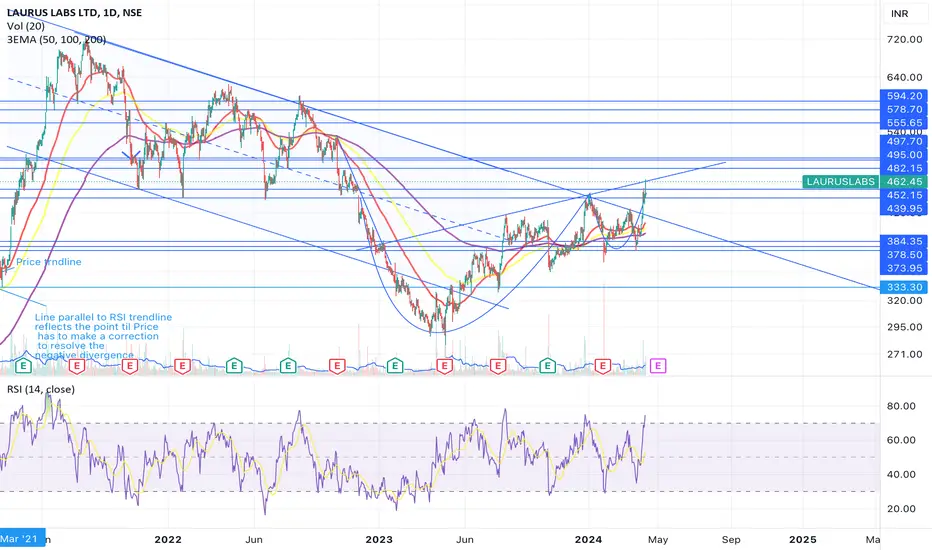
Next Resistance: The chart shows that the next major resistance level is around the ₹550-₹590 zone (marked on the chart), which was a previous support-turned-resistance in 2022.
Potential Target: Since the stock has broken out of the channel, the immediate target could be the next resistance at around ₹590, a key psychological level.
3. Volume Analysis
The recent volume surge (11.09M) during the breakout phase indicates strong buying interest. This is a bullish signal that supports the breakout. Sustained high volume could lead to further upside.
Volume Trend: It’s crucial to monitor if this volume trend continues. If volumes start to decline, the breakout may lose momentum, and the stock could consolidate or retrace.
4. Moving Forward
Short-term Target: The breakout suggests an upward move toward the ₹550-₹590 zone.
Long-term Outlook: If the stock clears ₹590 convincingly, it could enter a new bullish phase and aim for levels above ₹600. However, failure to sustain above ₹500 could result in a retest of the lower support levels.
🚀 Laurus Labs (LAURUS) Breaks Out! Bullish Momentum Ahead? 🚀
📊 After months of consolidation, Laurus Labs Ltd has broken out of a rising channel on the weekly chart, hitting ₹506.70 today! 🔥
📈 Breakout Details:
Trend: Upward channel breakout 💥
Next Resistance: ₹550-₹590 💡
Volume: Strong confirmation with a spike to 11.09M 🟢
💡 What’s Next?
If momentum continues, the stock could rally towards ₹590 🏁
Watch out for volume to sustain! 🔍
Target: Short-term upside towards ₹550-₹590 🚀
👉 Are you ready for this potential run? 📈 Let’s discuss below! 👇
LAURUSLABS trade ideas

Key Support & Resistance Breakout - Swing TradeDisclaimer: I am not a Sebi registered adviser.
This Idea is publish purely for educational purpose only before investing in any stocks please take advise from your financial adviser.
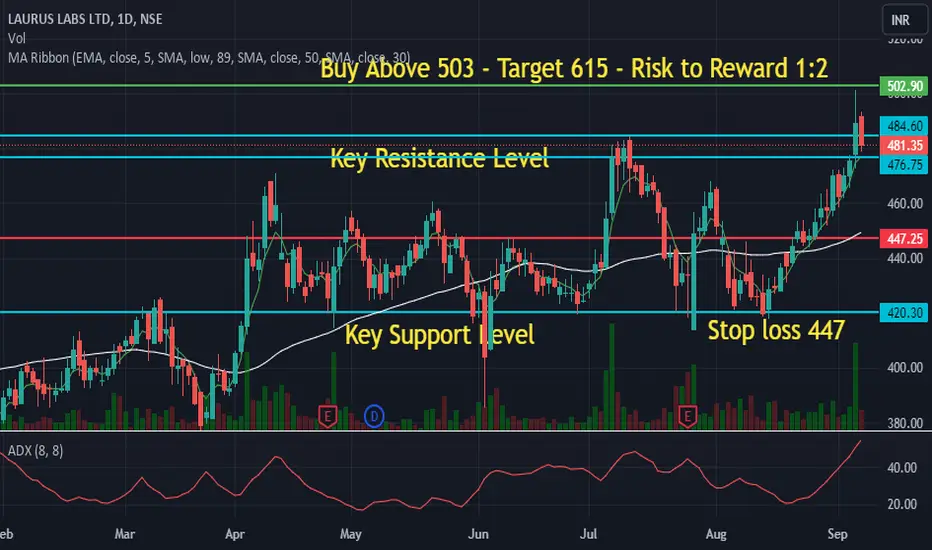
Key Support & Resistance Breakout. Stock has give Breakout of Resistance level. Keep in watch list. Buy above the high. Suitable for Swing Trade. Stop loss & Target Shown on Chart.
Be Discipline because discipline is the Key to Success in the STOCK Market.
Trade What you see not what you Think
Swing Trade - Lauras LabCompany trading at it's support.
Pharma Sector is booming.
Good RR trade
Stock looks good for long term as well with proper quantity play in this counter.
Please do your analysis before taking any trade.
Thanks
Review and plan for 26th July 2024Nifty future and banknifty future analysis and intraday plan in kannada.
STOCKS TO WATCH- included.
This video is for information/education purpose only. you are 100% responsible for any actions you take by reading/viewing this post.
please consult your financial advisor before taking any action.
----Vinaykumar hiremath, CMT

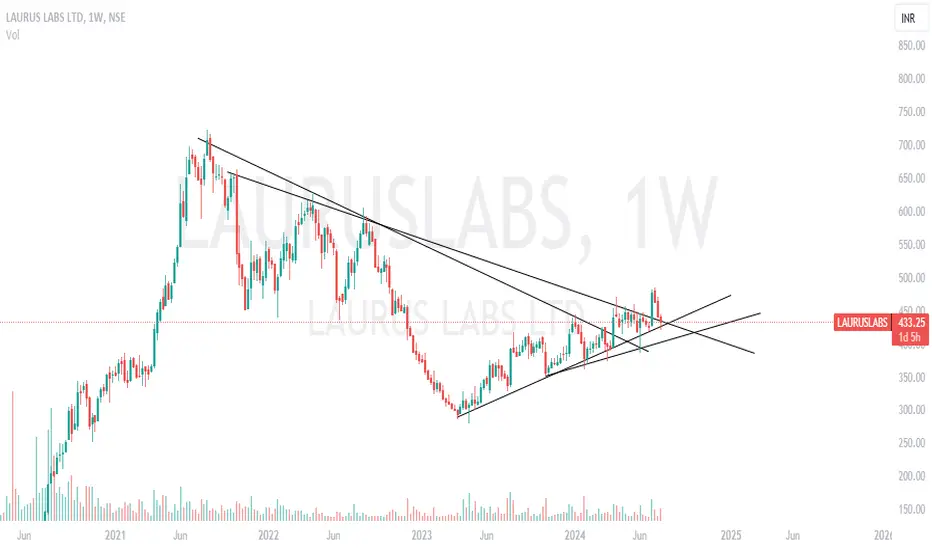
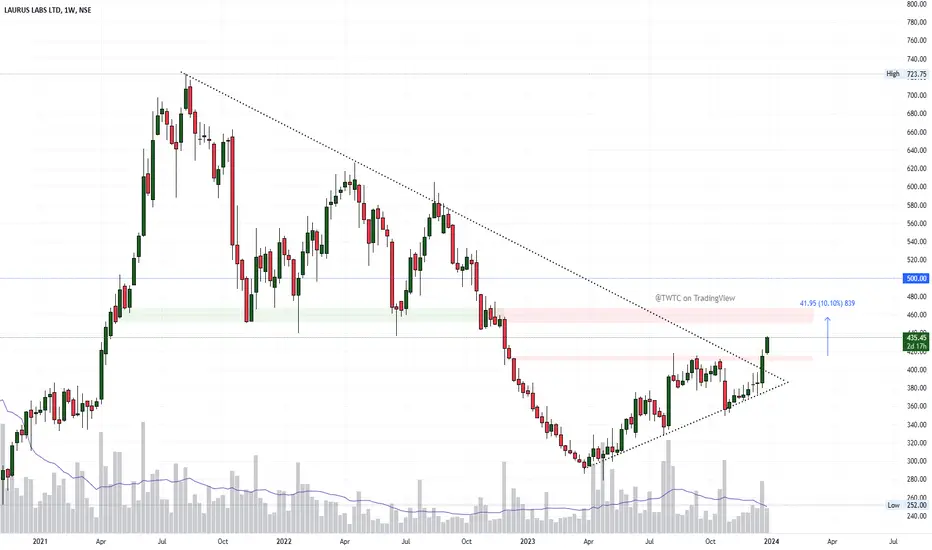
LAURUSLABSThe stock is re-testing the BO line. It's a 3 year trend BO. Pls do your own analysis before entering a trade. Pls boost the idea if it helps you. Thank you
LAURA LABS, rocket is ready for launch.LAURA LABS Breakout from here. Sl below the trend line.
Chart is self explanatory. Please follow the price action & take the trade as per your appetite.
The information provided here is only for educational purpose. The information provided here is not intended to be any kind of financial advice, investment advice, and trading advice. Investment in stock market is very risky and trading stocks, options and other securities involve risk. The risk of loss in stock market can be substantial. Moreover, I am not a SEBI registered analyst, so before taking any decision or before investing in any Share consult your financial advisor and also do your analysis and research.
Request your support and engagement by liking and commenting & follow to provide encouragement.
LAURUSLABSBO after 3 years with good volumes. Pls do your research before entering a trade. Boost the post if you like the idea. Thank you.
Laurus Labs - Breakout with a resistance!The chart is self-explanatory as always :)
⚠️Disclaimer: We are not registered advisors. The views expressed here are merely personal opinions. Irrespective of the language used, Nothing mentioned here should be considered as advice or recommendation. Please consult with your financial advisors before making any investment decisions. Like everybody else, we too can be wrong at times ✌🏻
laurus labs weekly consolidation break can be a good candidate to give u some good returns in very short time it has to close above 450-55 weekly ... can buy for 10-30% returns

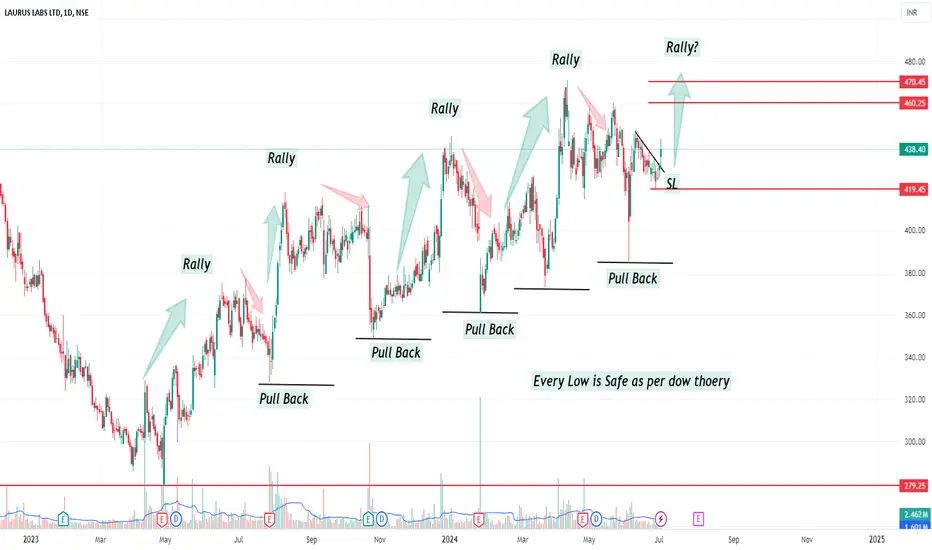
LAURUS LAB - HISTORY REPEATHELLO EVERYONE,
I am here with a new powerpack price action that we can see in LAURUS LABS.
KEY POINTS
-- The stock is continuously following the pattern of HIGHER HIGH and HIGHER LOWS Giving a look of RALLY and PULLBACK.
-- Now the stock is again looking for RALLY i.e HIGHER HIGH.
-- Stock has given a small breakout of downward sloping Trendline.
-- stock might give close above 50 EMA (in daily TF) today which will help this stock move upward.
-- There seems increasing volume in this stock.
Exceptional key point-
--Its a fundamentally good company and it has purchased some building and machinery in last quarter, This might helps to give good results in upcoming quarters.
Trade Plan
-- One can enter at Current Market Price as it is above 50 EMA
-- Targets will be 450-465-480
-- Stop Loss will be at 419 (previous swing low)
Disclaimer
I am not SEBI REGISTERED. consult your financial advisor before any kind of investment. I am not responsible for any kind of your profits and losses.
Thank you
KARANN DINGRA
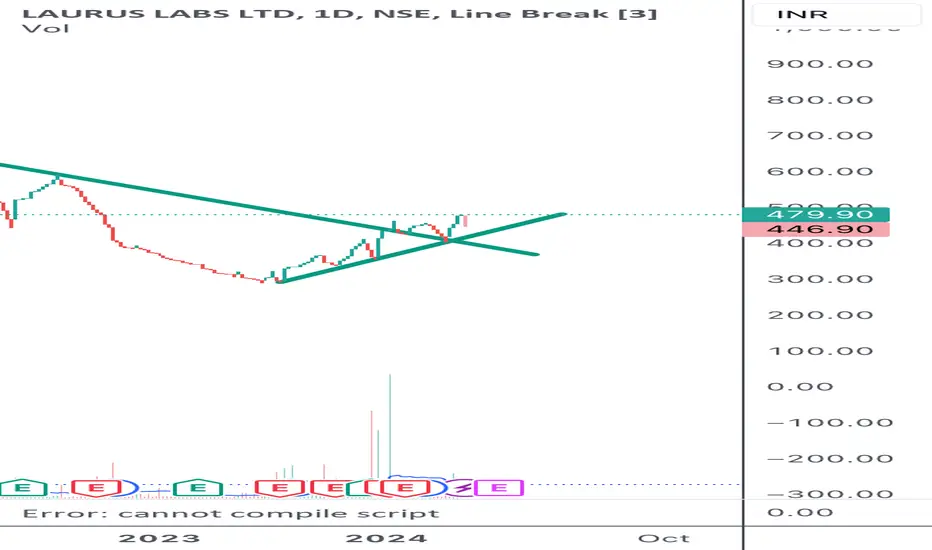
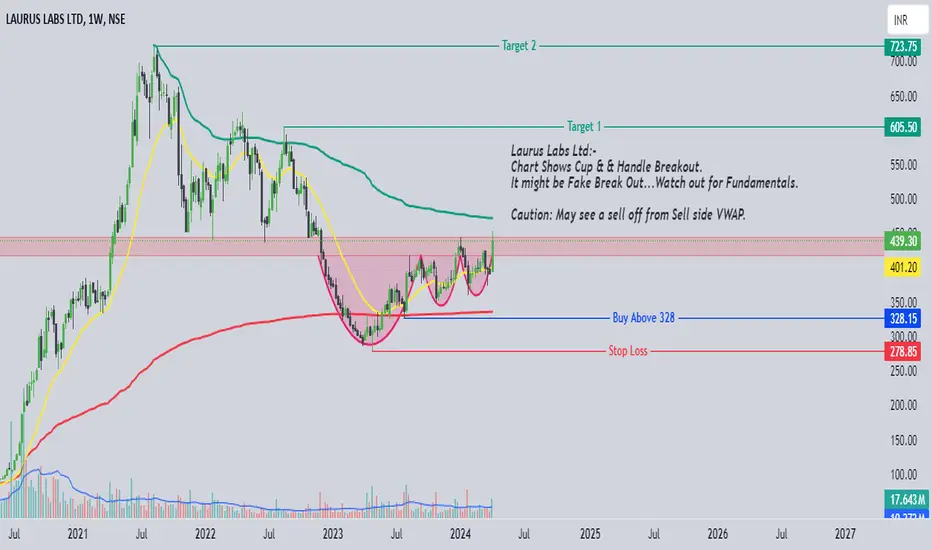
Laurus Labs- Fake Cup & Handle Break out...Laurus Labs Ltd:-
Chart Shows Cup & & Handle Breakout.
It might be Fake Break Out...Watch out for Fundamentals.
Caution: May see a sell off from Sell side VWAP.
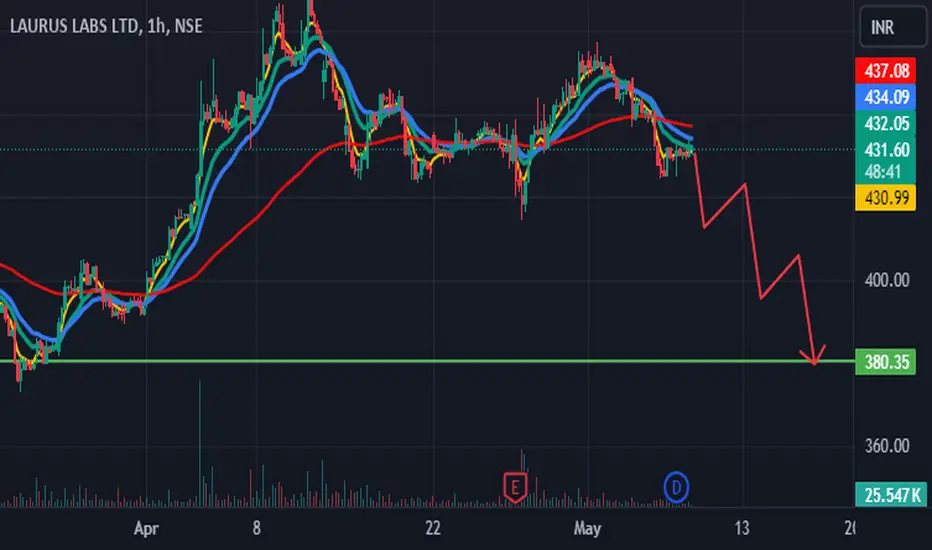
Sell Laurus Labs cmp 431 target 380 stop 455Technically this stock has bearish structure on a hourly chart indicating weakness and fall to come in coming days. Fundamentally the recent quarters were extremely bad and it can easily correct to 380 levels. Big people seems to be distributing stocks on a higher levels, whenever demand become weak, the stock can easily correct 5% plus in a single trading session. So strongly recommend to aggressively short this stock and wait for big fall.
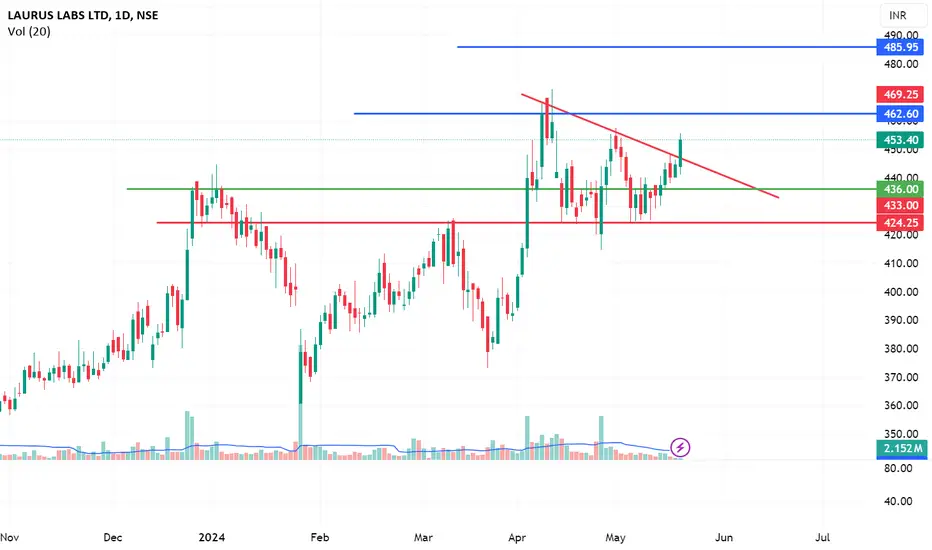
LAURUSLABSNSE:LAURUSLABS
TRend line Breakout
Same chart pattern of Hiher high and lower low
Rsi>60
Sl-= 424
Major support @436-434
Taget- 485++ in
MA is also in Buy
Lauraslab. Multi year Trendline BreakoutJust gave breakout.
Retest also done.
Good candidate for going long.
Laurus Lab ltd I have shared my opionion on lauruas lab ltd for short term
This is purely education purpose only
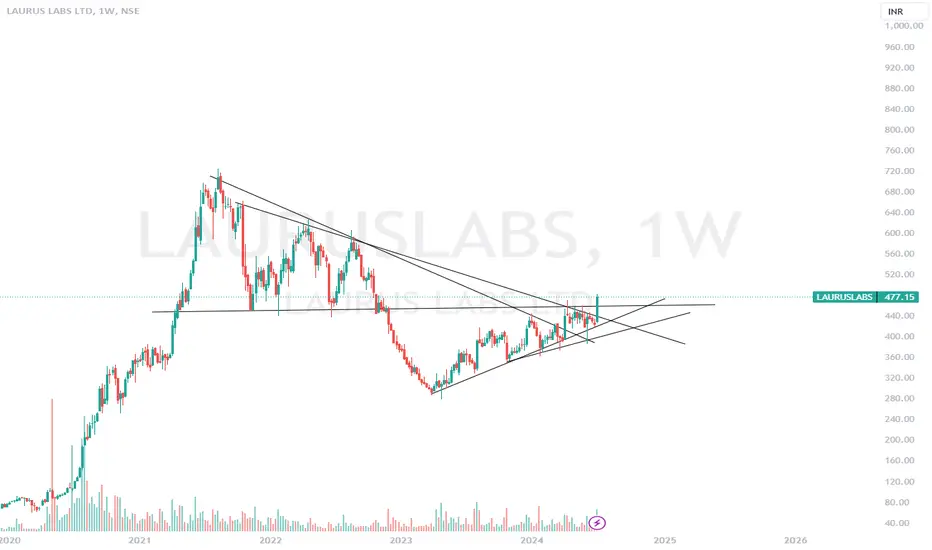
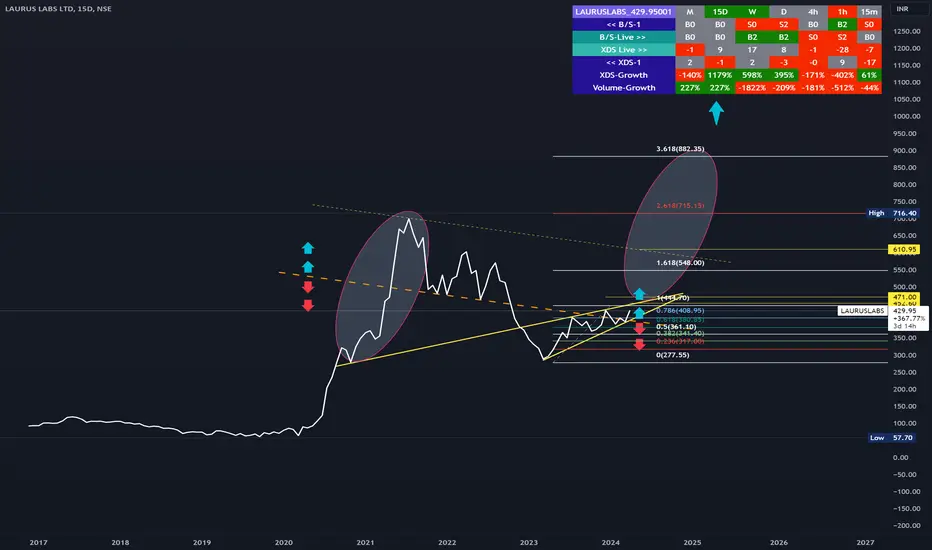
Lauruslabs | Laurus Labs long term viewLauruslabs | Laurus Labs long term view
Technicals Growth Rate is Good in Daily/weekly and for 2weeks
Volume growth is good in monthly while growth rate need to imporve for just 2 points..
Price - closing and opening above 470 can send it to 550/600 and 715-882 further post retesting the support levels..
Laurus LabLaurus lab cmp 462, Breaking out for potential Target 490, 525,& 580
Trendline and Cup n handle breakout.
Lauras: Lures?Counter looks perfect for a good upmove, broken the trendline, making HH HL, cleared the CnH BO. Seems to go 625 with a small hiccup near 500. Exciting price action.
LAURUSLABS Long T1 500 T2 500 T3 620 T4 670 LAURUSLABS Long T1 500 T2 500 T3 620 T4 670 Stop Loss based on TL breach as explained in the last 30 seconds in the video