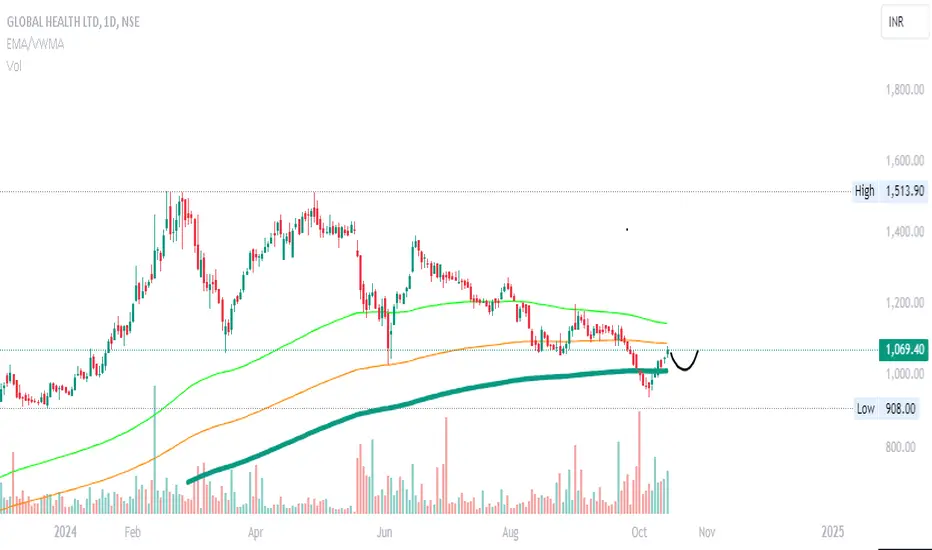
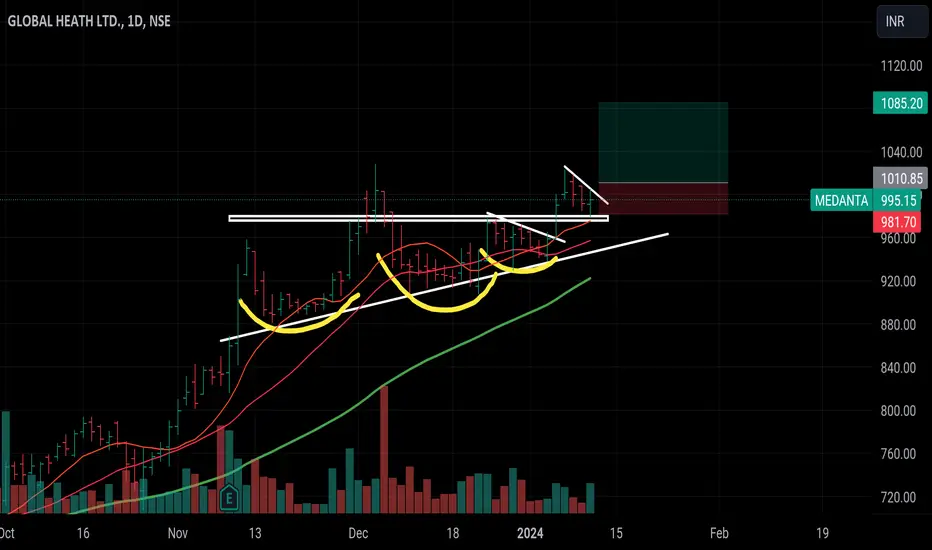
nice breakout in medanta :)Nice breakout on Medanta — that old resistance level basically curled into a cute little rounded bottom ⭕
🔴 Red flag alert:
It didn’t even flinch at that resistance — just blasted through like it owed it money (rude --)
Could be a sign of trouble, but hey, setup’s clean enough for me to trade it (ง •̀•́)ง
MEDANTA trade ideas
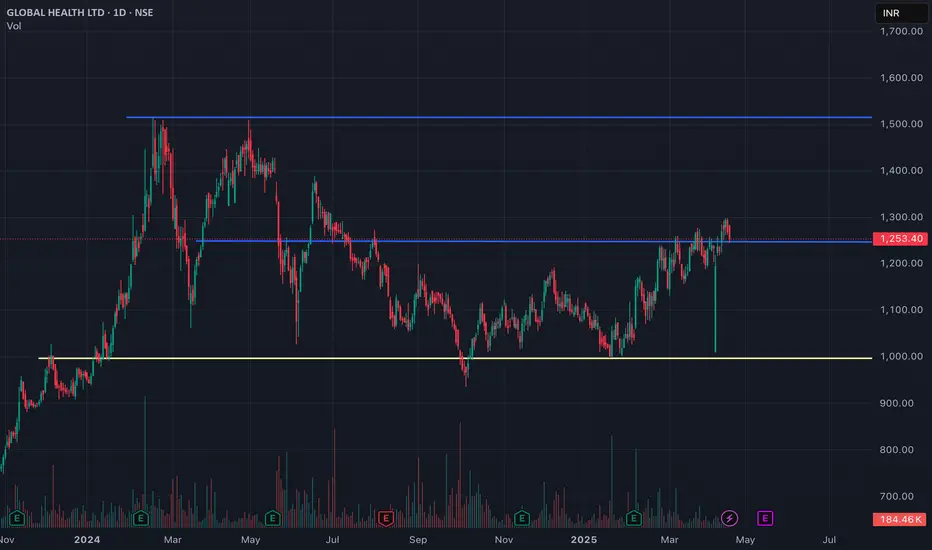
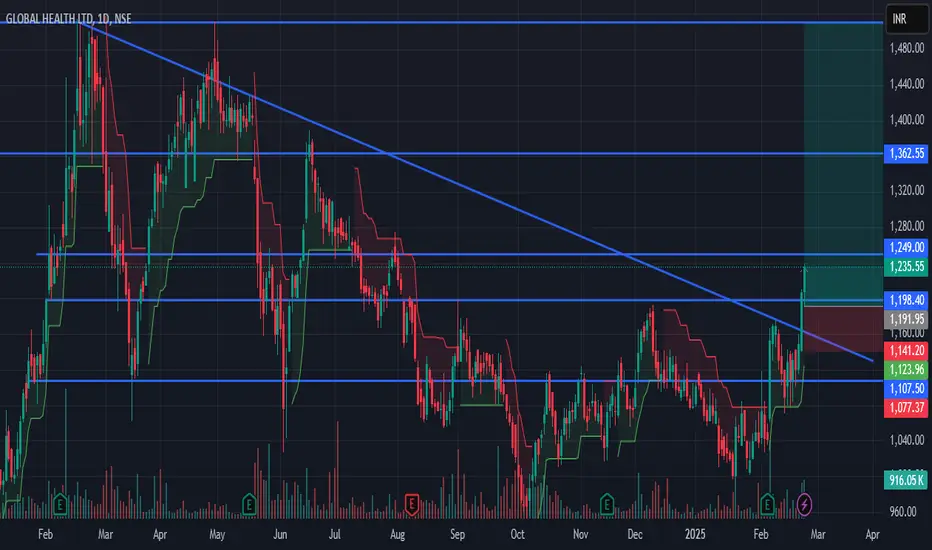
GLOBAL HEALTH LTD S/RSupport and Resistance Levels:
Support Levels: These are price points (green line/shade) where a downward trend may be halted due to a concentration of buying interest. Imagine them as a safety net where buyers step in, preventing further decline.
Resistance Levels: Conversely, resistance levels (red line/shade) are where upward trends might stall due to increased selling interest. They act like a ceiling where sellers come in to push prices down.
Breakouts:
Bullish Breakout: When the price moves above resistance, it often indicates strong buying interest and the potential for a continued uptrend. Traders may view this as a signal to buy or hold.
Bearish Breakout: When the price falls below support, it can signal strong selling interest and the potential for a continued downtrend. Traders might see this as a cue to sell or avoid buying.
MA Ribbon (EMA 20, EMA 50, EMA 100, EMA 200) :
Above EMA: If the stock price is above the EMA, it suggests a potential uptrend or bullish momentum.
Below EMA: If the stock price is below the EMA, it indicates a potential downtrend or bearish momentum.
Trendline: A trendline is a straight line drawn on a chart to represent the general direction of a data point set.
Uptrend Line: Drawn by connecting the lows in an upward trend. Indicates that the price is moving higher over time. Acts as a support level, where prices tend to bounce upward.
Downtrend Line: Drawn by connecting the highs in a downward trend. Indicates that the price is moving lower over time. It acts as a resistance level, where prices tend to drop.
Disclaimer:
I am not a SEBI registered. The information provided here is for learning purposes only and should not be interpreted as financial advice. Consider the broader market context and consult with a qualified financial advisor before making investment decisions.
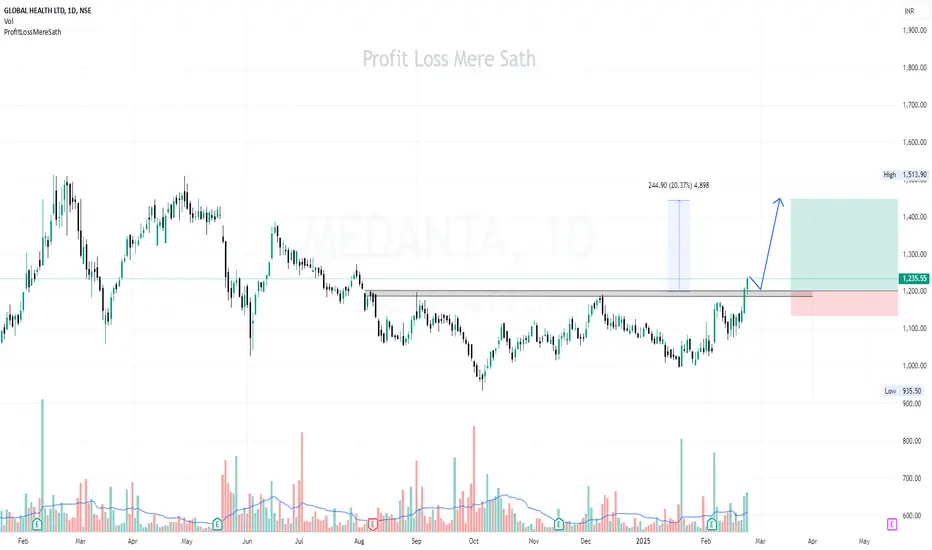
MEDANTA - 1253MEDANTA is waiting for massive upside after long consolidation! I have entered it for a swing at 1253.
This is not a reco to buy or sell. Please do your own research.
Review and plan for 21st March 2025 Nifty future and banknifty future analysis and intraday plan.
Few stocks analysed.
This video is for information/education purpose only. you are 100% responsible for any actions you take by reading/viewing this post.
please consult your financial advisor before taking any action.
----Vinaykumar hiremath, CMT

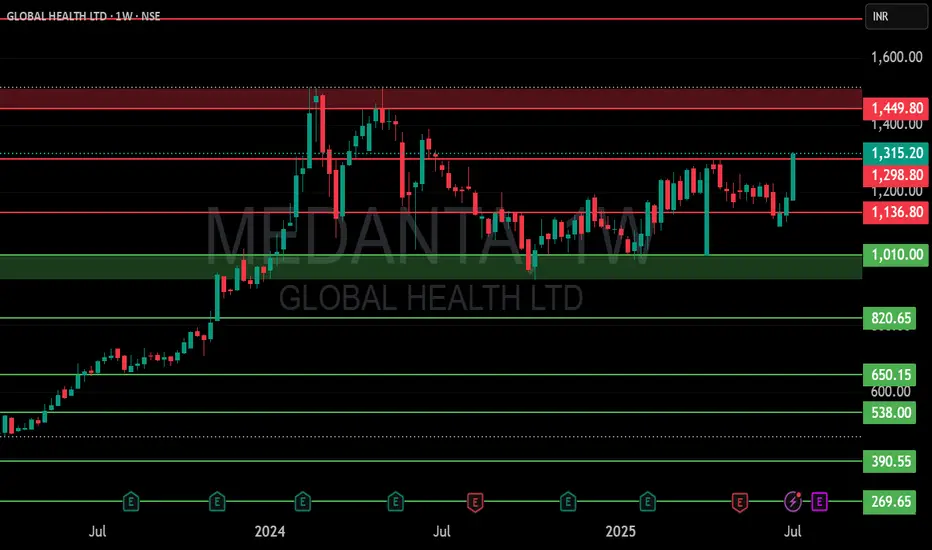
MEDANTA CMP 1235.Medanta is a QoQ and YoY Sales and Profit grower.YoO net profits are increasing consistently.On weekly time frame it bounce from a very important level.Chart show strength in this stock . Daily RSI shows a overbought zone . If sustain above levels we can see a strong rally for targets-1300........1350........1400.Add to your wishlist and how it perform in coming days.(Not a Buy Sell ) Only for study porpose.
MEDANTA | Buy @ 1205 with strict SL 1130 Target 1450Disclaimer:
This is not financial advice. Please do your own research or consult with a financial advisor before making any investment decisions. Investments in stocks can be risky and may result in loss of capital.
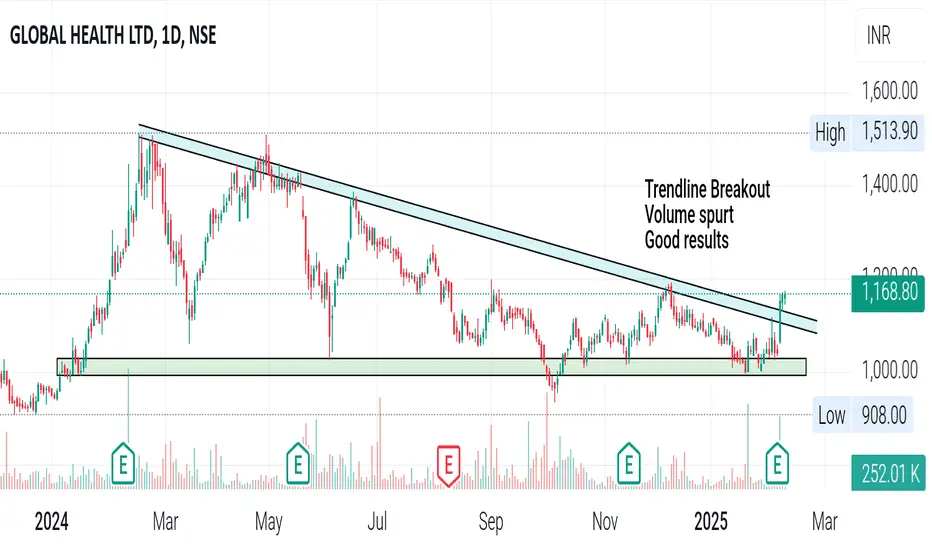
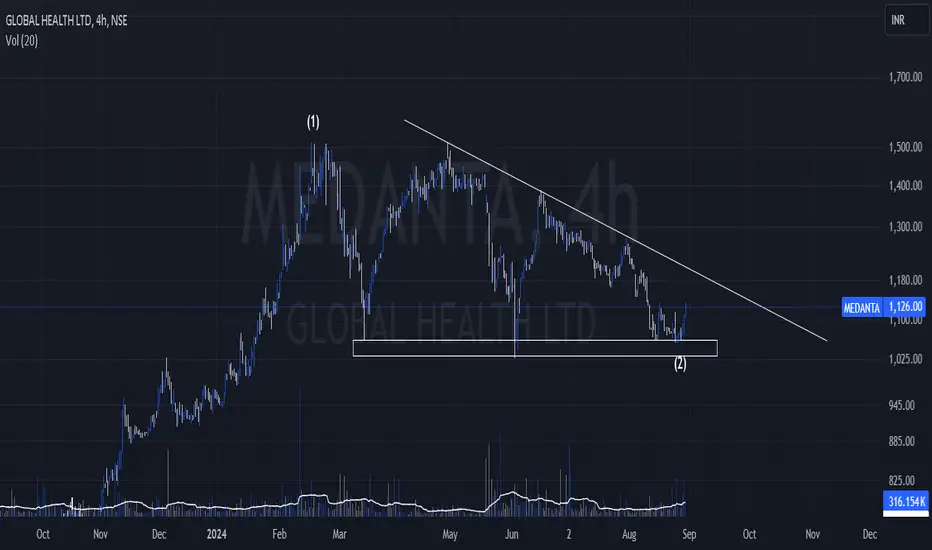
MedantaMedanta (Global Health Ltd)
Cmp 1168
Trendline Breakout with volume
Volume spurt and breakout with volume
Beats estimates and good results
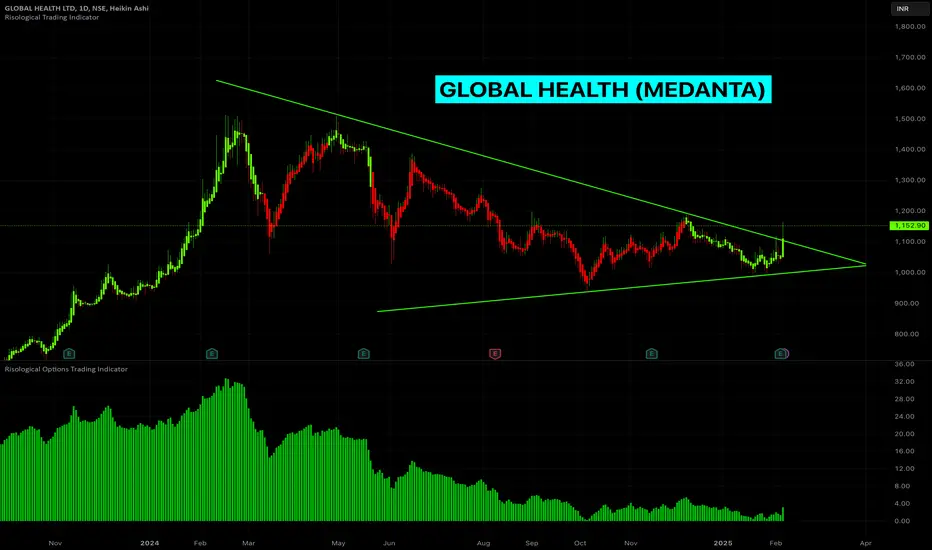
GLOBAL HEALTH LTD - Symmetrical Triangle BreakoutThis is still an open candle and need to wait till this candle closes in GREEN on Friday end of the day. If the candle is green and is clearly breaking out from the triangle on Friday, it is a Bullish sign.
On the daily time frame, the daily candle has closed in GREEN, which is a good sign.
The Risological indicators confirm the bullish movement as seen below.
ENTRY:
The stock can be purchased on the daily time frame as the Risological indicators gave the confirmation
EXIT:
Hold the BUY position till the Risological indicator gives a reversal
Exit on first RED candle close on the daily time frame.
OR, Exit if the Risological options trading indicator turns into RED.
Hope this helps!
Cheers!
__All info = educational only__
Medanta- Pahwa x tweetsMedanta- Pahwa x tweets
1) 320 Concept following
2) One more retest / Consolidation needed
3) Lets see
Medanta - Solid business, solid price chartAfter completing a long correction Medanta is ready for a strong rally
The business is also every growing
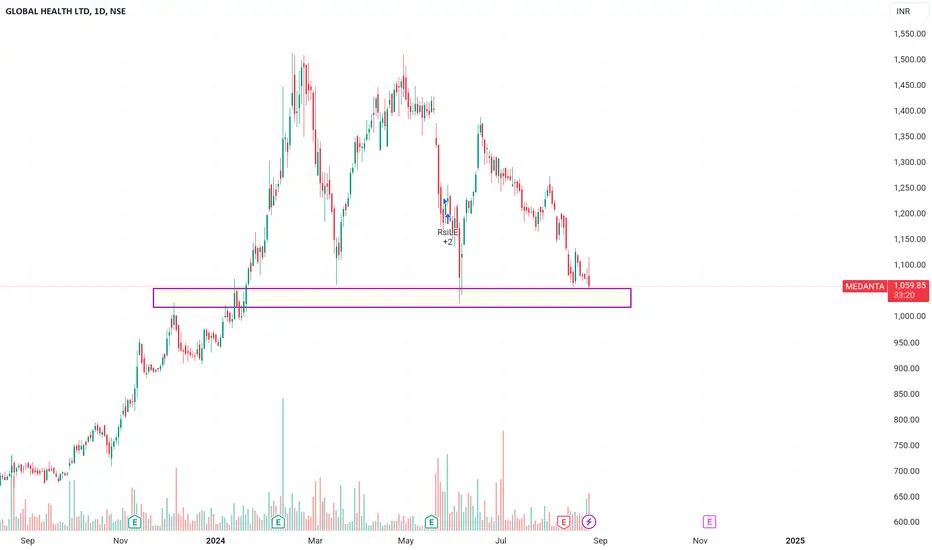
Medanta in demand zoneThe stock has reached its demand zone where it is possible that stock reverse its downward journey and move upside. Possible targets 1150 then 1250.
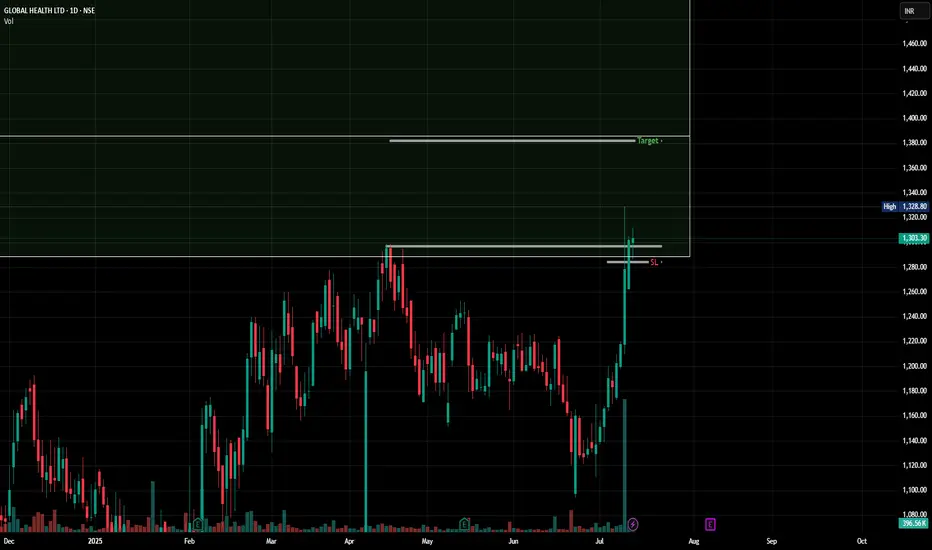
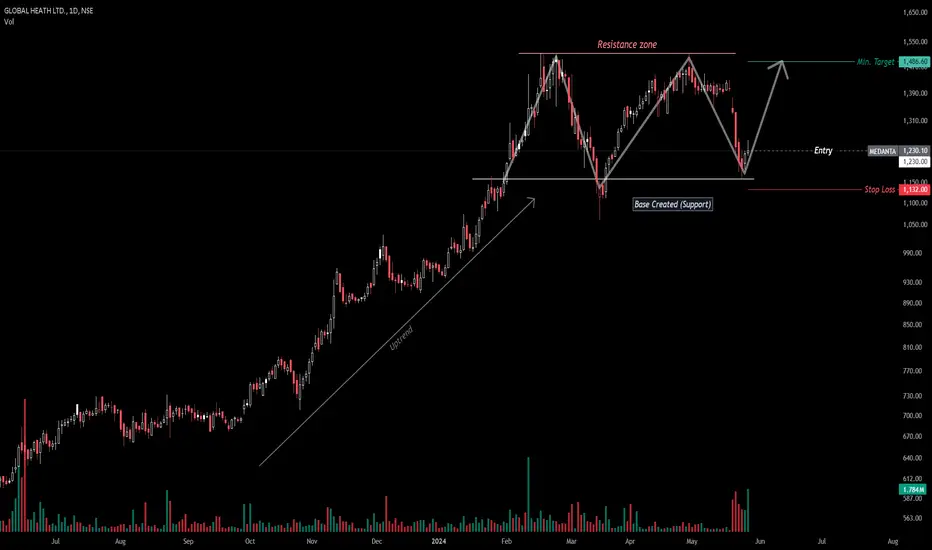
Pullback Trade in Global Health Ltd (MEDANTA)Stock Analysis
Global Health Ltd (MEDANTA) is forming a double bottom pattern.
This setup offers a very favorable risk to reward ratio.
Trading Strategy
Entry Point: Look for a breakout above the 1500 level.
Target and Stop Loss: Levels are plotted on the chart for guidance.
Stop Loss: Set your stop loss as indicated on the chart.
Target: Follow the target level for potential gains.
This pullback trade setup looks promising. Monitor the breakout and trade accordingly!
MEDANTA - Compressing for a explosive move ?We can see Contraction in
Volatility
Volume
Spread
Also we see clustering of Closes. The spring is being compressed for a explosive move. Probability seems to favor a move on the upper side.


ATH breakout #Medanta
Breakout abv 735.
- Constructive Base.
-Higer Relative Strength.
- Price inching towards bluesky.
- Growth YOY
Sales
25.2 %
Profit
73.8 %
-InstHold
21.4 %

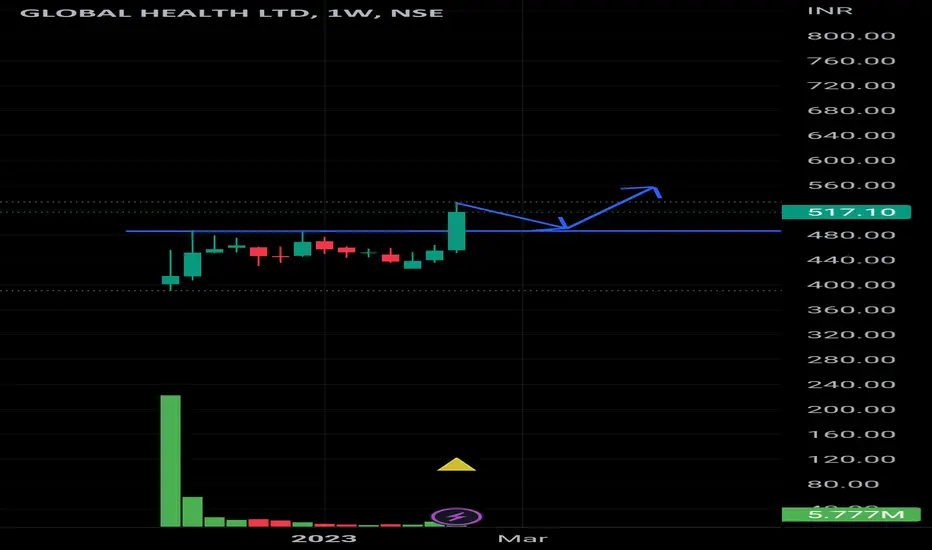
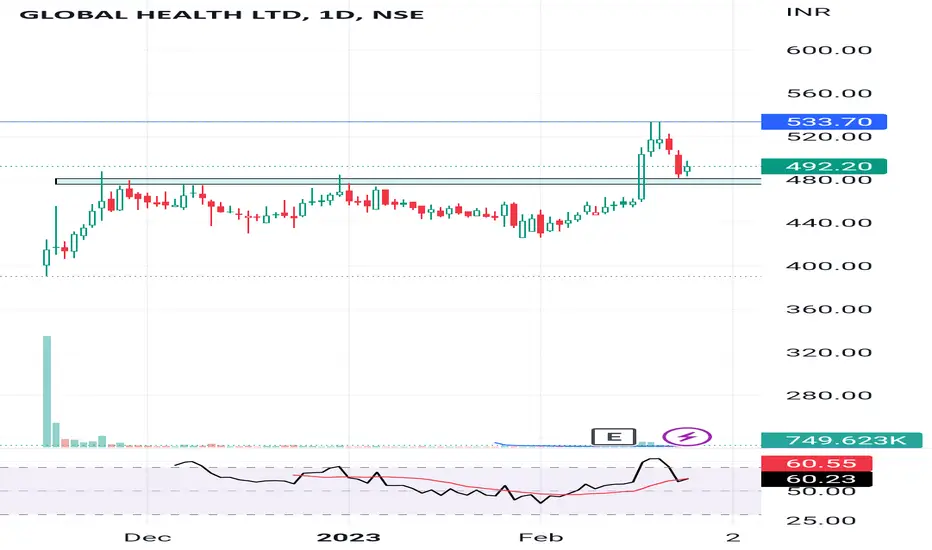
MEDANTA Neat and clean breakout with retest seems to be completed in MEDANTA ..
FII Holdings near 10%
Cmp 490
Sl below 470
TGT 530 then trail SL
Note: Just an idea not any recommendation to buy or sell any security holdings ..
MEDANTA Trading above breakout levelWait for retrace, near 490 to 495
First Target will be 430
Stop loss below trend line weekly basis.