No Dullness Till now.Hello
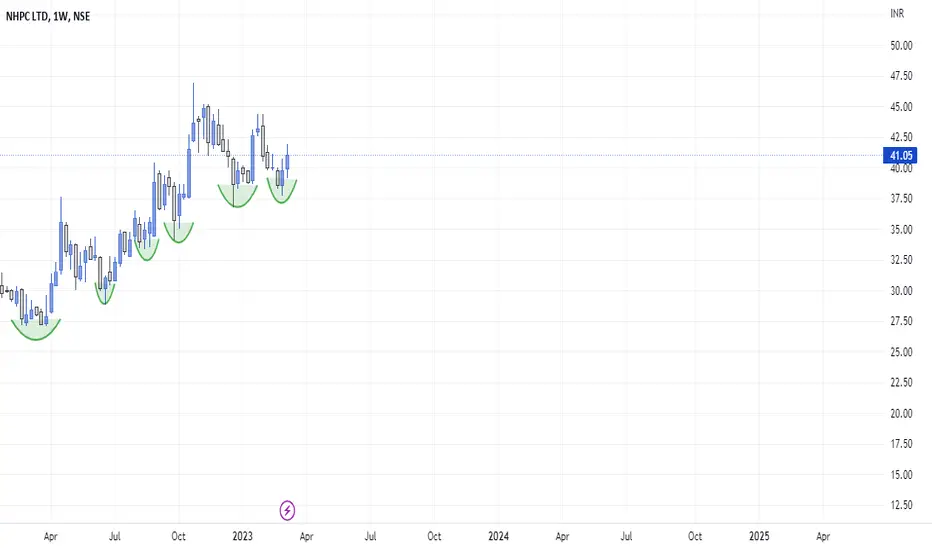
this script is looking in an up Trend as per me I am seeing a lower low and lower high continuously it is holding its lower low since March 2020 a perfect uptrend in this chart until it broke its lower low.
when it is making a low a buy should be punched. very low risk and the reward is great.
Rest you know the best.
Gratify if you appreciate the practice then you can like it, share it and
If you want me to investigate any chart for you then would cherish doing that for you.
Thank you for your time and support.
Stay safe.
NHPC trade ideas
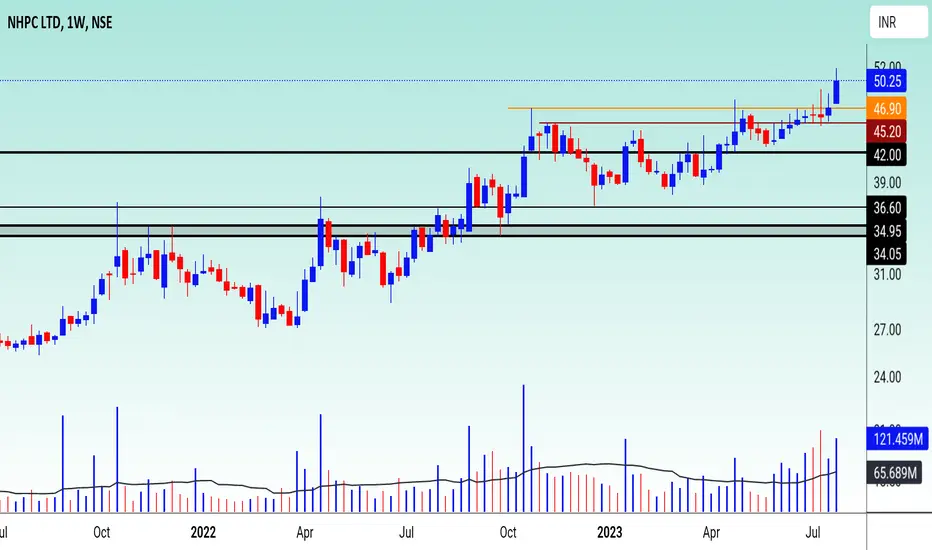
NHPC - Weekly Chart Analysis After breaking out of the rounding base in july-aug 2022 the stock consolidated and form a small base since then. This week it gave a breakout of this base too. Volume support is decent enough. Stock also trading above its key moving averages. Wait for minor confirmations and its good to go.
Disclaimer: This is just an analysis. It should not be considered as a buy/sell recommendation. If you intend to trade this counter then do your own due diligence and trade at your own risk.
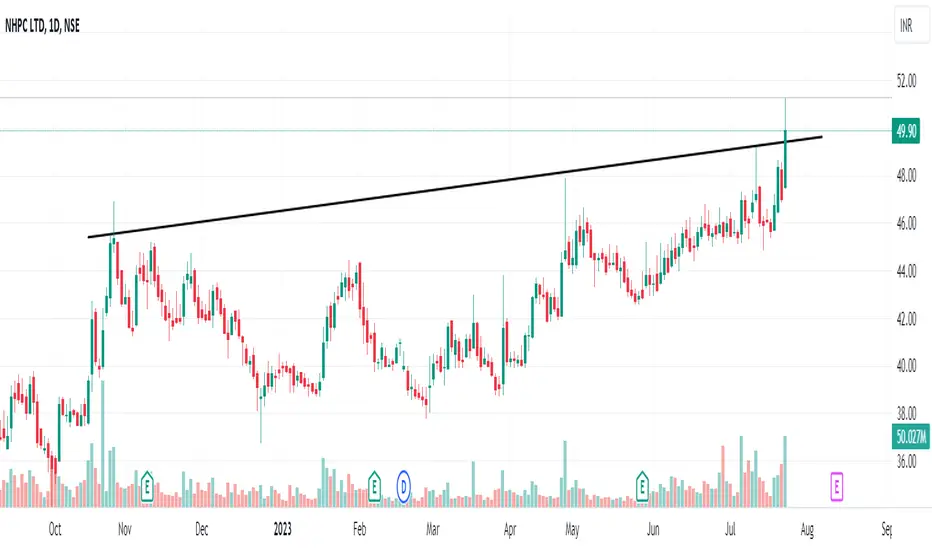
Trendline Breakout
Please look into the chart for a detailed understanding.
Consider these for short-term & swing trades with 2% profit.
For BTST trades consider booking
target for 1% - 2%
For long-term trades look out for resistance drawn above closing.
Please consider these ideas for educational purpose
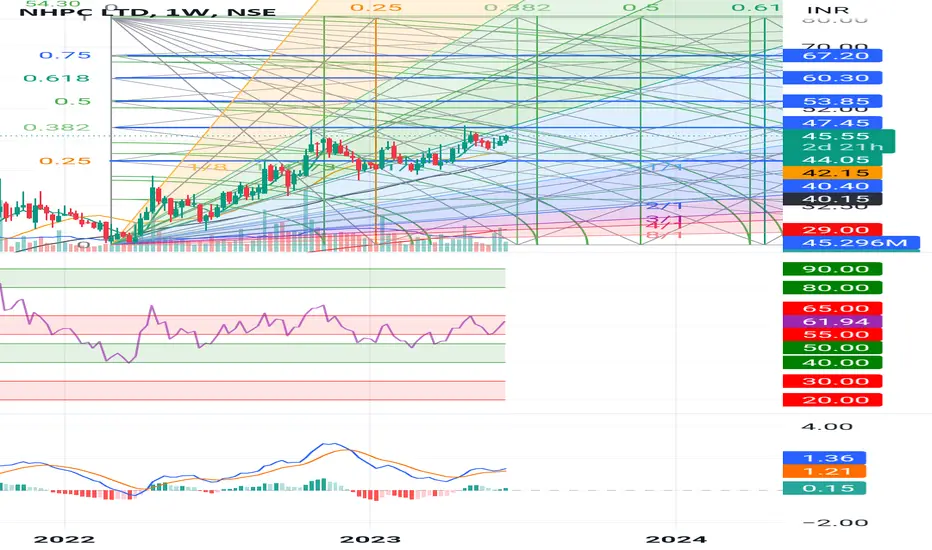
NHPCNHPC : Nice setup right at the Gann square area where a good run is expected.
Volumes are good for the last 3 weeks and RSI picking up it's strength
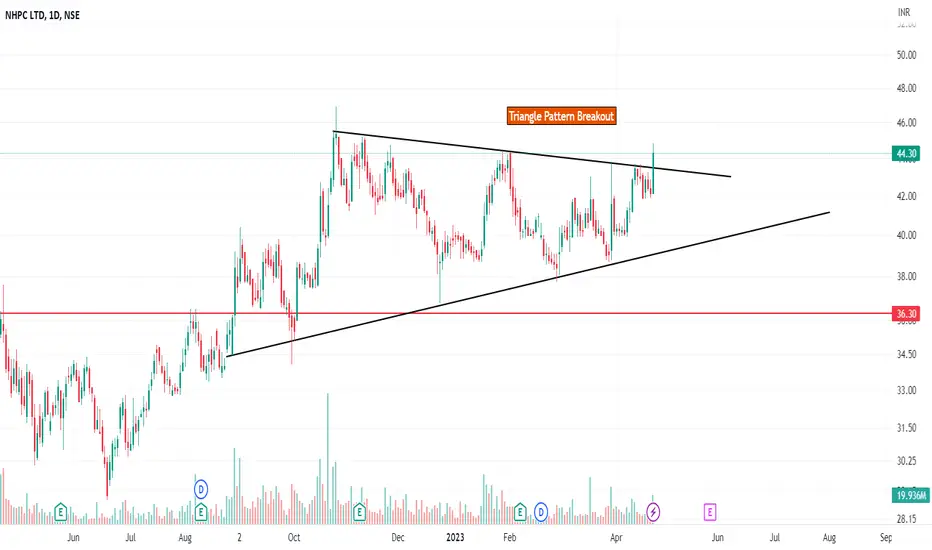
Triangle pattern BreakoutPlease look into the chart for a detailed understanding.
Consider these for short-term & swing trades with 2% profit.
For BTST trades consider booking
target for 1% - 2%
For long-term trades look out for resistance drawn above closing.
Please consider these ideas for educational purpose
NHPC We can enter at small stop loss.
TRADING COMMUNITY
JOIN US ONLY IF YOU WANT PEACE AND PROFIT IN YOUR TRADING LIFE.
I am not a call provider, not SEBI approved person. All the charts and PnL here are for educational purposes. Consult a professional financial advisor before you invest.


NHPC | Swing Long | R/R = 4.3> This is the only PSE stock which appeared to be having the best R/R
> Will consider to be strong if it sustains above A-VWAP: 41.75
> Volatility contraction happening - we might need to wait more time before eventual breakout in any direction.
> Need patience in this market
Note: InvestIn10 would ride this till Momentum exists. The Target & SL are for Swing Investors only.

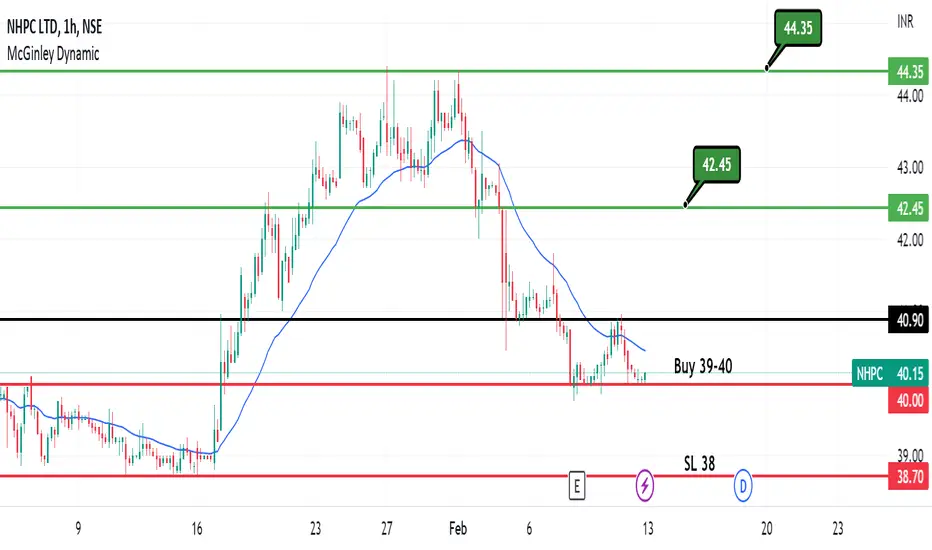
NHPC HOURLY CANDLE...12.02.2023NHPC now in support zone @ 1 hr candle ,will expect 45-48 in short term, all levels are 1 hr candle closing basis
NHPC Ltd. Target 50+++This is only for educational purpose. Do your own analysis before trading and discuss with your financial advisor.

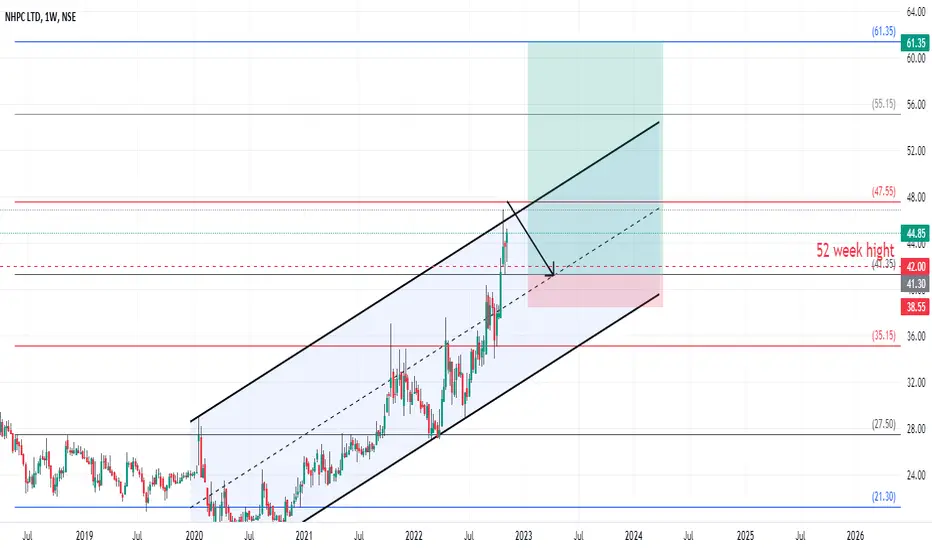
NHPC Stock Rejected or go for retracement ??as per my view NHPC stock going to reject at 47.55 and go for retest at ATH 42 and start rally for upside 61.30 Rs target
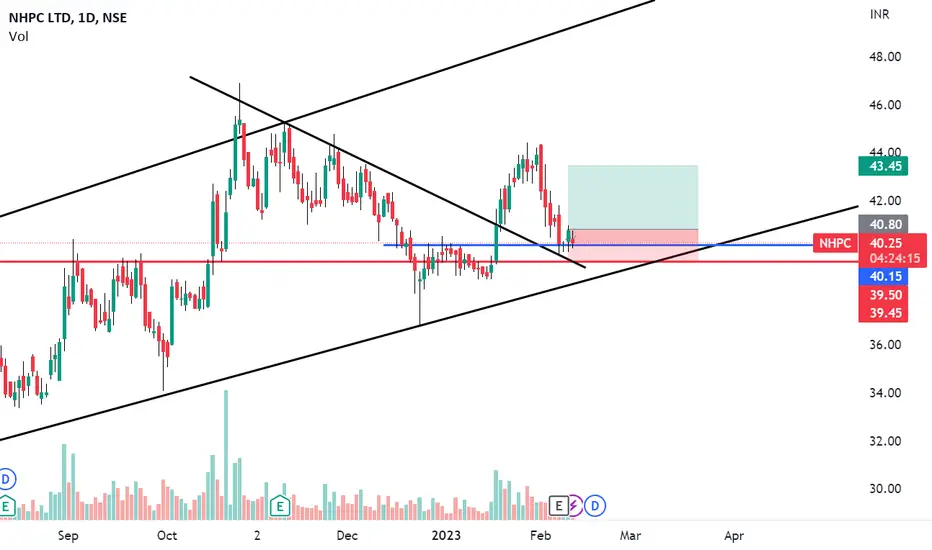
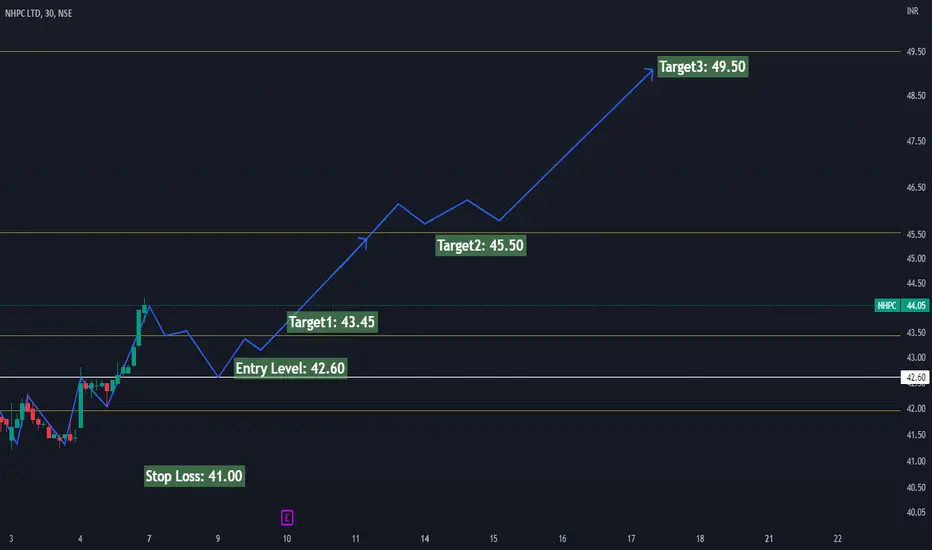
NHPC up side view.It will be best for me to take entry on NSE:NHPC once price retest level of 42.60.
Then hold the same positionally till three targets 43.45, 45.50 & 49.50
Will exit if price trade below level of 41 (only 1.60 point risk)
Note: This is my personal analysis, only for learning.
Thanks.
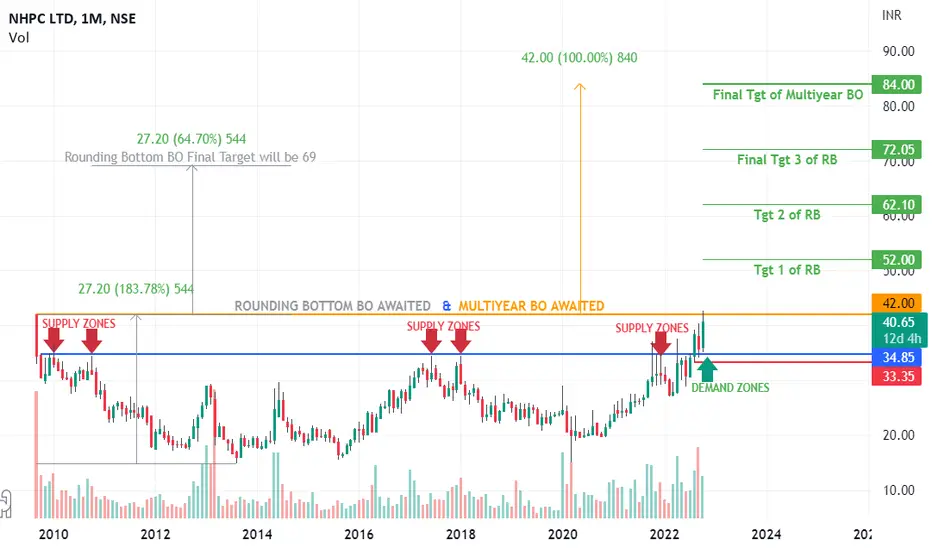
NHPC ROUNDING BOTTOM & MULTIYEAR # NHPC
Chart Time Frame: #MONTHLY
On All Time Frame (D/W/M) the Stock is about to give a Good Breakout of #ROUNDING BOTTOM Pattern & #MULTIYEAR after a long period of #10 years and it is also sustaining above the #Supply Zone from last 3 months which shows that any fall towards 35 will be a great opportunity to add the stock and fundamentals of the stock is also good and a good dividend paying Co.
So as per the Chart Stock looks Good for Long Position for Medium to Long Term as per the Levels given below:
CMP - 40.65 or BoD 35
Target 1 - 52
Target 2 - 62
Target 3 - 72 +
SL - 33.30
Holding Time Frame - Medium to Long Term
All charts posted here are only for EDUCATIONAL PURPOSE
NHPCThere are three possibilities that it can give results, 1) Making pennant pattern on high frame chart.
2) Moving in a two parallel chain.
3) Trading at major resistance levels. wait for the breakout on the upside.
DISCLAIMER:Do your analysis also.

Double the capacity by FY26 - NHPC Renewable energy particularly above mother Earth gaining strength, profits keep on increasing YOY, crucial after 28apr22 for this stock, I expect this stock to TRIPLE from current levels in 1.5 years time frame.

NHPC - Bullish tradeMedium term trade -
Stock is giving a multi year decade long breakout
on big charts.
Stock is about to give a close above 34.50 on
monthly chart since 2010.
Stock is holding strong in this turbulent market.
To me, this is a meaningful breakout and as per
my experience, NHPC has potential to give 20-25%
gain in 6-9 months.
I am a buyer in this stock at CMP, and will add
more units as and when a dip comes around
31-32 levels. Trend is intact unless a closing
below 27 comes on weekly basis.

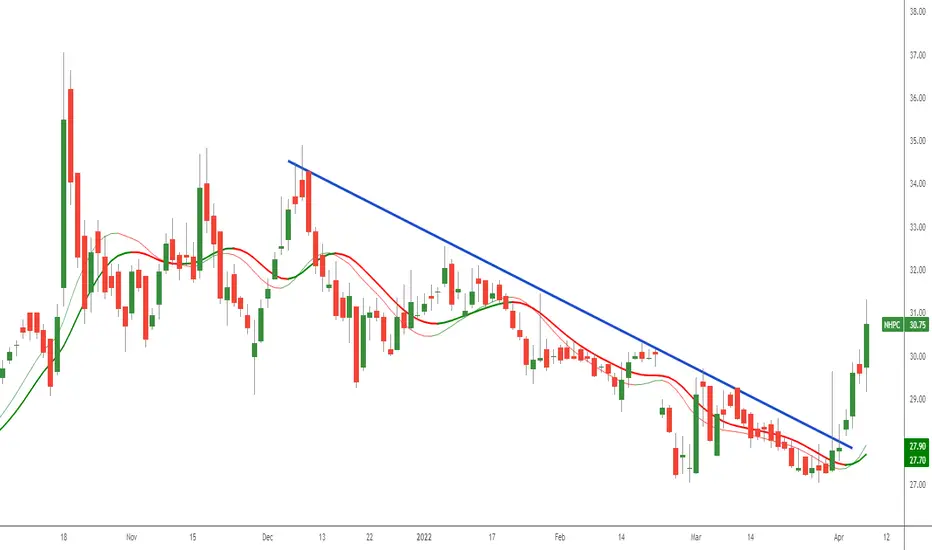
NHPC - cheap renewableStock broke downtrend and is adding momentum. Moving averages have given positive crossover
NHPC STOCK GOING TO DOWN 28.30 RsNHPC is Strong Rejection Zone. It may go 22.90 Rs. This is not time to buy nhpc

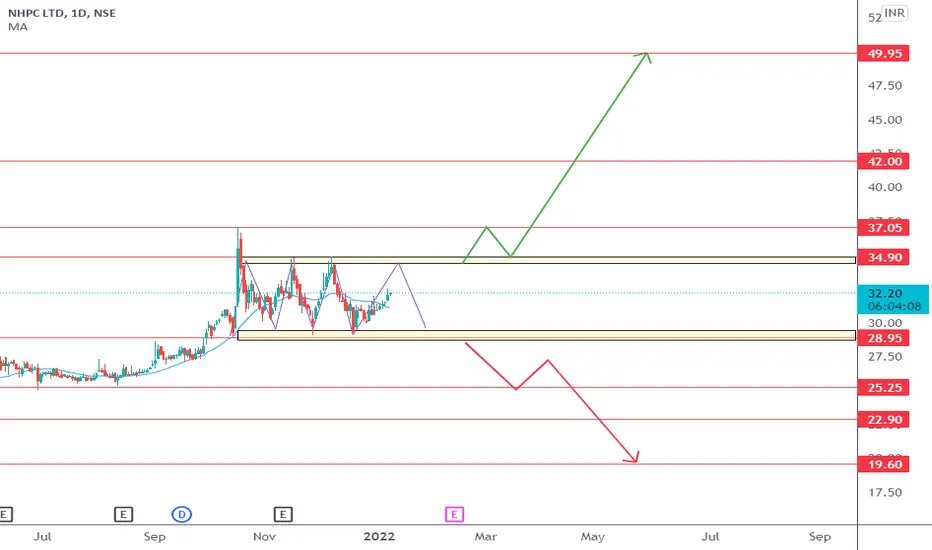
NHPC - range market - prediction and targetNHPC is grinding in a range-bound market and it will break out soon in the coming days. so wait for it. zones and target levels are mentioned in the chart. Or you can trade in a short time frame.
NHPC - SWING FOR LONG SIDETook a reversal in the trend line, price is in the triangle pattern, crossed the 20 EMA and closed above that. once it crosses the pivot range, we can go for long

NHPC Breakout-Retest TradeThe stock has broken out and retested, therefore it may undergo a rally. Trade is supported by Supports Nearby.
Risk Reward Ratio - 3:1
SL is placed below support zone & the upper trendline. The target is placed near swing high.
