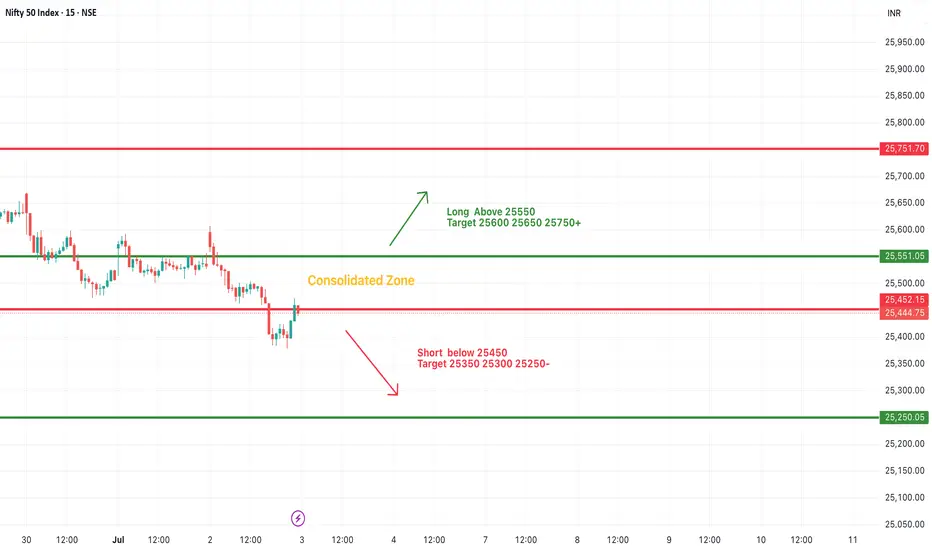
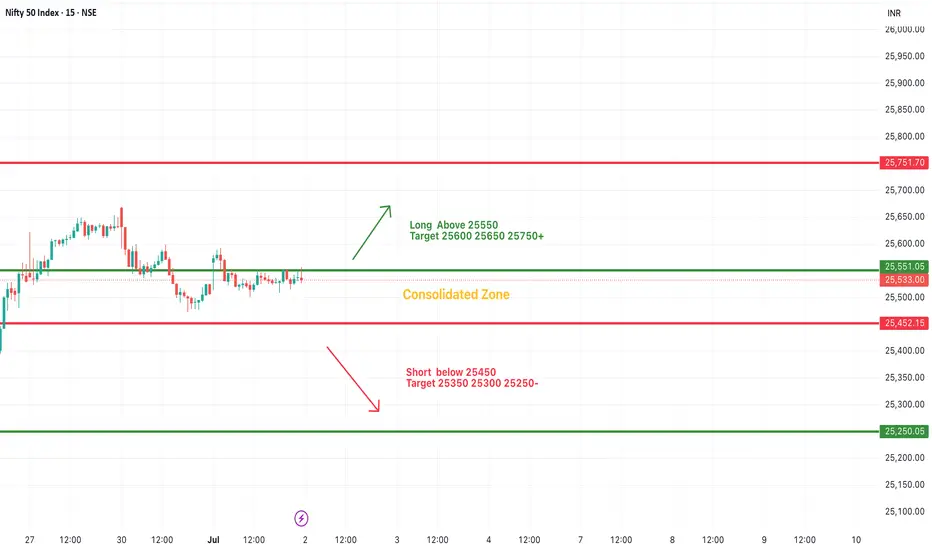
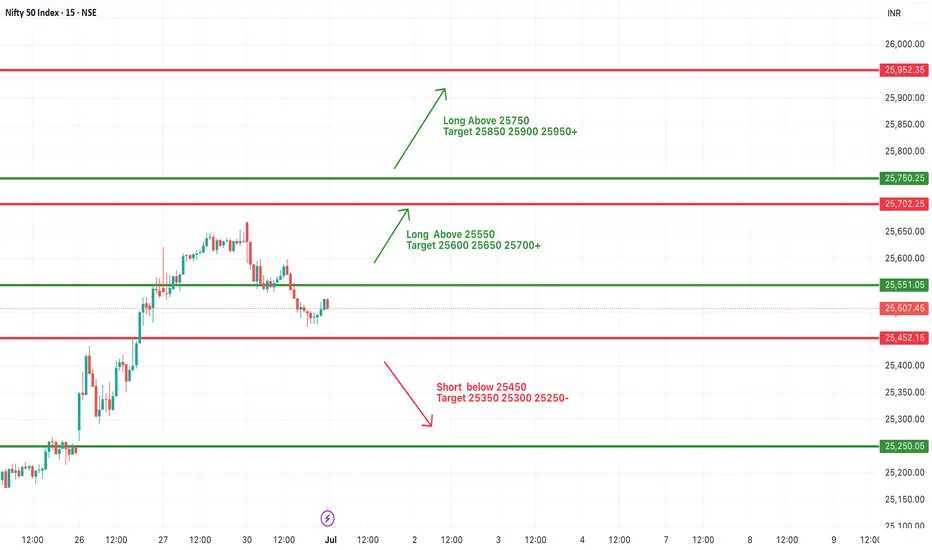
#NIFTY Intraday Support and Resistance Levels - 04/07/2025Nifty is expected to open with a gap-up near the 25500 zone. This places it right around the consolidation zone seen in the previous sessions, between 25400 and 25550. If Nifty sustains above 25550, it may trigger a fresh upward move with immediate targets at 25600, 25650, and potentially 25750+. This breakout level should be watched closely for bullish confirmation before entering long positions.
However, if the index fails to hold above the consolidation zone and slips below 25400, it could open the door for a downside move. A short opportunity may arise below 25400, targeting levels at 25350, 25300, and 25250. This would indicate a breakdown from the consolidation and suggest renewed selling pressure.
Traders should remain cautious within the consolidation range and act only on confirmed breakout or breakdown levels.
NIFTY trade ideas

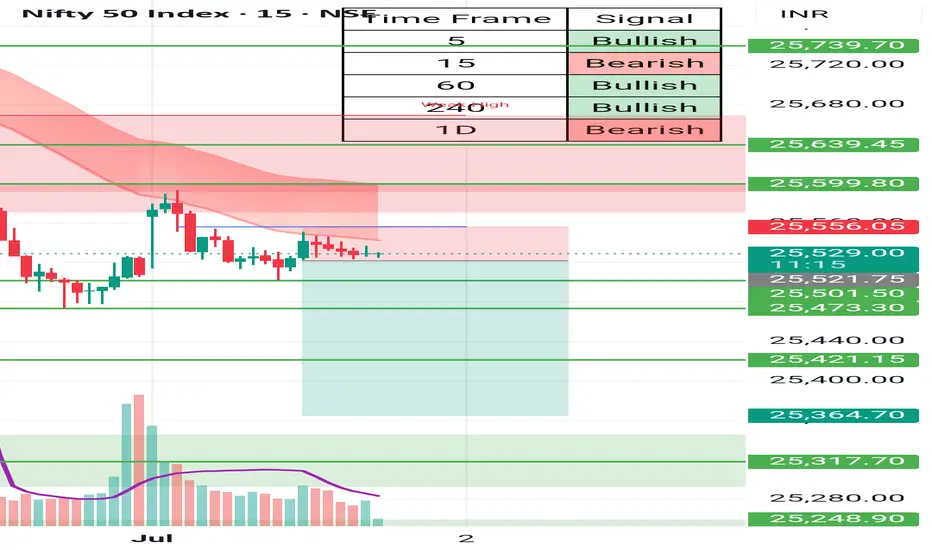
The Nifty 50 index closed at 25,405.30 on July 3, 2025The Nifty 50 index closed at 25,405.30 on July 3, 2025, down 0.19% from the previous day, reflecting a cautious market sentiment amid mixed global cues and domestic profit-booking. Here's a detailed Chart analysis based on available data
Disclaimer --
This analysis is based on recent technical data and market sentiment from web sources. It is for informational purposes only and not financial advice. Trading involves high risks, and past performance does not guarantee future results. Always conduct your own research or consult a SEBI-registered advisor before trading.
#Boost and comment will be highly appreciated
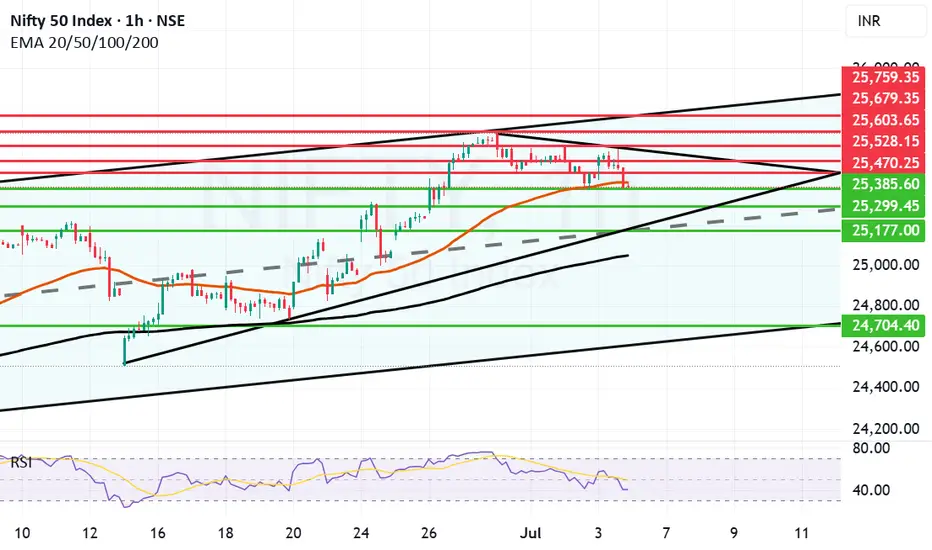
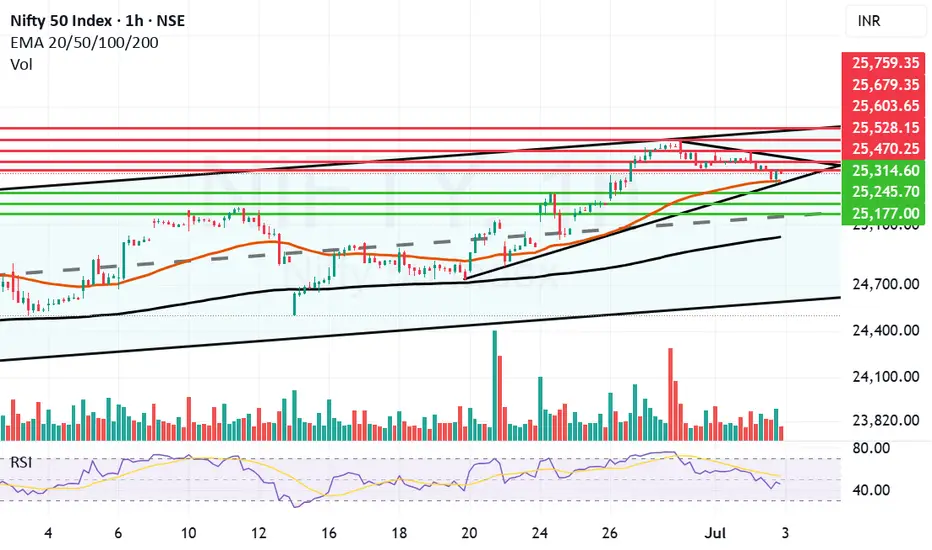
Nifty facing strong resistance between 25587 and 25500. Nifty today again failed to hold levels above 25500 as it made a high of 25587 and closed at 25405. Closing almost 182 point from its high today and 48 points down from yesterday. This is a worrying sign even if just slightly as for moving towards 26K we need a strong closing of the week at least above the Mother line. Nifty closed just below Motherline today which is showing some weakness in the rally which seems to be losing direction. The fear of Tariffs seems to be taking toll on Bulls whereas bears are currently gaining strength. The closing we get tomorrow will indicate a definitive direction to Nifty.
The Supports for Nifty currently remain at: 25385, 25299, 25177 (strong trend line support) and finally we will have Father line support of Hourly candles which is at 25050. Closing 25050 below will have potential to drag Nifty further down towards 24700 which is again a strong Channel bottom support.
The Resistances for Nifty currently remain at: 25416 (Mother line Resistance), 25470, The zone between 25500 and 25587 is a strong Trend line resistance. A closing above 25587 will have potential to take Nifty towards 25603, 25679 or even 25759 (Which is again a strong Channel top resistance).
Disclaimer: The above information is provided for educational purpose, analysis and paper trading only. Please don't treat this as a buy or sell recommendation for the stock or index. The Techno-Funda analysis is based on data that is more than 3 months old. Supports and Resistances are determined by historic past peaks and Valley in the chart. Many other indicators and patterns like EMA, RSI, MACD, Volumes, Fibonacci, parallel channel etc. use historic data which is 3 months or older cyclical points. There is no guarantee they will work in future as markets are highly volatile and swings in prices are also due to macro and micro factors based on actions taken by the company as well as region and global events. Equity investment is subject to risks. I or my clients or family members might have positions in the stocks that we mention in our educational posts. We will not be responsible for any Profit or loss that may occur due to any financial decision taken based on any data provided in this message. Do consult your investment advisor before taking any financial decisions. Stop losses should be an important part of any investment in equity.
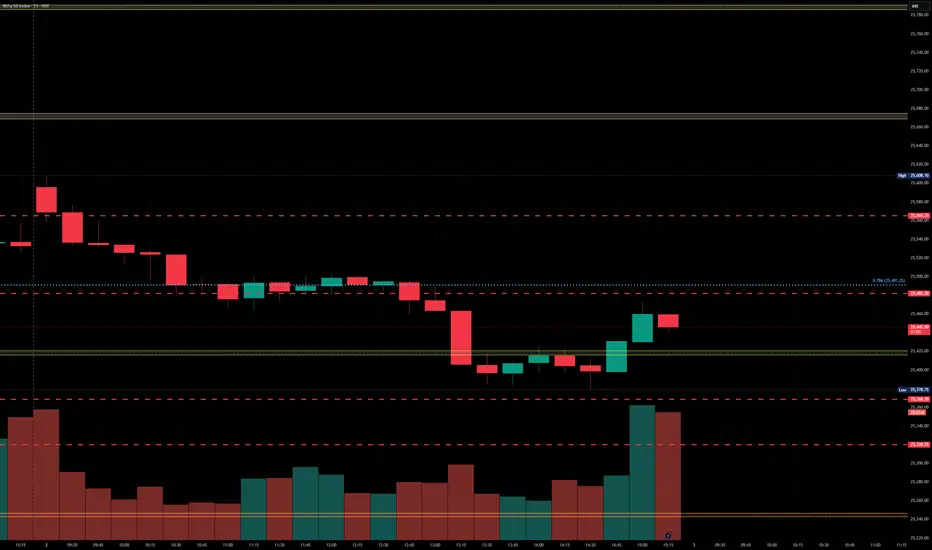
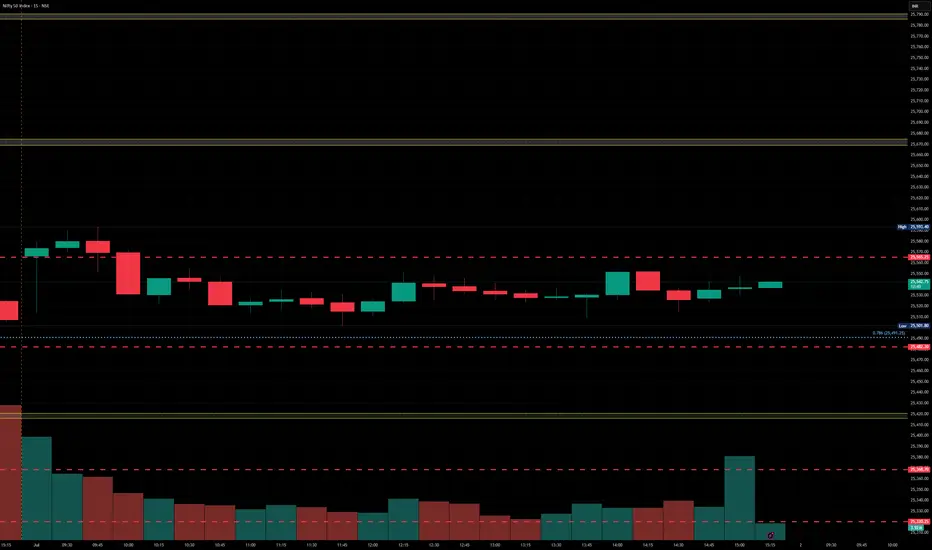
Nifty levels - Jul 04, 2025Nifty support and resistance levels are valuable tools for making informed trading decisions, specifically when combined with the analysis of 5-minute timeframe candlesticks and VWAP. By closely monitoring these levels and observing the price movements within this timeframe, traders can enhance the accuracy of their entry and exit points. It is important to bear in mind that support and resistance levels are not fixed, and they can change over time as market conditions evolve.
The dashed lines on the chart indicate the reaction levels, serving as additional points of significance to consider. Furthermore, take note of the response at the levels of the High, Low, and Close values from the day prior.
We hope you find this information beneficial in your trading endeavors.
* If you found the idea appealing, kindly tap the Boost icon located below the chart. We encourage you to share your thoughts and comments regarding it.
Wishing you success in your trading activities!

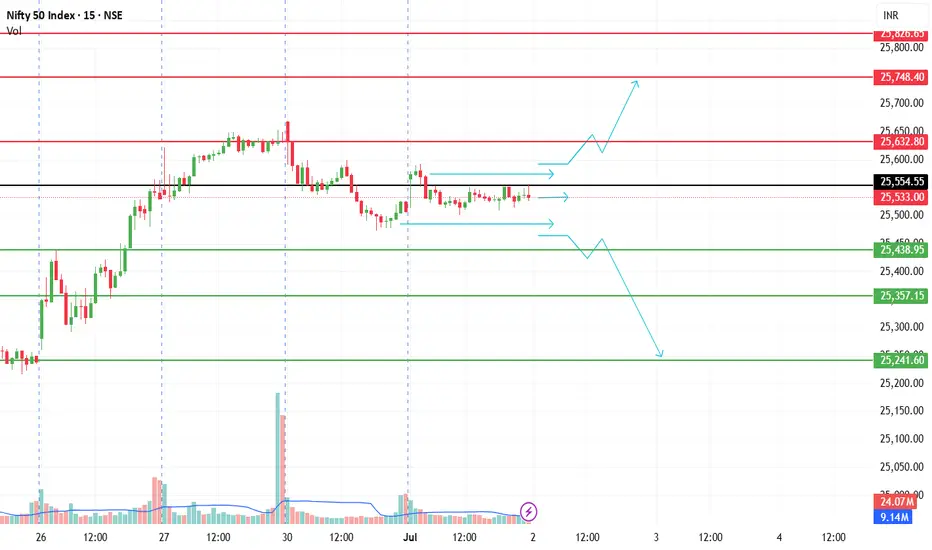
#NIFTY Intraday Support and Resistance Levels - 03/07/2025Nifty is expected to open flat near the 25,450 level, continuing to trade within a consolidation zone. The market has recently shown signs of indecisiveness, with price movement confined between 25,550 resistance and 25,250 support. Until a clear breakout or breakdown occurs, price action may remain range-bound.
If Nifty sustains above the 25,550 level, it can trigger fresh momentum toward 25,600, 25,650, and even 25,750+. On the downside, if it breaks and trades below 25,450, we may see selling pressure accelerating toward 25,350, 25,300, and 25,250.
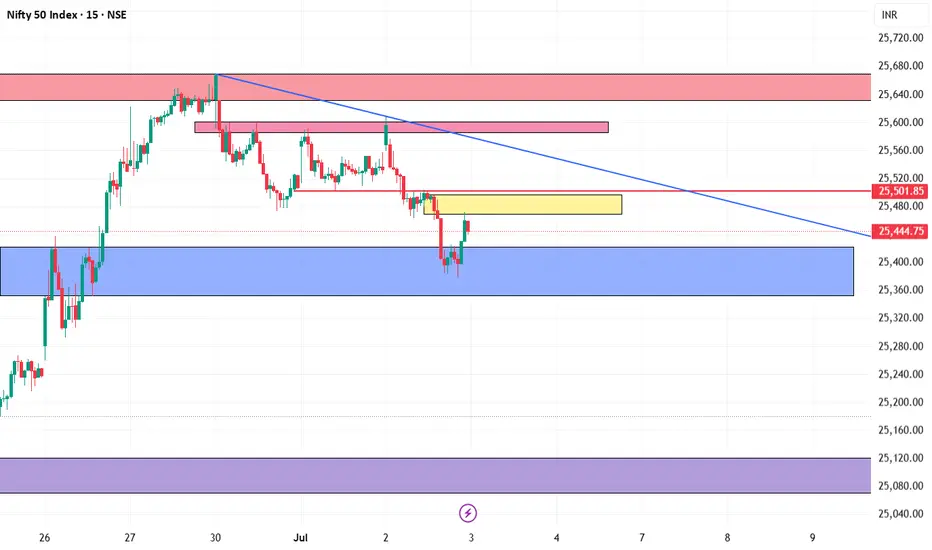
Nifty 50 index chart analysis for tommorrowHere I m sharing of Nifty 50 index chart for 3rd July 2025, in chart you can see many boxes that are indicating of Support and Resistance. if break then you trade buy or sell. you can understand
....
Nifty took support at the Mother line and trying to recoverNifty has taken support at the Mother line today and tried to post a recovery. Again proving our Mother, Father and small Child theory correct. To know more about the Mother father and small Child theory of stock market. Read my book THE HAPPY CANDLES WAY TO WEALTH CREATION. Nifty during the day made a low of 25378 and closed the day at 25453. It is not a strong recovery nevertheless the recover of 75 points recovery which makes shadow of the candle neutral to positive. Let us see if Nifty can recovery fully tomorrow or Friday to close the week in positive.
Nifty Supports remain at: 25396 (Mother Line Support which is also near the trend line support at 25378), there there is a support at 25245 and finally mid channel support near 25177. Closing below 25177 will make the Bears more powerful and they can drag the index further down towards Father line support near 25108.
Nifty Resistances remain at: 25470, 25528 (Trend line resistance), 25603 and finally 25679. 25759 seems to be the channel top currently in the hourly parallel channel.
Disclaimer: The above information is provided for educational purpose, analysis and paper trading only. Please don't treat this as a buy or sell recommendation for the stock or index. The Techno-Funda analysis is based on data that is more than 3 months old. Supports and Resistances are determined by historic past peaks and Valley in the chart. Many other indicators and patterns like EMA, RSI, MACD, Volumes, Fibonacci, parallel channel etc. use historic data which is 3 months or older cyclical points. There is no guarantee they will work in future as markets are highly volatile and swings in prices are also due to macro and micro factors based on actions taken by the company as well as region and global events. Equity investment is subject to risks. I or my clients or family members might have positions in the stocks that we mention in our educational posts. We will not be responsible for any Profit or loss that may occur due to any financial decision taken based on any data provided in this message. Do consult your investment advisor before taking any financial decisions. Stop losses should be an important part of any investment in equity.
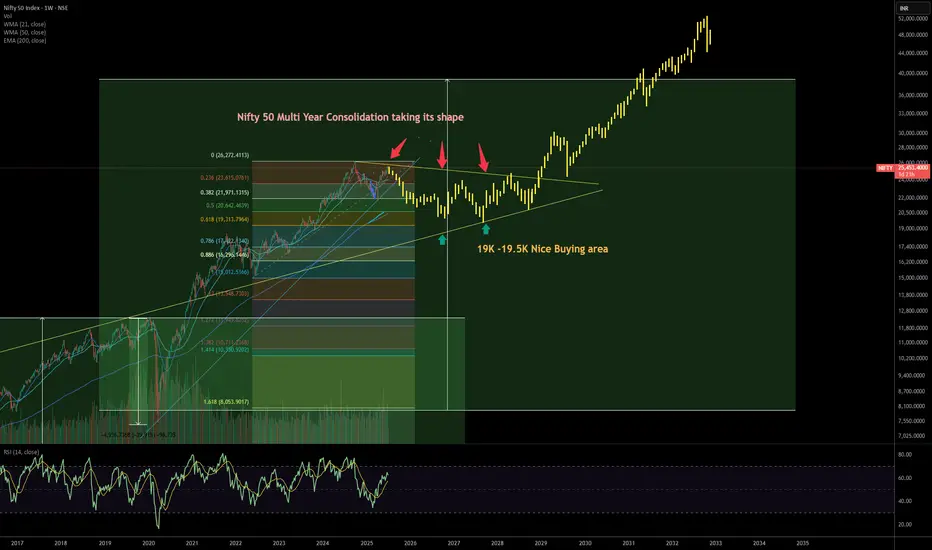
Nifty 50’s Long-Term-Unpacking the Multi-Year ConsolidationChart showcases the Nifty 50 Index on a weekly timeframe, highlighted with multi-year consolidation patterns, key Fibonacci retracement levels, and a suggested buy zone—here’s a compelling publishing idea tailored for both traders and long-term investors:
Nifty levels - Jul 03, 2025Nifty support and resistance levels are valuable tools for making informed trading decisions, specifically when combined with the analysis of 5-minute timeframe candlesticks and VWAP. By closely monitoring these levels and observing the price movements within this timeframe, traders can enhance the accuracy of their entry and exit points. It is important to bear in mind that support and resistance levels are not fixed, and they can change over time as market conditions evolve.
The dashed lines on the chart indicate the reaction levels, serving as additional points of significance to consider. Furthermore, take note of the response at the levels of the High, Low, and Close values from the day prior.
We hope you find this information beneficial in your trading endeavors.
* If you found the idea appealing, kindly tap the Boost icon located below the chart. We encourage you to share your thoughts and comments regarding it.
Wishing you success in your trading activities!
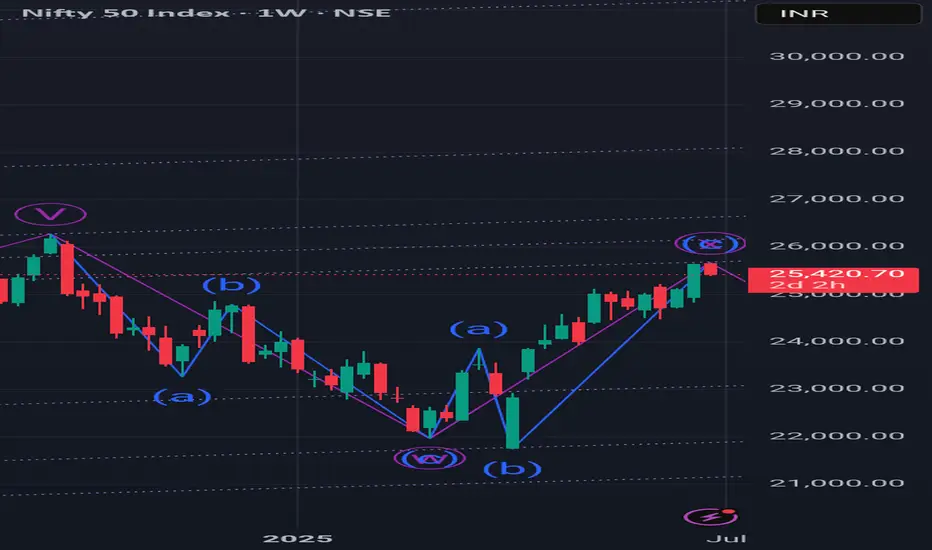
Wave counts on larger TFThis is how I see Nifty wave count on a Larger TF. We are currently in wave 4 correction of after covid bull run of wave 3. We have corrected 0.236 of this post covid growth by Feb's end and going to correct up to 0.382 level now.
#NIFTY Intraday Support and Resistance Levels - 02/07/2025Nifty is expected to open flat near the 25,530 level, right in the middle of the consolidation zone between 25,450 and 25,550. This range has acted as a tight resistance and support band in recent sessions, indicating indecision in the market. A breakout above 25,550 can trigger bullish momentum toward 25,600, 25,650, and even 25,750+ levels, while staying within this zone may continue the sideways trend.
On the downside, if Nifty breaks below the 25,450 level, we may see selling pressure taking it toward 25,350, 25,300, or even 25,250. Traders are advised to wait for a clear breakout from this consolidation band before entering directional trades, and maintain proper risk management given the tight range and potential volatility
NIFTY VIEW FOR 02-07-2025Dear Trader, One more day coming for SIDEWAY market. unfortunately
Bullish -> if OPEN above 25550, 25750 will be the resistance and may volatile between 25600 and 25750.
Bearish -> if OPEN below 25450, 25250 will be the support and may slip to 25050
Sideway -> if OPEN around 25500, market will be ranging in-between 25550 to 25450
Thank You, Rest will be after OPENING, Have a profitable day!
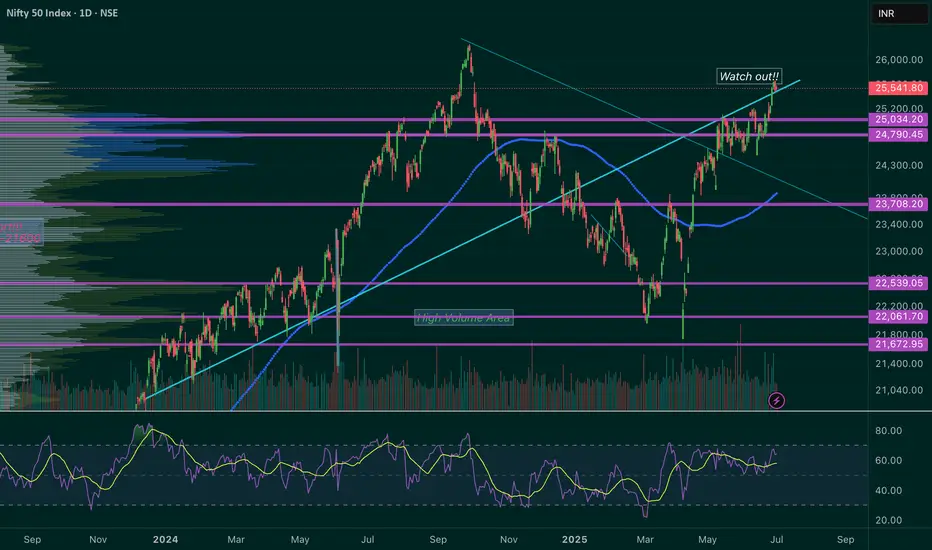
NIFTY is Testing its long term Trend Line.I’ve been keeping an eye on the ‘Watch Out’ area and the trend line that’s being tested. I’ve been following this trend line for a while now, and I’m excited to share some potential scenarios that could unfold in July.
Here are a few things to keep in mind:
1. The 25450 - 25550 range could become a key resistance and support area.
2. If NIFTY successfully retests this trend line and shows some upward movement, the next target could be 26000. In this case, I would recommend buying July 26000 Call options.
3. If NIFTY can’t hold this retest (which is less likely given NSE:NIFTY the current bullish market sentiment), our next watchout zone could be 25000 - 24800.
4. We might even be seeing an all-time high NIFTY soon!
Disclaimer: Please do your own research before investing. This is just my personal opinion, and I don’t force anyone to invest based on my ideas.
Nifty levels - Jul 02, 2025Nifty support and resistance levels are valuable tools for making informed trading decisions, specifically when combined with the analysis of 5-minute timeframe candlesticks and VWAP. By closely monitoring these levels and observing the price movements within this timeframe, traders can enhance the accuracy of their entry and exit points. It is important to bear in mind that support and resistance levels are not fixed, and they can change over time as market conditions evolve.
The dashed lines on the chart indicate the reaction levels, serving as additional points of significance to consider. Furthermore, take note of the response at the levels of the High, Low, and Close values from the day prior.
We hope you find this information beneficial in your trading endeavors.
* If you found the idea appealing, kindly tap the Boost icon located below the chart. We encourage you to share your thoughts and comments regarding it.
Wishing you success in your trading activities!
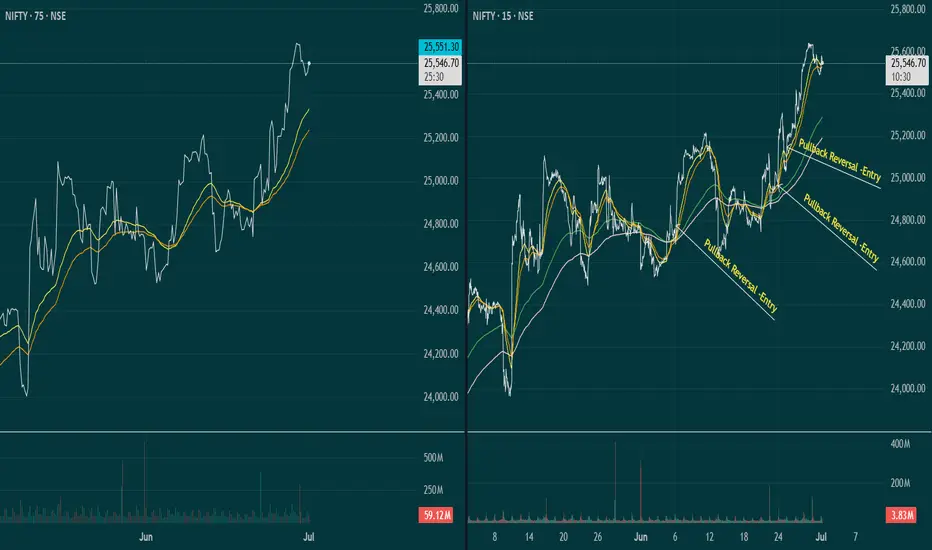
Multi timeframe Pullback reversal entriesThis is very simple but yet effective way of trading. Entry through Multi timeframe analysis. Price riding on MA ( respecting MA levels) and at Pullback - we can enter at reversal in lower time frame once price started riding MA. Though this is very basic - but very effective as this can be applied in timeframe. The sync between higher and lower timeframe for entry. We can exit as per out trade rules - either lower TF MA breach or Higher TF. Entry with proper calculation of Risk Reward only. This is the basic strategy of trend following specially for learners and practicing trading. Even season traders use this. MA period can be arranged as per suitability. Here I have applied 30/50.
This for educational and learning purpose only. Enter trading post proper practice only.
Views are highly welcome.
#NIFTY Intraday Support and Resistance Levels - 01/07/2025Nifty is expected to open with a slight gap up near the 25,550 level, which lies close to a minor resistance zone. If the index manages to sustain above this region, we may see a continuation of bullish momentum with potential upside levels at 25,600, 25,650, and 25,700. Holding above 25,550 would signal strength, supported by recent recovery attempts from lower levels.
However, if the index fails to hold above 25,550 and starts slipping below 25,450, weakness may creep in. A fall below 25,450 could open the door for downside targets of 25,350, 25,300, and possibly 25,250. Traders should stay cautious around the 25,550–25,600 zone for a clear directional move, with strict stop losses on both sides.
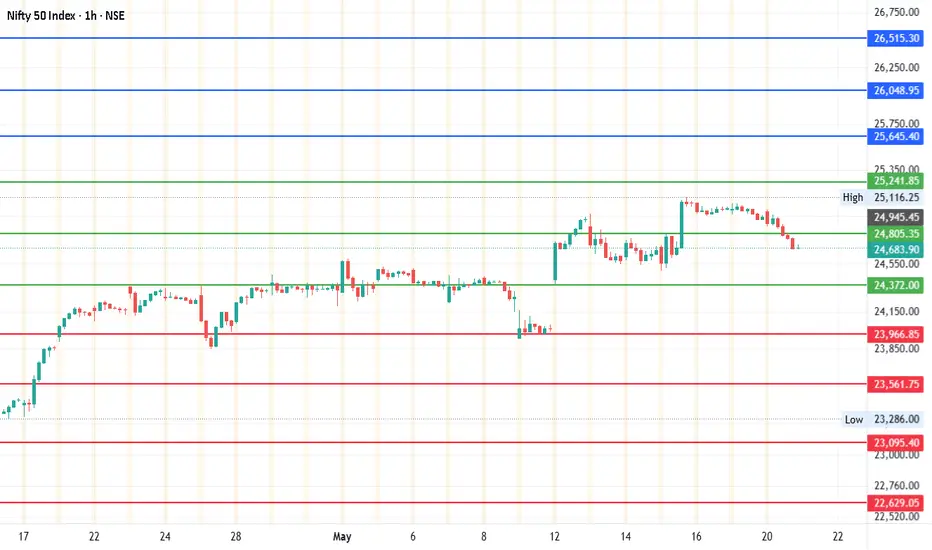
#Nifty - 1500 Points Move Expected?Date: 20-05-2025
#Nifty Current Price: 24683.9
Mid-Point: 24805.35
Upside Targets: 25645.39, 26048.95, 26515.30 and 26981.65
Downside Targets: 23966.86, 23561.75, 23095.40 and 22629.05
Support: 24371.97
Resistance: 25241.83
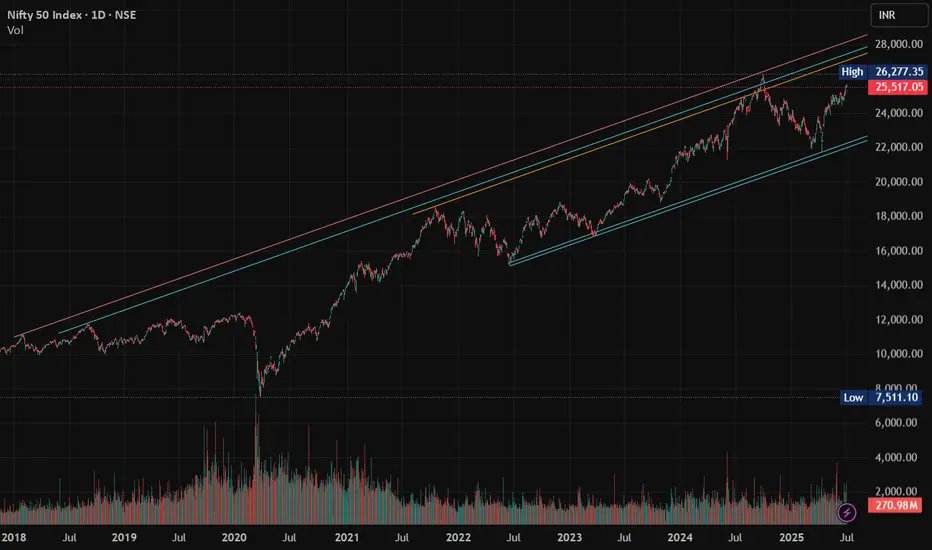
nifty view .. bullish nifty is in bullish cahnnel. itmay touch 26180 , 27000, 27254 ,27861 by the end of 2026 or mid 2027.
enjoy 27000 crossing in 2027
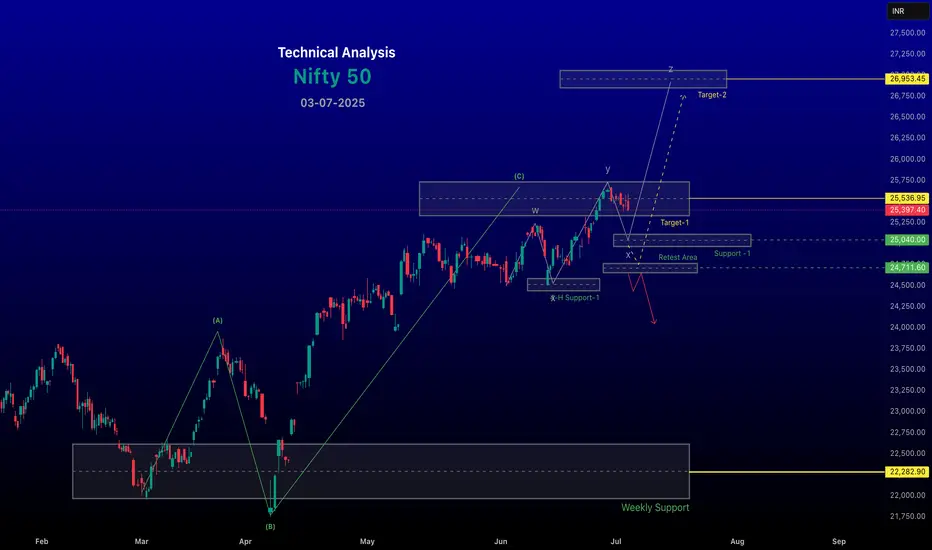
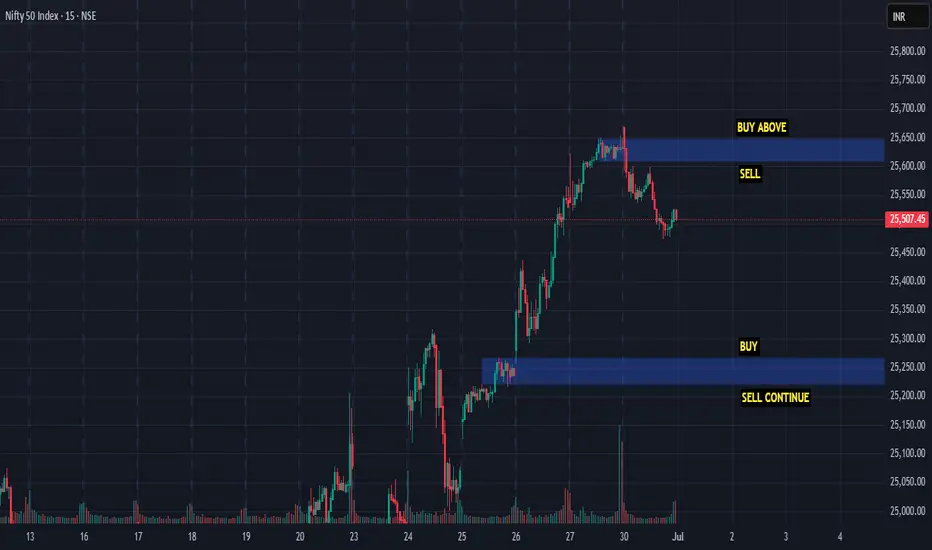
NIFTY Short Term View <25650-25200>If you follow my other ideas, I think you are gaining trust on the tool ZZ. Please don't blindly follow me and my posts. I just want to make you curios that one tool with clear idea is enough to predict the market. But condition is you have to practice a ton.
Here I am sharing just glimpse of it, there are so many things to do with ZZ.
Keep learning || Trust analysis || Keep Trading & Investing
Any question or suggestion please feel free to comment below.
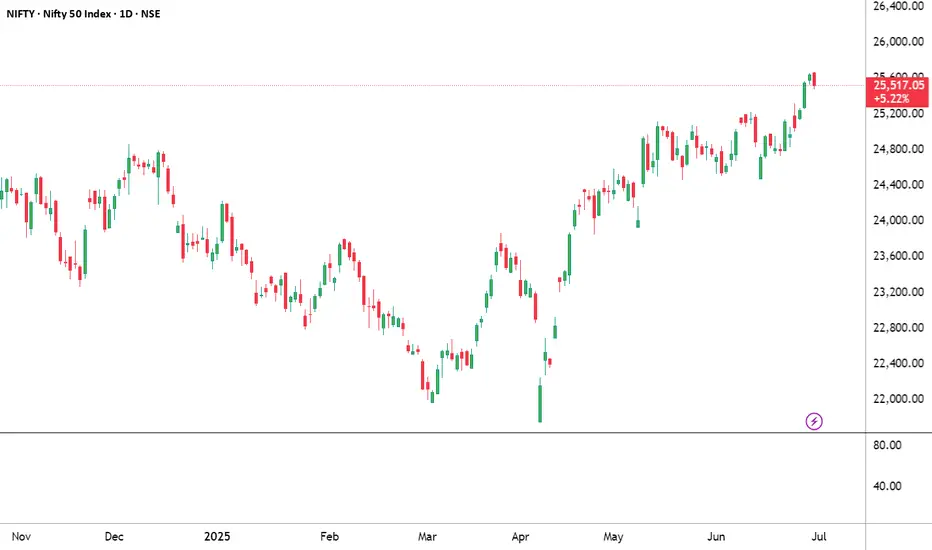
NIFTY THIS WEEK? What's the plan
"There’s more hidden in a candle chart than most headlines will ever reveal.”
If you look at this NIFTY chart casually, you’ll see just another uptrend. But if you feel the price — really look into the structure — you’ll notice something deeper:
We’re not just in a rally. We’re in a breakout after base-building. And that’s a very different game.
What I Noticed This Week:
1. Strong Follow-Through
NIFTY didn’t just pop — it’s sustaining gains. Each green candle is following the next without hesitation. That means institutions are buying, not just retailers reacting.
2. Previous Resistance = Gone
Look back at 25,200–25,300. That zone rejected price multiple times. Now? It’s broken clean, with a bullish Marubozu-style candle. That’s a confirmation, not just a fluke.
3. No Panic Selling Yet
Usually, breakouts invite profit booking. This one? Sellers are quiet. When there's no rejection at new highs, it tells you confidence is strong.
But Here’s What You Must Watch:
Are we near psychological exhaustion? Markets can get euphoric and overextend - even in strong trends. Volume Spike or Divergence? If volumes dry or RSI starts diverging, stay alert.
Global cues & Bank Nifty:
If Bank Nifty stalls, NIFTY will slow too. Watch correlation.
What This Means for You:
Trend is strong, but smart traders plan exits in upmoves - not panic in downmoves.
Ask yourself:
Do you have entries based on structure?
Are you overexposed at highs, hoping for more?
Are you following momentum blindly or with plan?
Personal Reflection:
I’ve learned this the hard way:
“Buying strength is good. But riding strength without a stop loss is just greed in disguise.”
So this week:
Observe, don’t chase.
Track - don’t blindly enter.
There’s always another breakout. But there’s only one portfolio.
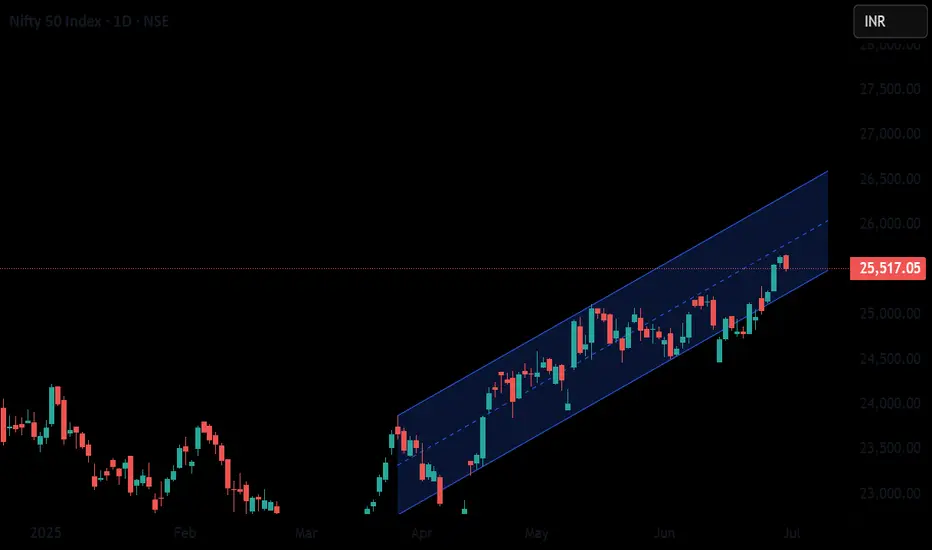
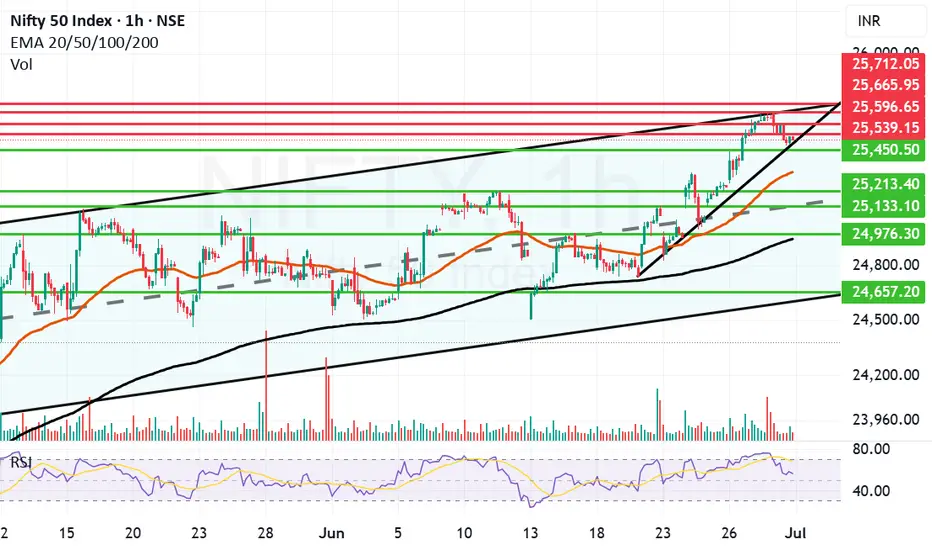
Nifty goes into consolidation mode to end the month at 25500.Today Nifty went into consolidation mode searching for the supports nearby after a massive upward run in the last week. Even though we saw Nift climbing down 120 points today the closing above 25500 is a good sign. It was a volatile day where Nifty made a high of 25669 and a low of 25473 moving 200 points down. But recovered a bit to close at 25517.
The Supports for Nifty remain at: 25450, 25321 (Mother line Support), 25133 (Mid-channel support). If that is broken the Nifty may fall further towards 24976 or 24956 (Which is the Father line support). Channel bottom seems to be at 24657. If we get a closing below this zone we will comment about further supports on the down side.
The Resistance for Nifty remain at: 24539, 24596, 25665 and finally 25712. (25712 seems to be the channel and trend top. Once Nifty closes above this zone we will be able to comment about further levels on the upside.
Disclaimer: The above information is provided for educational purpose, analysis and paper trading only. Please don't treat this as a buy or sell recommendation for the stock or index. The Techno-Funda analysis is based on data that is more than 3 months old. Supports and Resistances are determined by historic past peaks and Valley in the chart. Many other indicators and patterns like EMA, RSI, MACD, Volumes, Fibonacci, parallel channel etc. use historic data which is 3 months or older cyclical points. There is no guarantee they will work in future as markets are highly volatile and swings in prices are also due to macro and micro factors based on actions taken by the company as well as region and global events. Equity investment is subject to risks. I or my clients or family members might have positions in the stocks that we mention in our educational posts. We will not be responsible for any Profit or loss that may occur due to any financial decision taken based on any data provided in this message. Do consult your investment advisor before taking any financial decisions. Stop losses should be an important part of any investment in equity.
Nifty 50 moving in upward channel, with strong foundation Apparently NIfty 50 is moving in a upward channel to its all time high probably.