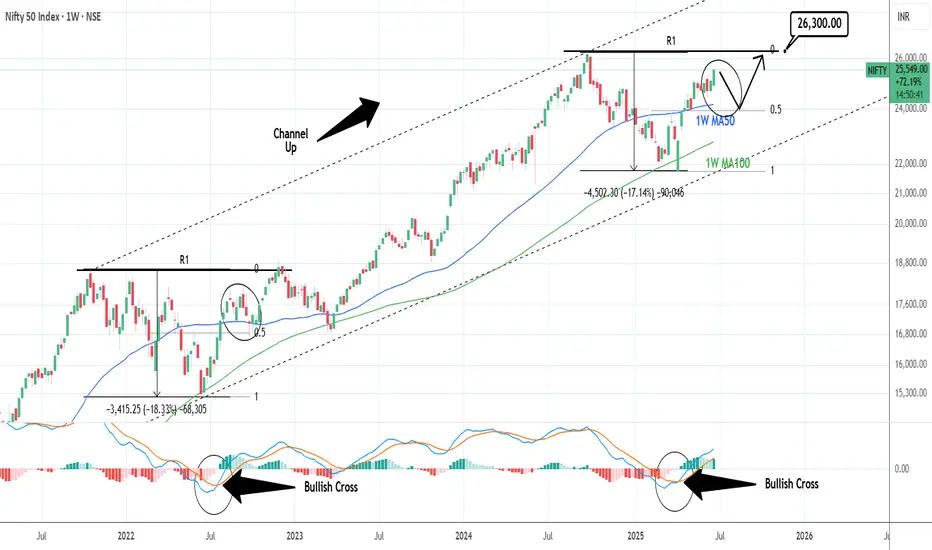
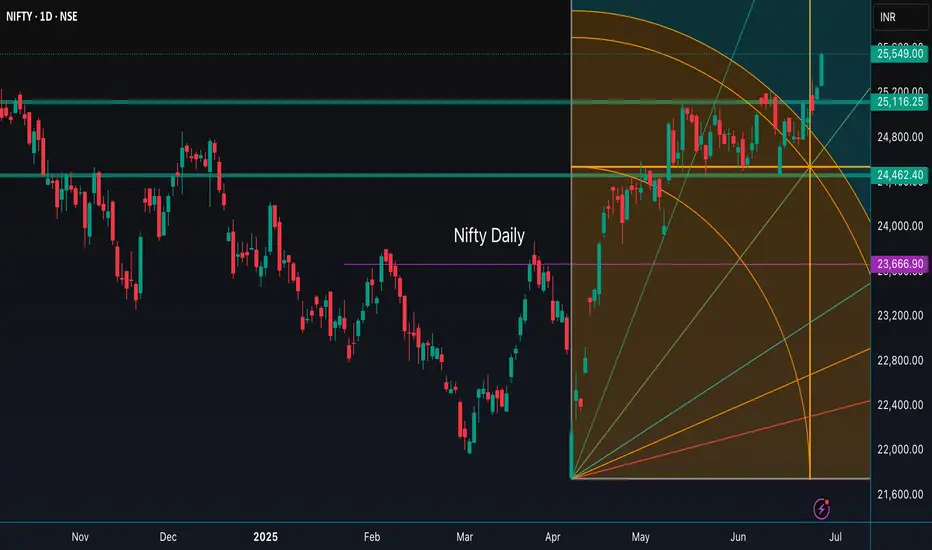
NIFTY: One more opportunity to buy lower.Nifty is on excellent bullish levels on its 1D technical outlook (RSI = 66.330, MACD = 172.380, ADX = 16.480), extending the bullish wave of the 4 year Channel Up. Being close to the R1 already, a pullback to the 0.5 Fib and the 1W MA50 isn't unlikely, as it is what happened in September 2022. That will be our final opportunity to buy low and target the R1 level (TP = 26,300).
## If you like our free content follow our profile to get more daily ideas. ##
## Comments and likes are greatly appreciated. ##
NIFTY trade ideas
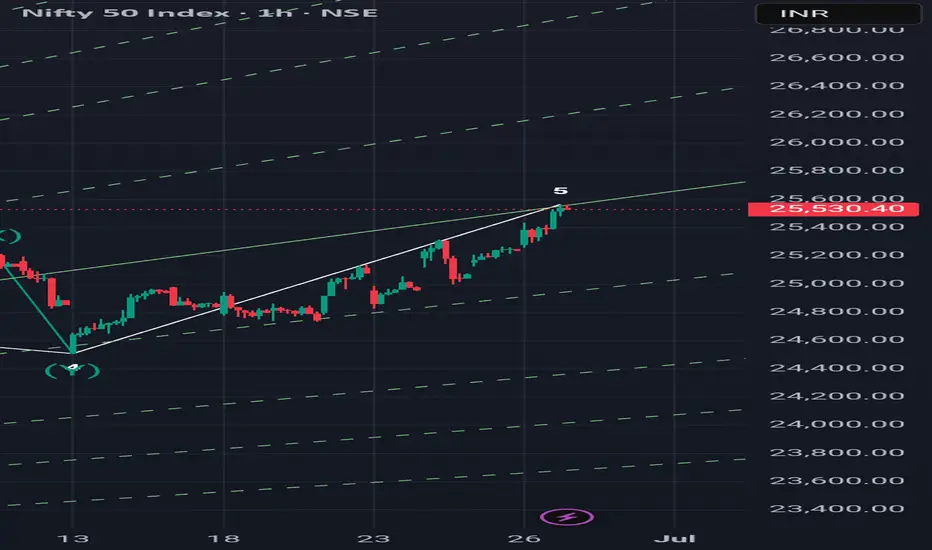
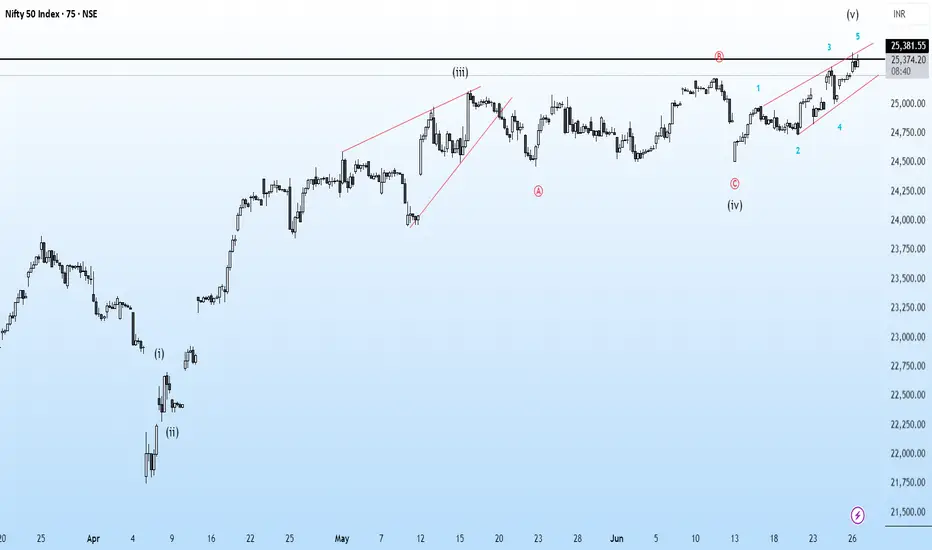
5 th wave done today? If Nifty does not able to cross 25600 by Monday and goes down after hitting today's high of 25565 then it is the indication of completion of wave 5th and now it is the end of extended flat correction ABC started from March. Many price action tools are also indicating this pivot 25565 as high. So the conclusion is this that there are 50% chances of ending of correction and we will get further confirmation after Friday's price movement.
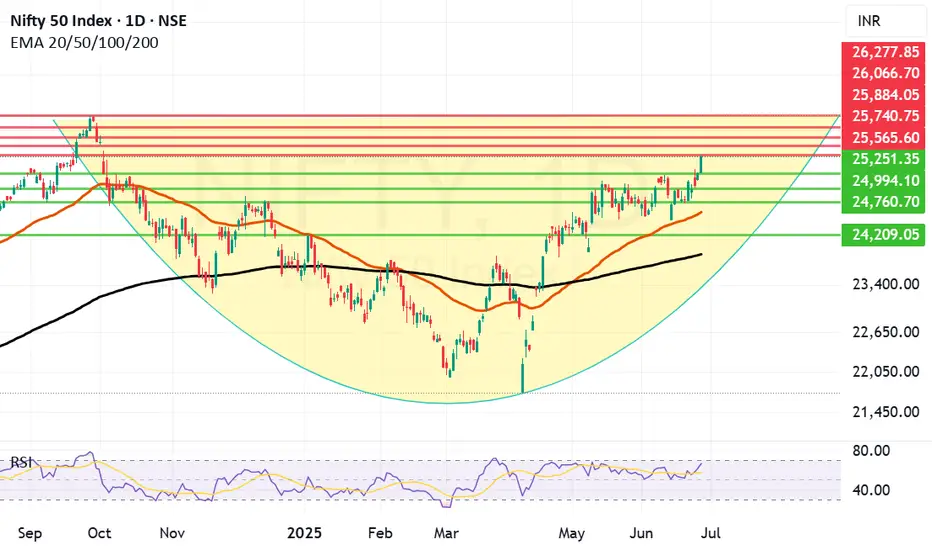
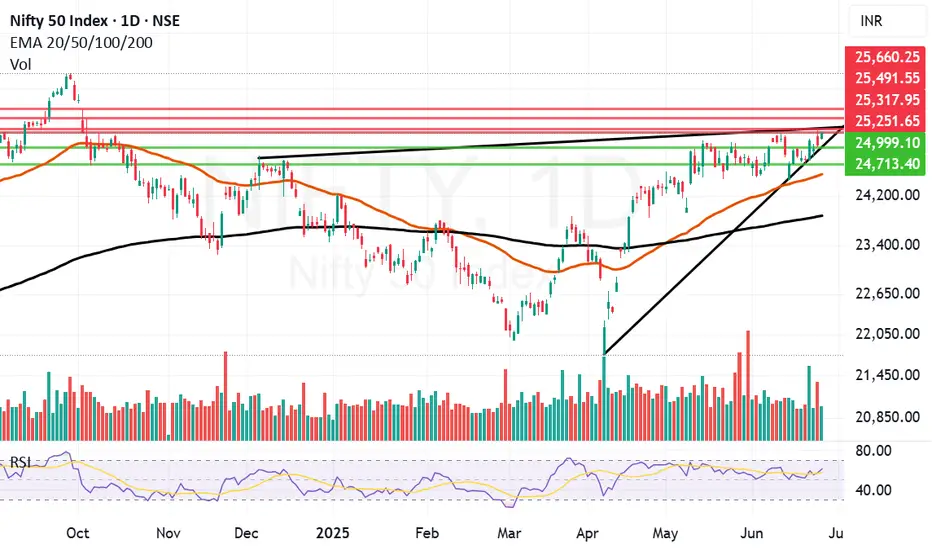
Major Breakout in Nifty now holding the levels key. We saw a major Breakout in Nifty today. Finally Nifty closed above much coveted levels of 25251. Nifty made a high of 25565 and closed at 25549 which was a remarkable comeback. What we are seeing on chart is a cup formation happening in Nifty. For flying further Nifty needs to have a strong closing tomorrow and stronger monthly closing on Monday that is 30th June. These 2 closings will be very important. We need a Nifty closing above 25884. Even if that does not happen a monthly closing above 25251 will also be considered a strong closing. Nifty is strongly on the path of recovery for sure and supports and resistances for Nifty remain as under:
Nifty Supports Remain At: 25251, 24994, 24760 and 24588 (Mother line). If by chance under unlikely circumstances Mother line is broken then Bears will become more empowered and might try to pull Nifty towards 24209 or even 23892 (Father line support).
Nifty Resistances Remain At: 25565, 25740, 25884, 26066 and finally previous All time high resistance of 26277.
Disclaimer: The above information is provided for educational purpose, analysis and paper trading only. Please don't treat this as a buy or sell recommendation for the stock or index. The Techno-Funda analysis is based on data that is more than 3 months old. Supports and Resistances are determined by historic past peaks and Valley in the chart. Many other indicators and patterns like EMA, RSI, MACD, Volumes, Fibonacci, parallel channel etc. use historic data which is 3 months or older cyclical points. There is no guarantee they will work in future as markets are highly volatile and swings in prices are also due to macro and micro factors based on actions taken by the company as well as region and global events. Equity investment is subject to risks. I or my clients or family members might have positions in the stocks that we mention in our educational posts. We will not be responsible for any Profit or loss that may occur due to any financial decision taken based on any data provided in this message. Do consult your investment advisor before taking any financial decisions. Stop losses should be an important part of any investment in equity.
Nifty 50 breaks free🚀 Nifty 50 breaks free! 📈
After weeks of sideways movement, the index has finally crossed above its month-old range with conviction.
Positive vibes are in the air! 🌟
If this momentum holds, next stop: 26,500? 🔮💥
Stay tuned and stay bullish! 🐂🔥
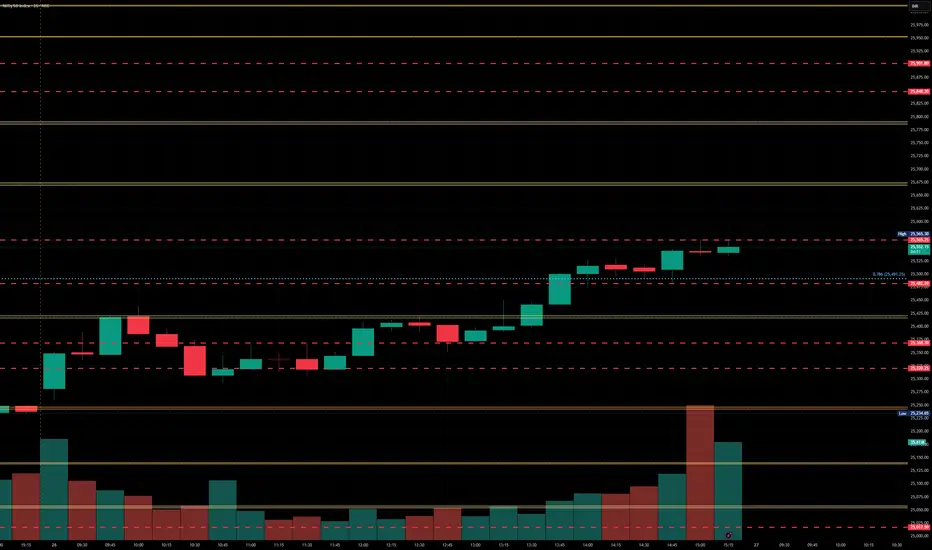
Nifty levels - Jun 27, 2025Nifty support and resistance levels are valuable tools for making informed trading decisions, specifically when combined with the analysis of 5-minute timeframe candlesticks and VWAP. By closely monitoring these levels and observing the price movements within this timeframe, traders can enhance the accuracy of their entry and exit points. It is important to bear in mind that support and resistance levels are not fixed, and they can change over time as market conditions evolve.
The dashed lines on the chart indicate the reaction levels, serving as additional points of significance to consider. Furthermore, take note of the response at the levels of the High, Low, and Close values from the day prior.
We hope you find this information beneficial in your trading endeavors.
* If you found the idea appealing, kindly tap the Boost icon located below the chart. We encourage you to share your thoughts and comments regarding it.
Wishing you success in your trading activities!
Retest Success + Upside Move = Confirmed BreakoutMarket Sentiment is Bullish
Buyers have stepped in after retest.
Confidence is strong above 25,440.
Next Targets to Watch:
🎯 Target 1: 25,520
🎯 Target 2: 25,600+
These levels could act as minor resistances.
Support Now:
25,440 (was resistance, now support).
Price should ideally stay above this level for trend continuation.
🧠 Suggested Trading Plan (If You’re Active in the Market):
Action Level (Approx.)
Entry (Long) 25,450–25,470
Stop Loss Below 25,420
Target 1 25,520
Target 2 25,580–25,600
📊 Confirmation Tools (Optional for Extra Safety):
Look for strong bullish candles on 5-min/15-min chart.
Volume spike with upward movement confirms smart money involvement.

retest check1. Successful Retest (Bullish Confirmation):
If price touches the breakout level (~25,440) and bounces back up, it confirms strong support.
This is a buying opportunity for traders.
Entry: Near the support level (25,440).
Stop Loss: Just below the support (e.g., 25,400).
Target: Next resistance levels like 25,520 or higher.
❌ 2. Failed Retest (False Breakout):
If price breaks back below 25,440, it can be a false breakout.
Price might re-enter the sideways range or even go into a downtrend.
Traders should avoid long trades or may even consider short positions if it falls below 25,292 (support zone).
📊 What to Watch Now:
Price behavior near 25,440.
Volume: Low volume = weak retest; Strong bounce with volume = bullish.
Candle patterns: Bullish reversal candles (e.g., hammer, bullish engulfing) near 25,440 can confirm upside.

Wait For RetestChart Analysis (Upside Breakout):
✅ Breakout Confirmation:
The price broke above the resistance level around 25,440.
This is a strong sign of a bullish breakout.
🔼 What It Indicates:
Buyers are now in control of the market.
The next possible target or resistance could be around 25,520 or higher (as per the upper levels on the chart).
If the breakout is supported by good volume, it adds further strength to the move.
🧠 For Traders:
It may be a good opportunity to consider long (buy) positions, especially after a small pullback and confirmation.
Stop Loss: Can be placed near the breakout level (~25,440), which now acts as support.
Target: You can aim for the next resistance zones like 25,520, 25,600, etc.
📊 Volume Insight:
There is a noticeable increase in volume during the breakout, which confirms the validity and strength of the move.

trading strategyVolume bars at the bottom show trading activity (green for buying, red for selling).
The current price is around 25,374, which is inside the sideways area, indicating the market is undecided at the moment.

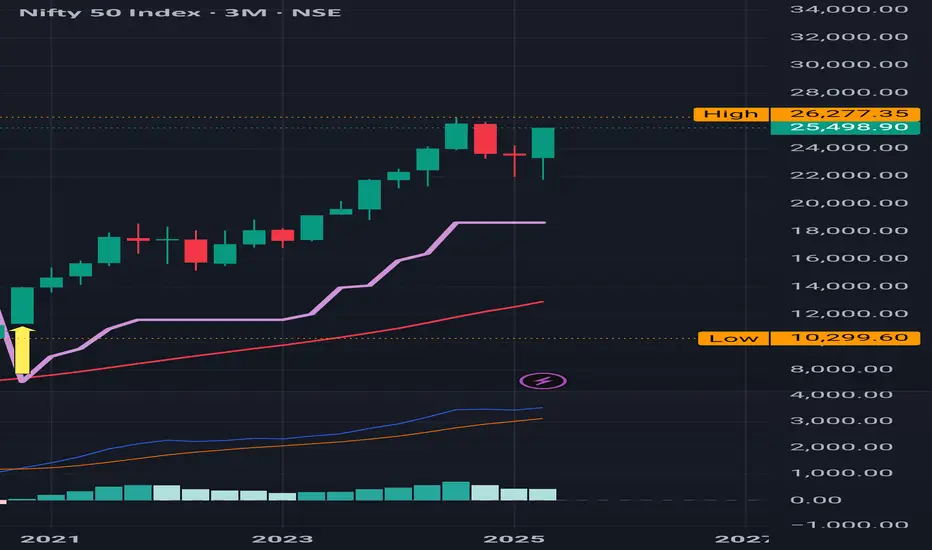
Nifty : Moving towards the ATH Nifty : Moving towards the ATH of 26277
MACD is looking extremely strong
No Red Band Resistance at this moment
This is 3 months Time frame Chart
( Not a Buy / Sell Recommendation
Do your own due diligence ,Market is subject to risks, This is my own view and for learning only .)
trading strategyUp Trend Area (Above ~25,440):
If the price breaks above the red resistance line (~25,440), it indicates a potential uptrend.
Traders may expect bullish movement and consider buying opportunities above this zone.
Sideways Area (Between ~25,292 and ~25,440):
This range indicates consolidation or indecision in the market.
Price is moving within a range without clear direction.
Traders may wait for a breakout either upwards or downwards.
Down Trend Area (Below ~25,292):
If the price falls below the green support level (~25,292), it may enter a downtrend.
This could signal bearish sentiment and potential selling opportunities.

NiftyNifty
looking at the chart, we can see 5waves getting completed....
if this structure holds true ...
24000 would be 1st tgt...
just a view!!
Vedang :)
Disclaimer: Chart is for study purpose only!!
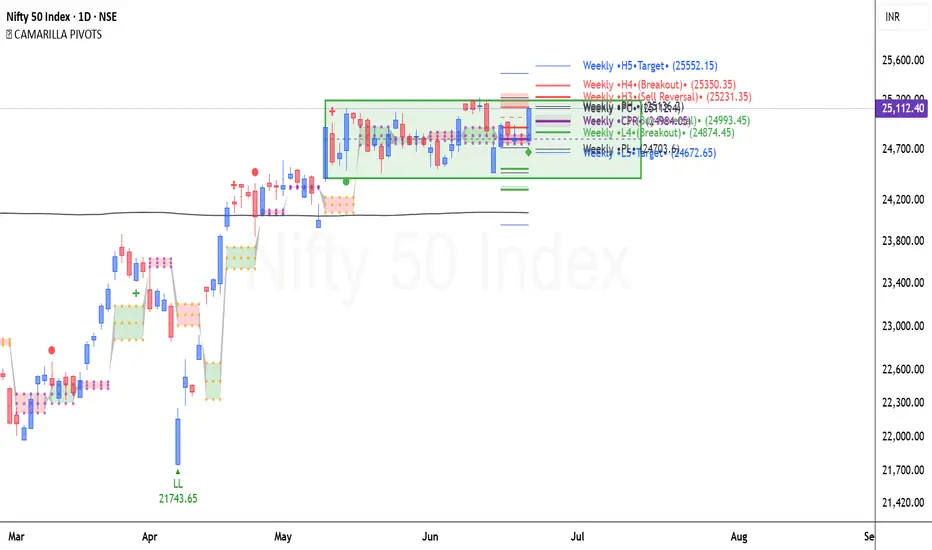
Nifty 50 Bullish SignalsThe Nifty 50 Index on the weekly chart has been consolidating within a defined range for the last 5 weeks, as highlighted in the green box. Here's a quick breakdown:
1. Next Week Ascending CPR (Central Pivot Range)
Implication: An ascending CPR suggests bullish sentiment. It indicates that price action is likely to trend upward, especially if the index stays above or bounces from the CPR.
CPR levels are moving higher week over week, showing positive price structure and strengthening momentum.
2. Weekly Golden Pivot Zone
The golden pivot zone (between Weekly CPR and S1) is considered a strong support zone.
In the chart, price bounced sharply from that zone, confirming its strength.
It now acts as a demand zone. As long as the price remains above this zone, bullish momentum is intact.
What the Monthly CPR Suggests:
✅ Bullish Bias for June-July:
Price above CPR + strong bounce from the buy reversal zone = continuation of uptrend is likely.
As long as price holds above 24,600 (CPR center) or 24,426 (L3 Buy Reversal), expect higher highs.
⚠️ Key Trigger Levels:
Bullish Breakout Trigger: Above 25,400 (M-H4)
Bearish Reversal Caution: Below 24,426 may indicate weakness, especially if it breaks 24,101 (L4).
Strategy Insights:
Buy on Dips: If Nifty pulls back near the CPR zone (~24,600–24,800), it offers a potential long entry.
Upside Targets: 25,276 → 25,400 → 25,781
Avoid Shorts unless price closes below 24,600 with strong volume.
#NIFTY - Weekly Pivot Point is 24883.50 | Next Target?Date: 29-05-2025
#NIFTY - Pivot Point is 24883.50
#NIFTY Current Price: 24755
Upside Targets: 25394.66, 25601.10, 25870.20 and 26139.30
Downside Targets: 24373.24, 24165.90, 23896.80 and 23627.70
Support: 24580.58
Resistance: 25188.21

#Nifty directions and levels for June 26:Here are the market directions and levels for June 26:
Market Overview
There have been no major changes in both the local and global markets. The global market continues to show bullish sentiment, while our local market is still maintaining a moderately bullish bias.
However, Gift Nifty is indicating a positive start of around 30 points today.
So, what can we expect today?
The higher-degree structure shows positive signs, but the lower time frame is still reflecting a range-bound market.
Open interest data also appears bullish. So, if the market breaks above the previous high, we can expect a further continuation of the rally.
On the other hand, if the market faces rejection around that level or if it starts with a decline, the range-bound movement is likely to continue.
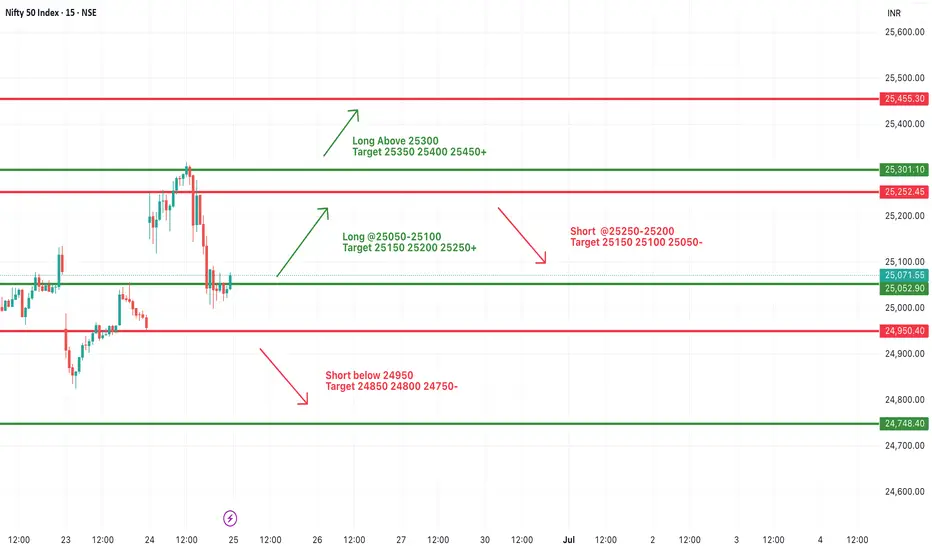
#NIFTY Intraday Support and Resistance Levels - 26/06/2025Nifty is set to open slightly gap up today near the 25,250 mark, signaling a continuation of the ongoing consolidation phase. The market has been hovering around this zone for the past couple of sessions, making it a key inflection point. A sustained move above 25,300 can trigger bullish momentum, leading to targets of 25,350, 25,400, and 25,450+. This level also coincides with previous intraday highs, making it a potential breakout zone for aggressive buyers.
On the flip side, if Nifty faces rejection from this resistance zone and slips below the 25,250–25,200 levels, a downside move could emerge. In that case, short positions can be considered with immediate support levels at 25,150, 25,100, and 25,050. The opening hour will be crucial—traders should monitor for either a breakout above 25,300 or a breakdown below 25,200 to determine intraday direction. Volatility may increase due to expiry, so a wait-and-watch approach with tight stop-losses is advisable.

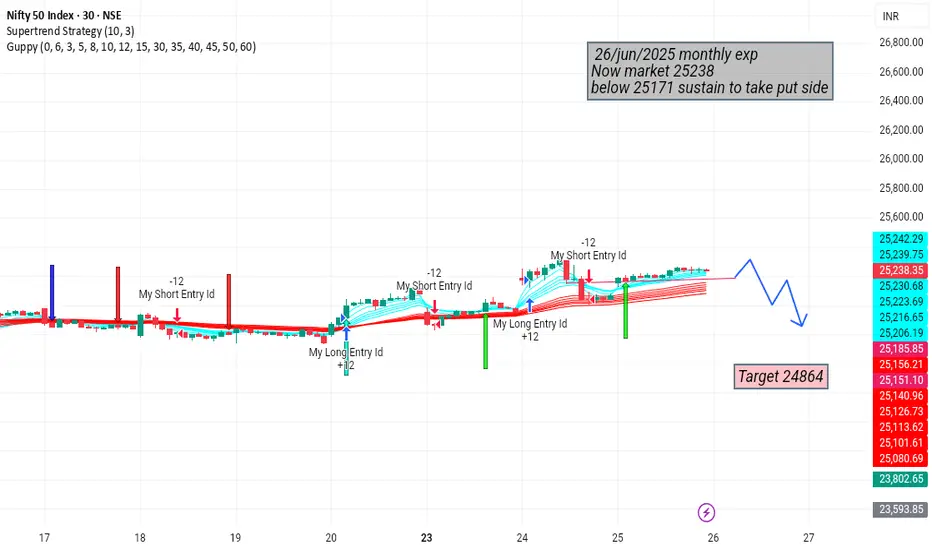
25171 below sustain take put optionlast 3 week exp( 5 jun, 12 jun,19) all of price touched high and low compination*
check on{ one day time frame}
5 jun -{high 24897 low 24613}
12 jun - {high 25198 low 24826}
19 jun -{high 24862 low 24733}
coming 26 jun my point of target 24862
everything mention about my chart
just is my point of view idea ,,I am not sebi reg
thank you ,,,,happy day happy profit
Nifty 50 Reverse Head and shoulder The Reverse Head and Shoulders is a classic bullish reversal pattern that typically signals the end of a downtrend and the beginning of an upward move. In the Nifty daily chart as of June 2025, this pattern has been observed, indicating a potential shift in market sentiment to bullish.
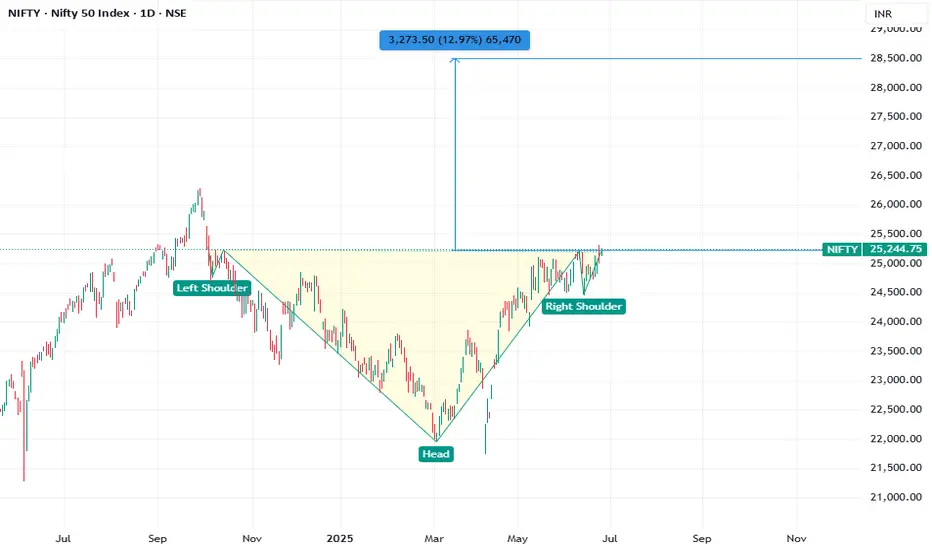
Final hurdle remains to be crossed before Nifty can fly further.One important final hurdle of 25251 remain just in front of Nifty before it can fly further. I can it a final hurdle because it is an important trendline resistance. Last 2 days Nifty has tried to climb above it but we did not get a closing above it yesterday and today as well. Today Nifty made a high of 24266 but closed at 25244. It could not hold on to the ground above 25251. The level is challenging but positive momentum built from today's display might allow it to close above the same. Only time will tell. Closing of this week will be very important.
Nifty resistances remain at: 25251, Closing above 25251 will empower Bulls to pull Nifty further upwards towards 25317, 25491 and 25660.
Nifty supports remain at: 24999, 24713, 24749 (Mother Line Support), 23875 (Father line support). (Closing below Father line support can bring Bears back into the game).
Disclaimer: The above information is provided for educational purpose, analysis and paper trading only. Please don't treat this as a buy or sell recommendation for the stock or index. The Techno-Funda analysis is based on data that is more than 3 months old. Supports and Resistances are determined by historic past peaks and Valley in the chart. Many other indicators and patterns like EMA, RSI, MACD, Volumes, Fibonacci, parallel channel etc. use historic data which is 3 months or older cyclical points. There is no guarantee they will work in future as markets are highly volatile and swings in prices are also due to macro and micro factors based on actions taken by the company as well as region and global events. Equity investment is subject to risks. I or my clients or family members might have positions in the stocks that we mention in our educational posts. We will not be responsible for any Profit or loss that may occur due to any financial decision taken based on any data provided in this message. Do consult your investment advisor before taking any financial decisions. Stop losses should be an important part of any investment in equity.
Hidden bullish divergence Hidden Bullish Divergence (RSI-Based) – Description
Hidden bullish divergence using the Relative Strength Index (RSI) is a technical signal that suggests the continuation of an existing uptrend. It occurs when the price makes a higher low, but the RSI makes a lower low. This pattern reveals that, despite a short-term pullback in price, the buying pressure (bullish momentum) is still strong beneath the surface.
Key Characteristics:
Price: Forms a higher low, indicating support and strength in the trend.
RSI: Forms a lower low, showing temporary weakness or an oversold condition.
Signal Type: Continuation (not reversal) – it suggests the uptrend is likely to resume.
Why It Matters:
RSI typically measures momentum. When RSI dips lower while price stays relatively strong, it shows that the market shook out weak hands but kept its bullish structure. This is a sign that buyers are still in control, and the pullback may offer a buying opportunity.
How to Use It:
Look for this setup during a pullback in an uptrend.
Confirm with trendlines, support zones, or volume.
Consider entering long trades when RSI starts to turn up from its low, confirming momentum is returning.
Summary:
Hidden bullish divergence (RSI):
Price: Higher low
RSI: Lower low
Implication: Trend likely to continue upward

Nifty levels - Jun 26, 2025Nifty support and resistance levels are valuable tools for making informed trading decisions, specifically when combined with the analysis of 5-minute timeframe candlesticks and VWAP. By closely monitoring these levels and observing the price movements within this timeframe, traders can enhance the accuracy of their entry and exit points. It is important to bear in mind that support and resistance levels are not fixed, and they can change over time as market conditions evolve.
The dashed lines on the chart indicate the reaction levels, serving as additional points of significance to consider. Furthermore, take note of the response at the levels of the High, Low, and Close values from the day prior.
We hope you find this information beneficial in your trading endeavors.
* If you found the idea appealing, kindly tap the Boost icon located below the chart. We encourage you to share your thoughts and comments regarding it.
Wishing you success in your trading activities!
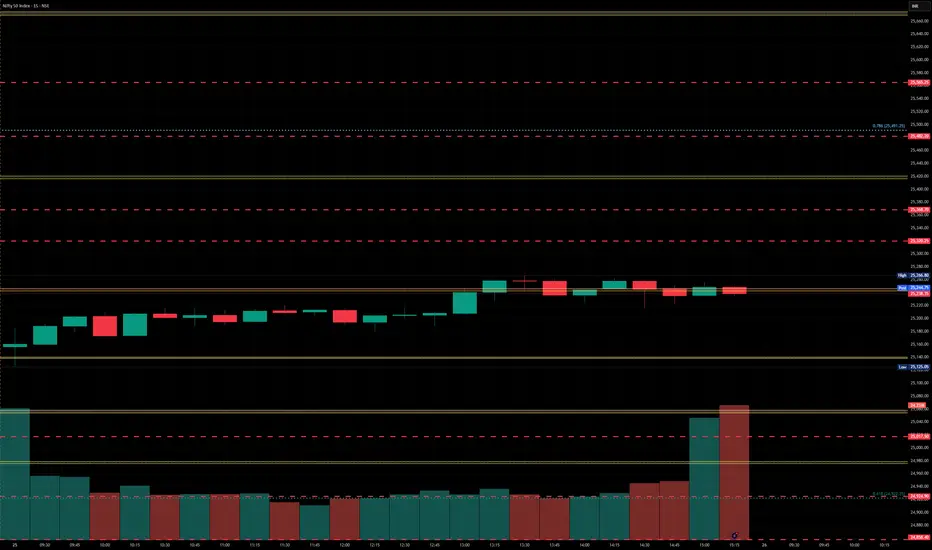
#NIFTY Intraday Support and Resistance Levels - 25/06/2025Nifty is expected to open with a gap-up near the 25,250 level, signaling early bullish strength. If the index sustains above the 25,250–25,300 zone after opening, we could see a continuation of the upward momentum toward the next resistance levels at 25,350, 25,400, and possibly 25,450+. However, if it fails to hold above 25,250 and slips back into the 25,100–25,050 zone, there could be selling pressure. A break below 25,050 may drag Nifty further down to 24,950. If 24,950 breaks, then a short trade could trigger, with targets at 24,850, 24,800, and 24,750. The key levels to watch today are 25,250 on the upside and 24,950 on the downside.