Nifty lost gains but it is a positive sign to close above 25KNifty in the Euphoria of ceasefire between Iran and Israel gained a lot of ground early in the day and made a high of 25317 but could not sustain the levels and lost massive 273 points due to profit booking to close the day at 25044. Although the loss was big but the silver lining is Nifty still ended the day 72 points in the green and closed above 25K levels. As there were news and claims related to ceasefire violations from both sides a lot of investors and participants were apprehensive of carrying long positions forward. If the things remain positive over night and if important resistance levels of 25116 and 25251 are crossed we might yet again see positive momentum building.
Nifty Resistances remain at: 25116, 25251, 25317. Closing above 25317 will lead to further upside towards the next resistance levels of 25491 and 25660.
Nifty Supports remain at: 25499 (Trend line support), 24713, 24521 (Mother Line Support) and 24463. closing below 24463 can had over the gains to the Bears who can drag index down towards Father line support of 23861.
Disclaimer: The above information is provided for educational purpose, analysis and paper trading only. Please don't treat this as a buy or sell recommendation for the stock or index. The Techno-Funda analysis is based on data that is more than 3 months old. Supports and Resistances are determined by historic past peaks and Valley in the chart. Many other indicators and patterns like EMA, RSI, MACD, Volumes, Fibonacci, parallel channel etc. use historic data which is 3 months or older cyclical points. There is no guarantee they will work in future as markets are highly volatile and swings in prices are also due to macro and micro factors based on actions taken by the company as well as region and global events. Equity investment is subject to risks. I or my clients or family members might have positions in the stocks that we mention in our educational posts. We will not be responsible for any Profit or loss that may occur due to any financial decision taken based on any data provided in this message. Do consult your investment advisor before taking any financial decisions. Stop losses should be an important part of any investment in equity.
NIFTY trade ideas
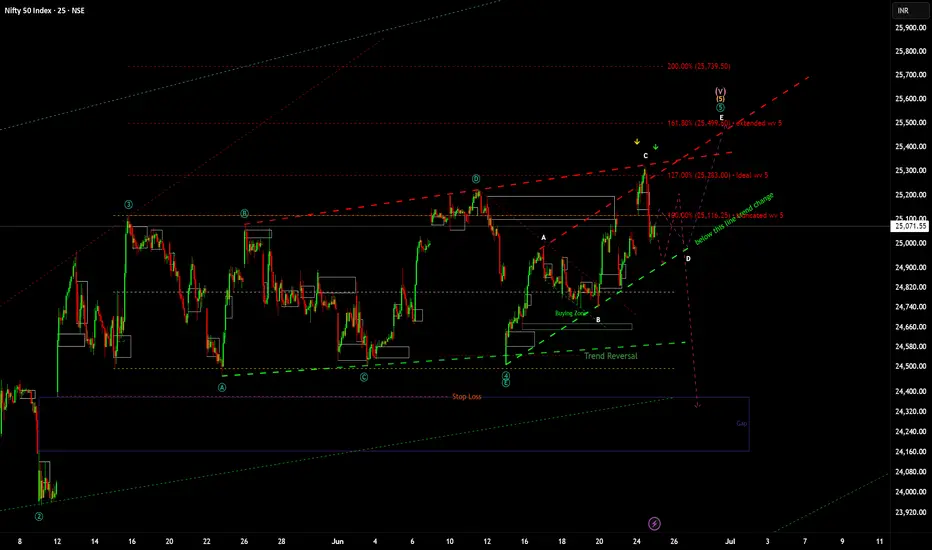
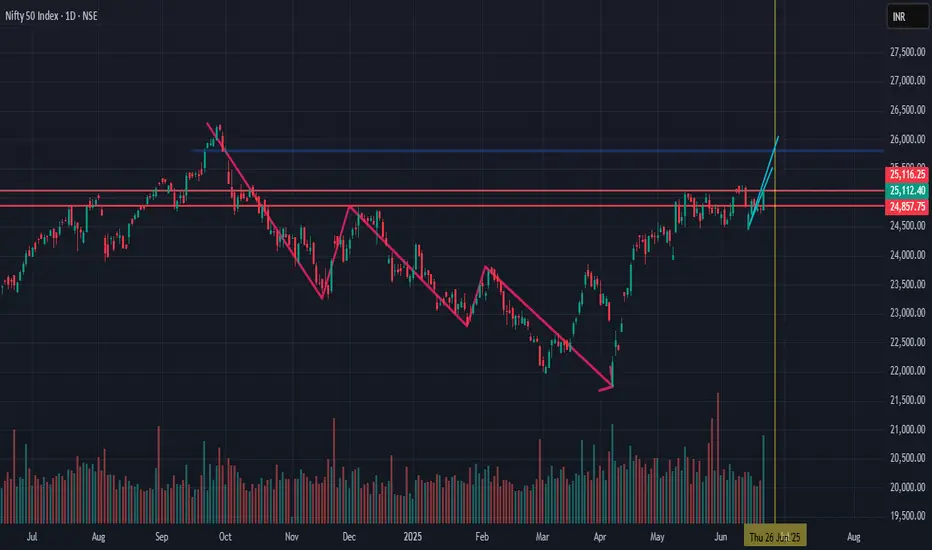
NIfty my view and not a sell or buy recommendation....nifty : My view for coming days. hope it takes the violet line.🤞🏻
technically it has completed Wv 5 which is 127% but the structure is not clear so can go into extension which may take it to 161%. green line if it is broken on daily Tf we are entering correction.🤞🏻.
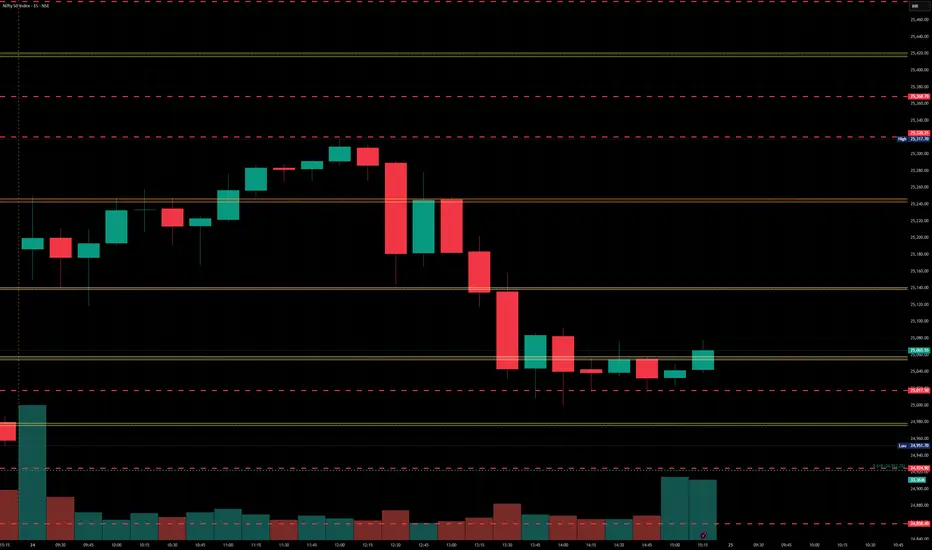
Nifty levels - Jun 25, 2025Nifty support and resistance levels are valuable tools for making informed trading decisions, specifically when combined with the analysis of 5-minute timeframe candlesticks and VWAP. By closely monitoring these levels and observing the price movements within this timeframe, traders can enhance the accuracy of their entry and exit points. It is important to bear in mind that support and resistance levels are not fixed, and they can change over time as market conditions evolve.
The dashed lines on the chart indicate the reaction levels, serving as additional points of significance to consider. Furthermore, take note of the response at the levels of the High, Low, and Close values from the day prior.
We hope you find this information beneficial in your trading endeavors.
* If you found the idea appealing, kindly tap the Boost icon located below the chart. We encourage you to share your thoughts and comments regarding it.
Wishing you success in your trading activities!
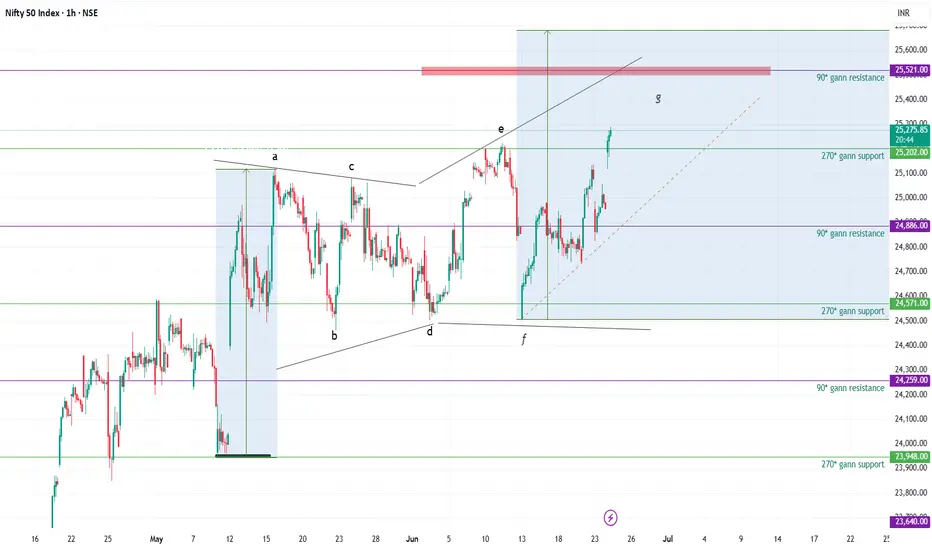
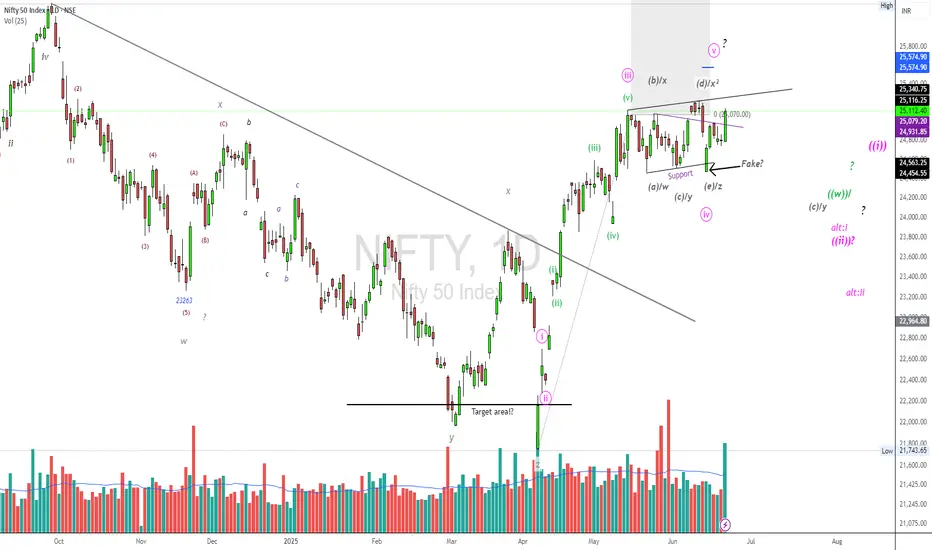
Diametric Pattern - Riding the current G-wave- Riding the G-wave - hoping it to tend to be nearly equal to A-wave
- 90* Gann acting as resistance
- 270* Gann as supports
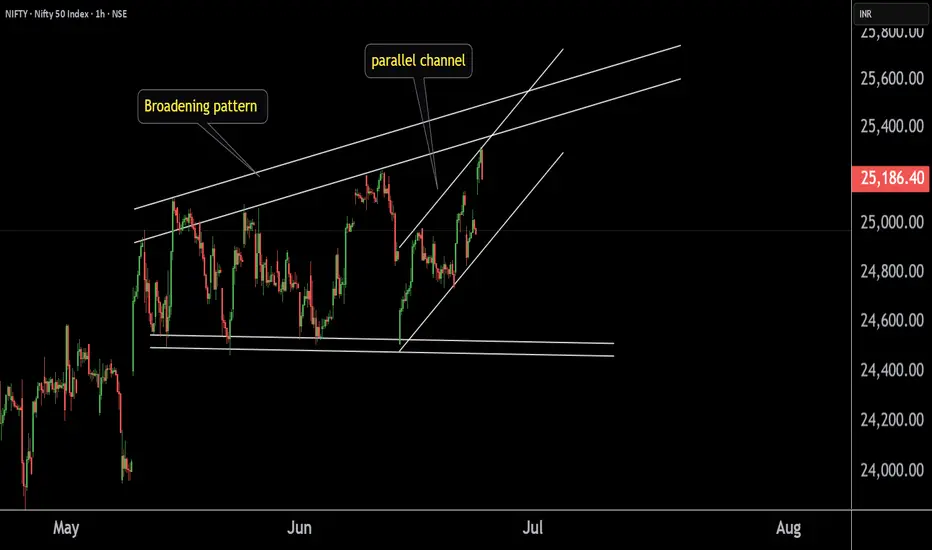
NIFTY at Best Resistance !!This is the 1 hour Chart of NIFTY 50.
NIFTY 50 is trading near it's Resistance zone at 24400 range.
NIFTY 50 is forming a broadening pattern; resistance lies near 24,500.
Nifty 50 is forming parallel channel inside the pattern ; resistance lies near 24350.
If this level is sustain, then we may see Lower prices in Nifty 50.
Thank You !!
# Niftydirections and levels for June 24:Good morning, Friends! 🌞
Here are the market directions and levels for June 24:
Market Overview
Due to ongoing global issues, the markets are showing high volatility. Structurally, both the global and our local markets are still moving within a range.
However, Gift Nifty is indicating a strong gap-up of around 250 points.
So, what can we expect today?
In the previous session, both Nifty and Bank Nifty witnessed sharp ups and downs. Even with those swings, they still ended within a range.
However, today’s gap-up might break that previous range—if it holds.
We should wait for clear confirmation before expecting any continuation.
That means, if the market breaks the resistance with a solid candle or consolidates around the resistance zone, we can expect the rally to continue.
On the other hand, if the market faces rejection at the resistance, it may re-enter the range and move back within the channel.
Let’s look at the chart for more clarity.
Both Nifty and Bank Nifty appear to be showing a similar structure.
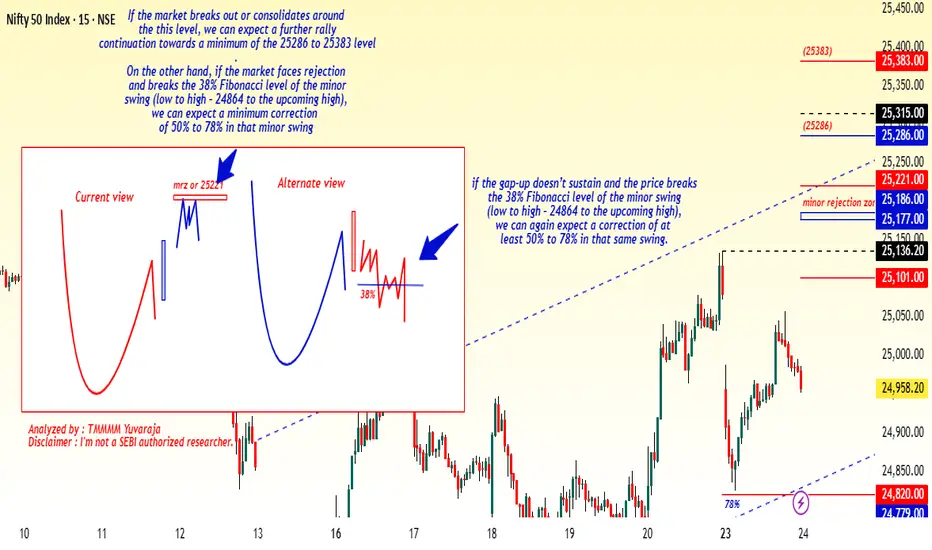
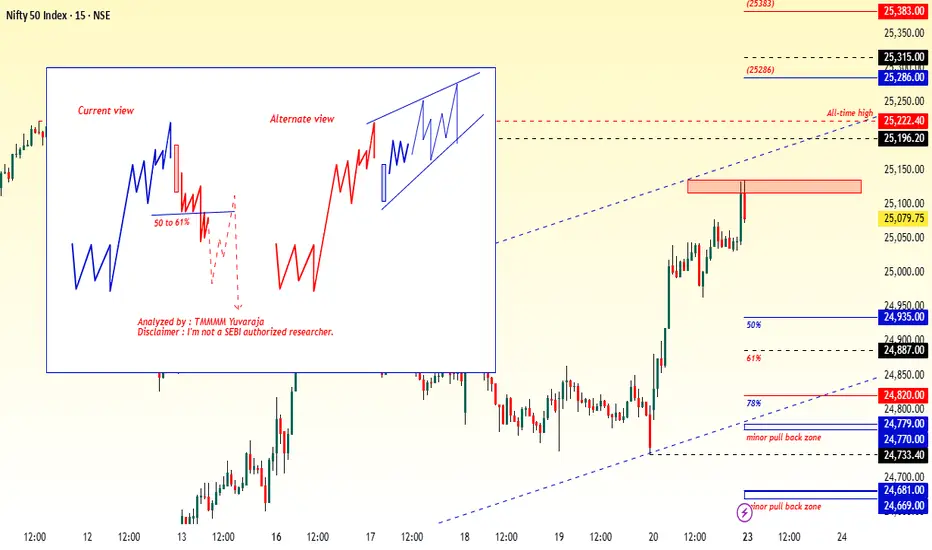
Current View
As already discussed:
If the market breaks out or consolidates around the rejection zone, we can expect a further rally continuation towards a minimum of the 78% Fibonacci level — for Bank Nifty and for Nifty, around the 25,286 to 25,383 zone.
On the other hand, if the market faces rejection and breaks the 38% Fibonacci level of the minor swing:
Then we can expect a minimum correction of 50% to 78% in that minor swing.( to use fib
Nifty: Low to High – 24,864 to the upcoming high)
Alternate View
If the gap-up doesn’t sustain and the market breaks the 38% Fibonacci level of the minor swing:
Then again, we can expect a correction of at least 50% to 78% in the same swing..( to use fib
Nifty: Low to High – 24,864 to the upcoming high)
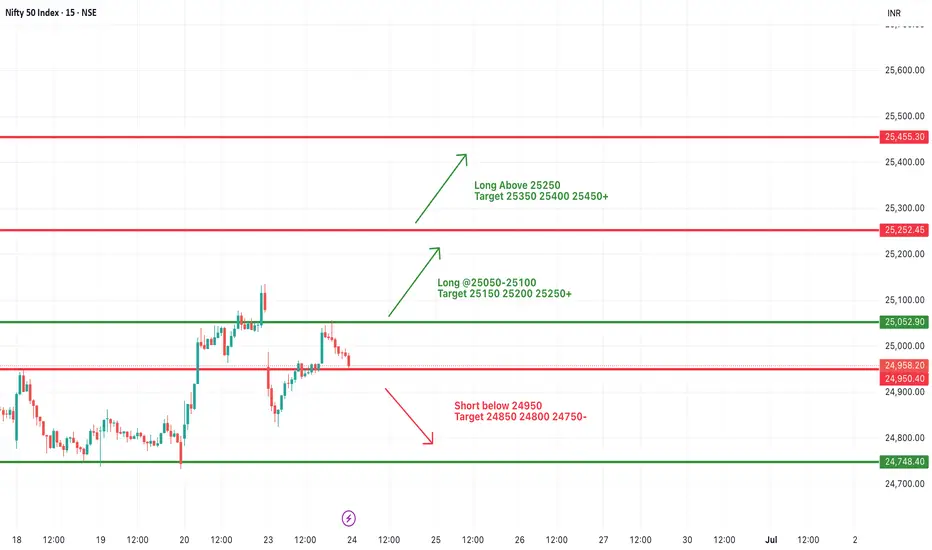
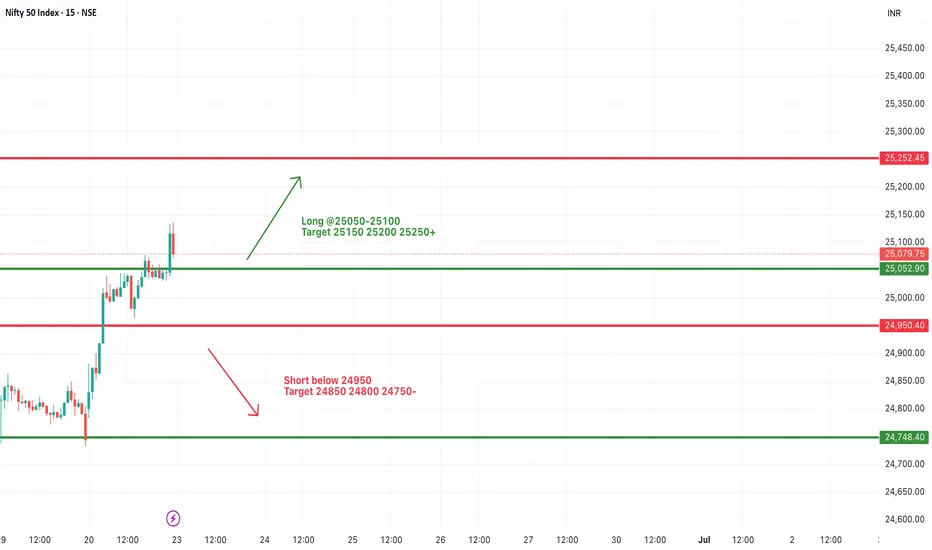
#NIFTY Intraday Support and Resistance Levels - 24/06/2025Today, Nifty is expected to open with a gap-up near the 25,250 level. This level is crucial, as a sustained move above it can trigger a strong upside rally. If Nifty manages to hold above 25,250, we may see targets of 25,350, 25,400, and even 25,450+ in the coming sessions. On the downside, if the index slips below 24,950, it could lead to a corrective move toward 24,850, 24,800, and potentially 24,750 zones.
Traders should closely watch the 25,050–25,100 range for intraday strength, and the 24,950 mark as immediate support. Any breakout or breakdown from these levels will offer direction for the day. Maintain strict stop-loss and consider trailing profits as levels get tested.
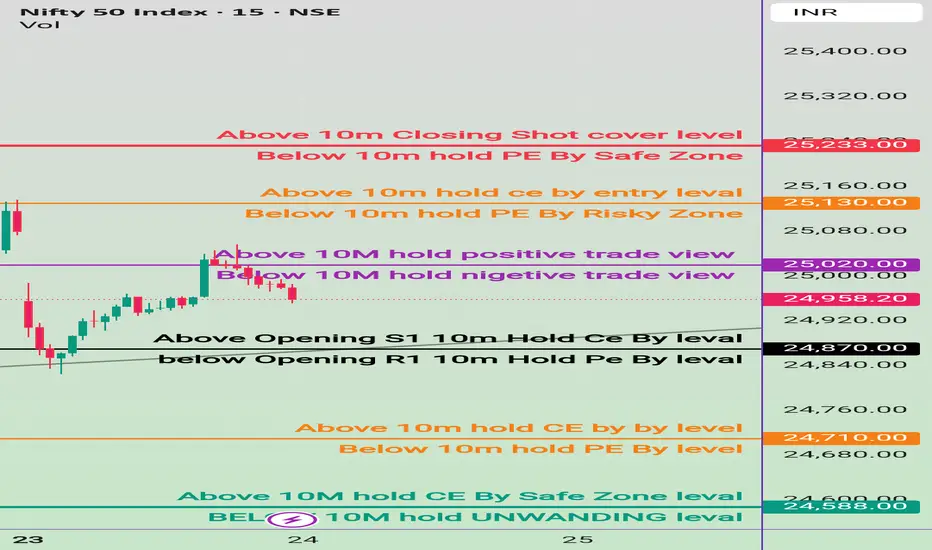
24 June nifty breakout & breakdown levels 🔺 Bullish (Call Option / CE) Strategy:
✅ Buy CE (Call Option) when:
Above 24,710 → Entry for bullish trade
"Above 10m hold CE by buy level"
Above 24,870 → Stronger confirmation
"Above Opening S1 10M Hold CE By level"
Above 25,020 → Positive trade view
"Above 10M hold positive trade view"
Above 25,130 → Safer CE entry zone
"Above 10M hold CE by entry level"
Above 25,233 → Closing shot level
"Above 10M Closing Shot cover level"
🔻 Bearish (Put Option / PE) Strategy:
✅ Buy PE (Put Option) when:
Below 24,710 → Entry for bearish trade
"Below 10m hold PE By level"
Below 24,870 → Bearish confirmation
"Below Opening R1 10M Hold PE By level"
Below 25,020 → Negative trade view
"Below 10M hold nigeative trade view"
Below 25,130 → Risky PE zone
"Below 10M hold PE By Risky Zone"
Below 25,233 → Safer PE Zone
"Below 10M hold PE By Safe Zone"
Nifty Analysis EOD – June 23, 2025 – Monday🟢 Nifty Analysis EOD – June 23, 2025 – Monday 🔴
👊 Tug of War Between Optimism and Pessimism
Nifty opened with a sharp 140-point gap-down, weighed by geopolitical tensions and negative news cues. The mood was clearly pessimistic — yet, from the deep low of 24,824.85, bulls made a bold comeback.
What followed was a classic textbook reversal:Price clawed back up, cutting through multiple key resistances — S1, VWAP, CDH, CPR BC, and Central CPR — before kissing the CPR TC, where it marked the day high at 25,057. This level acted as a supply zone and pushed Nifty back down toward the CPR BC, where it managed to close above the open — a quiet victory for the bulls, even in a red session overall.
The level 24,825 has now proven itself once again — the market’s respect for this support zone grows stronger with every bounce.
Today’s candle was a spinning top-style doji and also formed an inside bar, with all movement inside Friday’s wide-range candle (352 pts). Despite a smaller 232-point range today, this still requires caution — inside bars after large-range candles often result in false breakouts, especially amid macro noise.
📌 When the world looks bearish, and the chart looks bullish — trust your system.And that’s exactly what I did today — sticking to the Gladiator Strategy, a simple, disciplined intraday price action-based option buying framework.
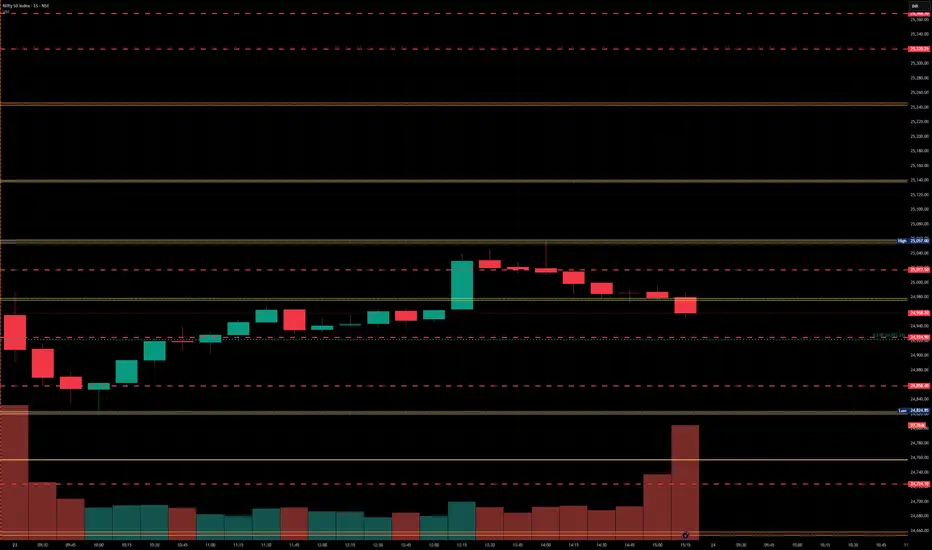
🕯 5 Min Time Frame Chart with Intraday Levels
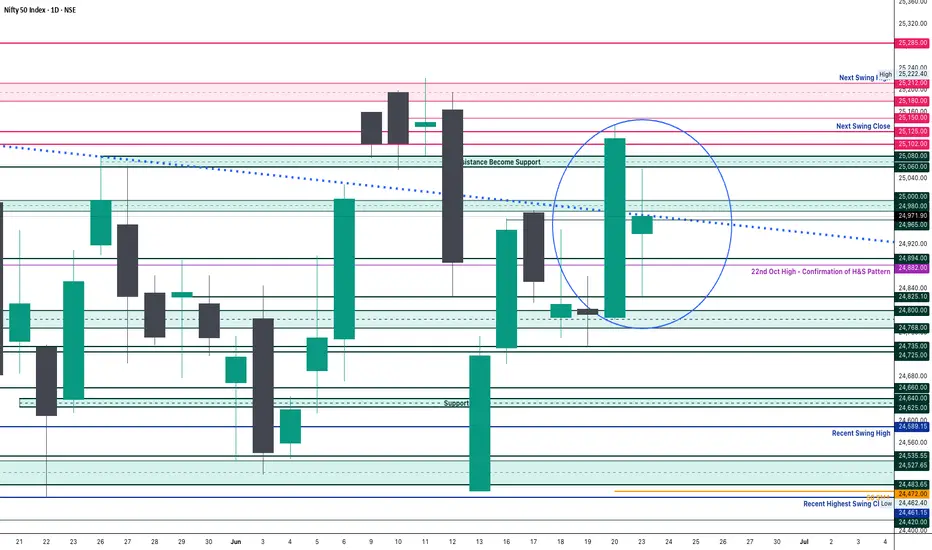
🕯 Daily Time Frame Chart with Intraday Levels
🕯 Daily Candle Breakdown
Open: 24,939.75
High: 25,057.00
Low: 24,824.85
Close: 24,971.90
Change: −140.50 (−0.56%)
📊 Candle Structure Breakdown
Real Body: 32.15 pts (small green body)
Upper Wick: 85.10 pts
Lower Wick: 114.90 pts
🔍 Interpretation
Despite a lower close than Friday, it was a green-bodied candle (close > open).
Long lower wick shows strong buying near 24,825.
Long upper wick signals resistance near 25,050–25,060.
🕯 Candle Type
📍 Spinning Top with Long Wicks — Sign of indecision, but slight bullish bias due to buying off the lows.
📌 Key Insight
Support at 24,825 holds strong.
Upper rejection near 25,050 indicates tight overhead pressure.
Watch closely:
Break above 25,060 → May trigger bullish continuation.
Break below 24,820 → Could open downside to 24,735–24,660 zone.
🛡 5 Min Intraday Chart
⚔️ Gladiator Strategy Update
ATR: 254.95
IB Range: 163.25 → Medium IB
Market Structure: ⚖️ Balanced
Trades Triggered:
🟢 10:14 AM – Long Trade → ✅ Target Achieved (Trailing Exit, R:R 1:4.51)
🔴 2:16 PM – Short Signal → ❌ Discarded (RR not favorable)
📌 Support & Resistance Zones
Resistance Levels
24,980 ~ 25,000
25,060 ~ 25,080
25,125 ~ 25,150
25,180 ~ 25,212
25,285
Support Levels
24,965
24,894 ~ 24,882
24,825
24,800 ~ 24,768
24,735 ~ 24,725
💭 Final Thoughts
Markets are currently walking a tightrope — with bearish headlines on one side and bullish price action on the other.The Gladiator approach today helped sidestep the noise and focus on what matters: price structure and clean levels.
📌 Trade the chart, not the news. And when in doubt — zoom out.
🧠 “Uncertainty is the playground of the disciplined.”
✏️ Disclaimer
This is just my personal viewpoint. Always consult your financial advisor before taking any action.
Nifty levels - Jun 24, 2025Nifty support and resistance levels are valuable tools for making informed trading decisions, specifically when combined with the analysis of 5-minute timeframe candlesticks and VWAP. By closely monitoring these levels and observing the price movements within this timeframe, traders can enhance the accuracy of their entry and exit points. It is important to bear in mind that support and resistance levels are not fixed, and they can change over time as market conditions evolve.
The dashed lines on the chart indicate the reaction levels, serving as additional points of significance to consider. Furthermore, take note of the response at the levels of the High, Low, and Close values from the day prior.
We hope you find this information beneficial in your trading endeavors.
* If you found the idea appealing, kindly tap the Boost icon located below the chart. We encourage you to share your thoughts and comments regarding it.
Wishing you success in your trading activities!

Nifty directions and levels for June 23Good morning, Friends! 🌞
Here are the market directions and levels for June 23:
Market Overview
The global market is showing signs of consolidation with some cautious sentiment, and our local market is also reflecting the same.
However, Gift Nifty is indicating a 130-point negative start.
So, what can we expect today?
The structures in the higher degree timeframes are slightly different from one another, so we can't take any firm decision in advance.
However, my expectation is that the market may close with a negative bias today.
Let’s look at the chart for more clarity.
On the 15-minute chart, both Nifty and Bank Nifty appear to be showing a similar structure.
Current View
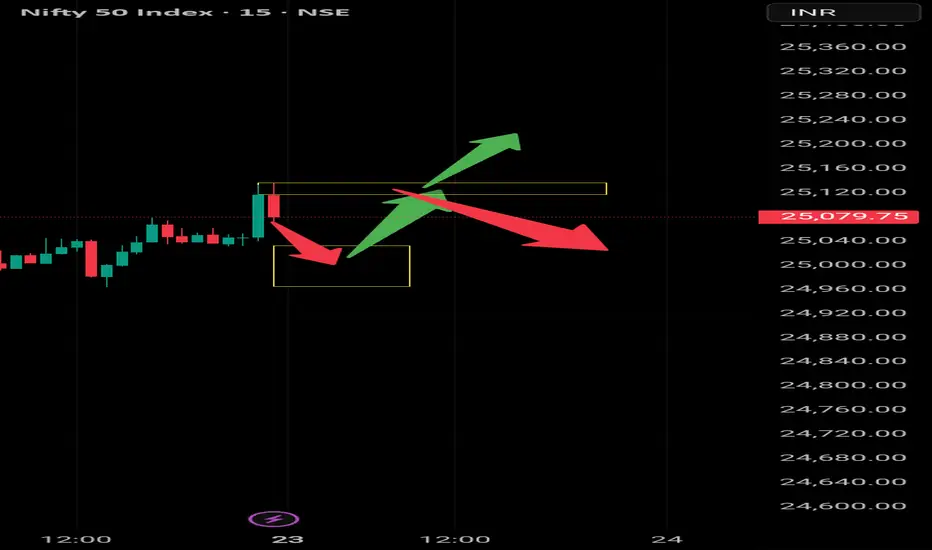
The current view suggests that if the market sustains the initial gap-down and consolidates, we can expect the correction to continue.
In this case, even if there is a solid pullback, the market may not move much higher.
This would mean it could consolidate between the previous day’s high and the upcoming low.
Alternate View
The alternate view suggests that if the market takes a pullback initially, it may consolidate within the previous day's range.
If it breaks the previous high after that, we can expect further rally continuation, possibly in a diagonal pattern.
#NIFTY Intraday Support and Resistance Levels - 23/06/2025A flat opening is expected in Nifty today. If Nifty sustains above the 25,050–25,100 zone after the open, we can expect an upside rally toward 25,150 → 25,200 → 25,250+ levels. This bullish momentum may continue if Nifty remains strong above 25,100.
However, any downside momentum may begin if Nifty starts trading below 24,950, which is a crucial support zone. In such a scenario, the index could slip toward 24,850 → 24,800 → 24,750- levels.
For intraday trades, focus on breakout or breakdown levels, and manage risk with trailing stop-losses in place.
Nifty50 June 2025 LevelNifty50 now chart tomorrow open down side and going up for breakout next swing.
NIFTY MAY HIT 25800 in JUNE 2025I am posting this just to record my analysis. I am using some logics to analyze and forecast moves. You may find it interesting that yes with true logic and observation on data pattern and chart pattern, yes it possible to forecast at some extend.
May be I will be wrong but it's all about probability, it's in 28% probability of winning but with a high reward.
Don't take any trade or financial action based on this. It's just a post of idea and knowledge sharing.
Thanks for reading.
Bye.
$nifty50rsi cross and nice engulfing candle likel heading to test range high above then may just take liquiidty and deviate back either way planning on derisking some and keeping some ammo to buy lower with oompa lumpa surely going to give us opportunities .
either way still recon new highs Q3 onwards so BTFD and no fear
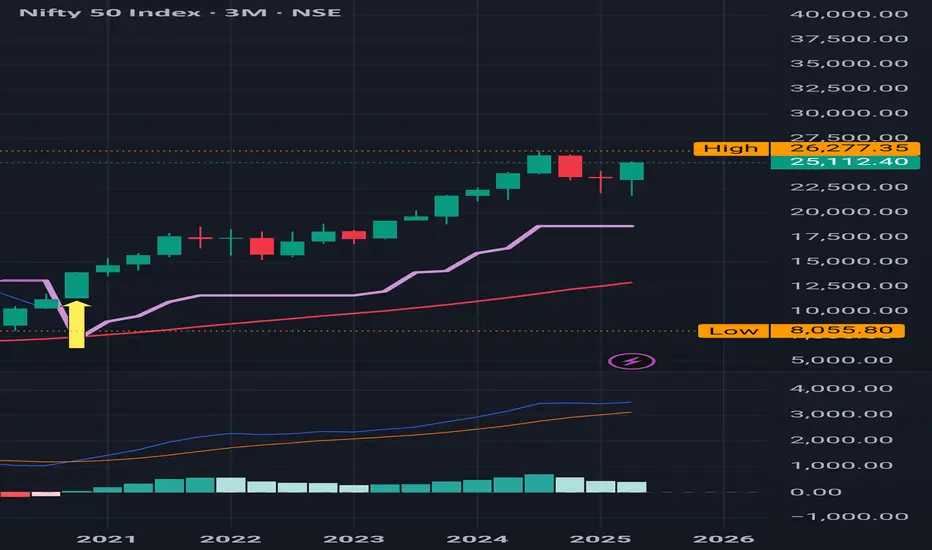
Nifty : Doubled in less than 5 Years Nifty : Doubled in less than 5 Years
There was a Buy triggered on Oct 2020 and it never looked back since then .
This is a 3 Month time frame chart
( Not a Buy / Sell Recommendation
Do your own due diligence ,Market is subject to risks, This is my own view and for learning only .)
NIFTY50.....Ready to explode?Hello Traders,
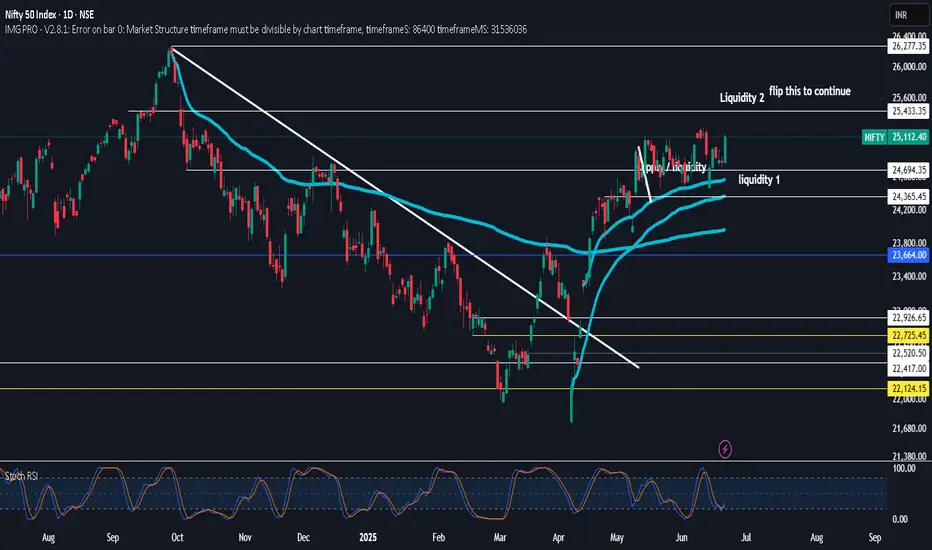
the NIFTY50 has misleading! It jumps up and down and has probably overcome the descending trend line, as seen in the chart! My argument for a 'fake' move is still valid, as long as the low @ 24473 remains in place.
Chart analysis:
The next upside target for the bulls is around the 25260 to 25300 points, depending on whether if is achieved.
The targets are still valid, and India is lily on the way, to become one of the leading Industrial nations in the future. Of course, the Nation has a long way to go, but keep this in mind! If the government improves in infrastructure, such as electric power supply and building bridges and motorways etc., the potential will be phenomenal!
In any case, we should all invest in this "huge and strong" nation.
I would normally not recommend an ETF for India, but I am making it this, caused by the enormous potential!
But, back to chart. I don`t think the upward move has ended yet. So, we are still focused on further upside potential!
My long-time targets are still valid. We'll see?
Have a great weekend....
Ruebennase
Please ask or comment as appropriate.
Trade on this analysis at your own risk.
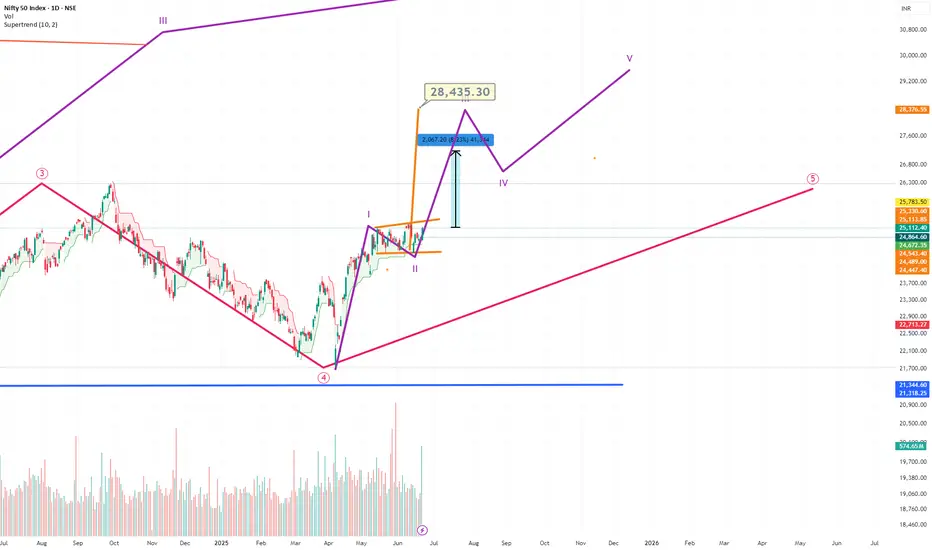
NIFTY Future path..Up to 28000Please note that Nifty is in a medium 5th wave..in which it is completed or completing its 2nd wave...that means we will have a 3rd wave up to 28000 Minimum...as per Neo waves..calculated by adding 1.l618 of the 1st wave...tgt is 28400 minimum....Remember mkts have climbed walls of worry....which is a sign of bullish markets...
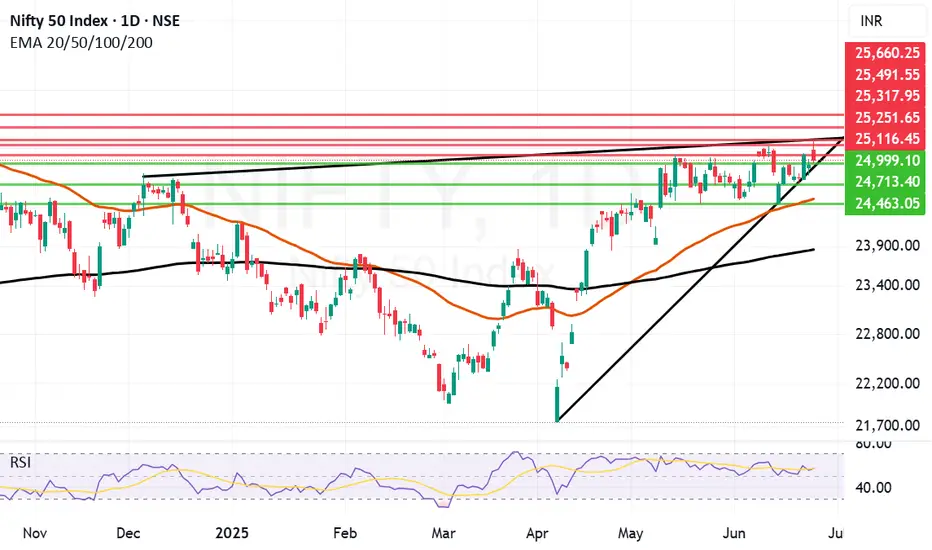
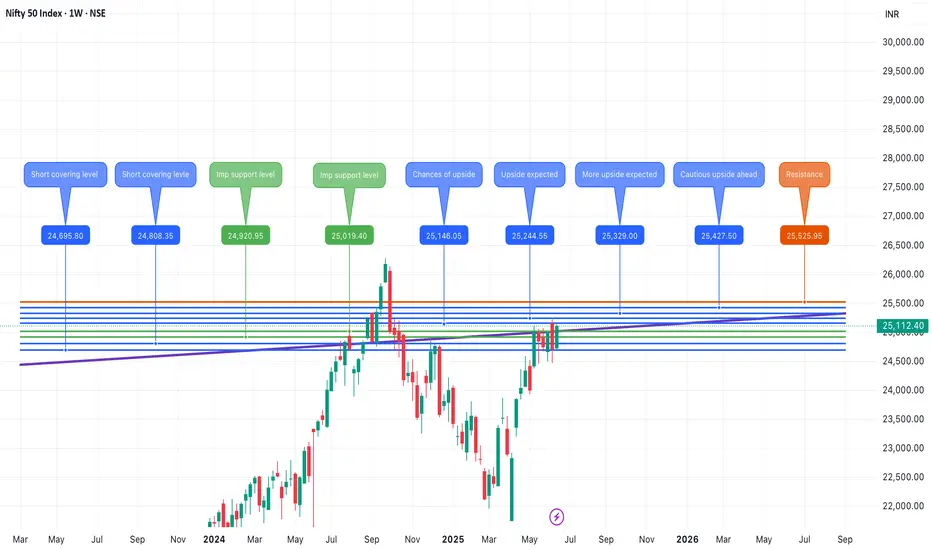
Nifty 50 at a Turning Point? Key Levels & Market Outlook AheadThe Nifty 50 ended the week at 25,112.40 with a gain of 1.59%
If Nifty sustains below 25,033, selling pressure may increase. However, a move above 25,192 could restore bullish momentum.
Key Levels for the Upcoming Week
🔹 Price Action Pivot Zone:
The crucial range to watch for potential trend reversals or continuation is 25,033 -25,192.
🔹 Support & Resistance Levels:
Support:
S1: 24,797
S2: 24,482
S3: 24,093
Resistance:
R1: 25,431
R2: 25,750
R3: 26,144
Market Outlook
✅ Bullish Scenario: A sustained breakout above 25,192 could attract buying momentum, driving Nifty towards R1 (25,431) and beyond.
❌ Bearish Scenario: A drop below 25,033 may trigger selling pressure, pushing Nifty towards S1 (24,797) or lower.
Disclaimer: lnkd.in

Nifty June 4th Week AnalysisNifty is looking positive for the upcoming week. Closing above 25000 is giving confidence for upside momentum upto 25500. Only caution for upside is global tensions which can hamper the momentum . On the downside, if Nifty breaches 25000-24900 range only then we can expect downside move upto 24750-650.
ALL LEVELS ARE MARKED IN THE CHART POSTED.
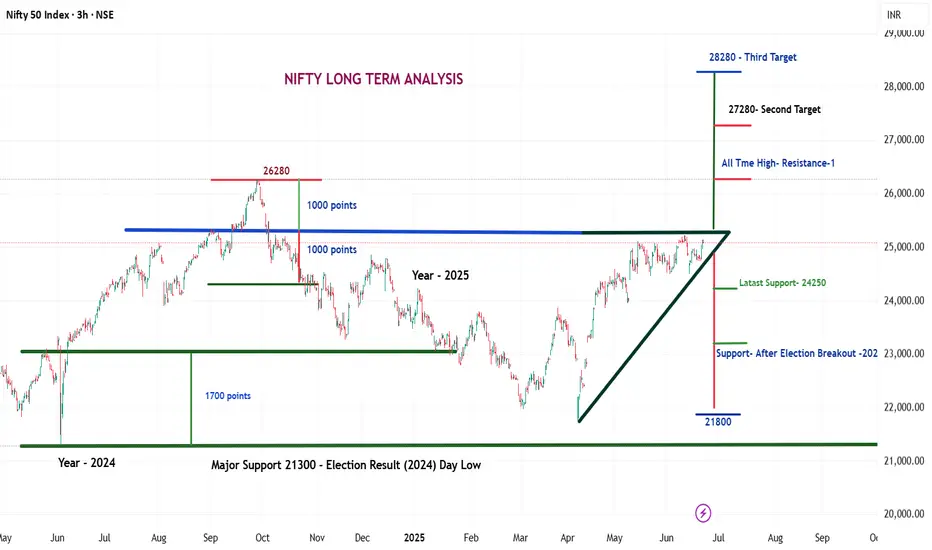
Nifty Chart Analysis – Major Breakout or Breakdown Ahed
Assending Triangle Chart pattern in Nifty- Breakout Possible ?
As of June 21, 2025, the Nifty 50 index is showing a strong and potentially decisive Ascending Triangle Pattern on the 3-hour time frame.
This formation typically indicates a bullish breakout if confirmed with volume. Let’s dive deep into the technical outlook and key levels that traders and investors should watch.
Current Market Overview
Current Nifty Level: ~25,080
Pattern Identified: Ascending Triangle
Time Frame: 3H (Medium-Term to Long-Term Insight)
An Ascending Triangle is a bullish continuation pattern formed by a horizontal resistance line and a rising trendline of higher lows.
Key Levels to Watch
Resistance Zone:
Immediate Resistance: 26,280 (All-Time High)
Breakout Target 2: 27,280
Breakout Target 3: 28000 (Long-Term)
If Nifty breaks above the 26,280 level with strong volume confirmation, the next upward targets will be 27,280 and possibly 28000 , based on the measured move from the triangle height.
Support Levels:
Latest Support: 24,250
Post-Election Breakout Support: 22,800
Major Support (Election Result Day Low): 21,300
If any major negative trigger (geopolitical or macroeconomic) occurs, a sharp correction can’t be ruled out. The levels mentioned will act as key demand zones.
Potential Global Risks
While the technical setup is bullish, external risks could spoil the party:
Geopolitical Conflicts:
Iran vs. Israel
India vs. Pakistan
China vs. US tensions
Macro-Economic Triggers:
Spike in Inflation or Crude Oil Prices
US Fed Rate Hike Surprises
Global Recession Fears
In such cases, a steep fall toward 22,800 or even 21,300 may occur.
✅ Conclusion & Strategy
The current Nifty setup presents a classic high-reward-low-risk opportunity for long-term traders if a breakout is confirmed. However, caution is advised if global uncertainties increase. Investors should:
Wait for a decisive breakout above 26,280 with volume.
Maintain a stop-loss around 24,250 on long positions.
Consider booking partial profits near resistance levels and re-entering on pullbacks.
How Traders Can Prepare for the Next Move
Whether a breakout or breakdown happens, traders must:
Use proper stop-loss and risk management
Wait for volume confirmation
Watch for FII/DII activity
Combine price action with Data Analysis
Important Note:
This analysis is based on current chart patterns and known global events. Always use proper risk management and consult with a financial advisor before taking investment decisions.
💬 Like the chart if you found it useful
🗣 Comment your views or questions
👤 Follow us for regular breakout updates
🔁 Share this chart with your trading community and friends who follow Nifty!
✅ Let’s grow together with smart chart analysis and technical strategies.