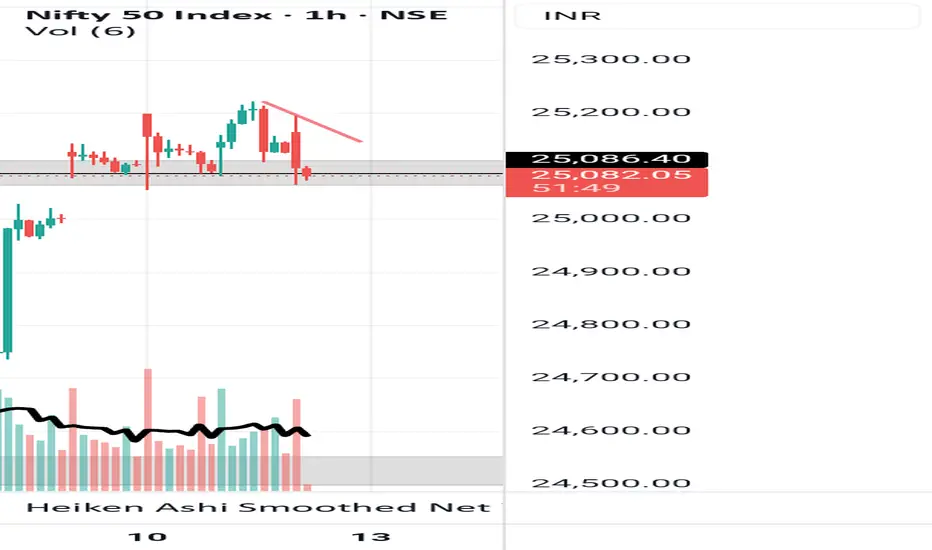
Nifty Bearish . Trend directionNifty 24888 has formed an UT and has fallen. Trend is bearish.
Efforts were average but results were high due to fear factor. Some short covering pushed Nifty from low 24844 to 24888. Support at 24742,24540 and resistance at 24954.
We expect a fair chance will be given to bulls if they could move Nifty above 24888 to take nifty to resistance before moving to support. If gap down, panic will drive to 24540 and further,
NIFTY trade ideas
Things heating up between Iran and US. Market takes a nose dive.There is a news of things heating up between Iran and US with regards to Nuclear negotiations. It seems US has asked for reduction of staff at few embassies across the Middle East. In addition to the tragic plane crash in Ahmedabad also might have affected the sentiment. Market had already nosedived before the tragedy struck so it is hard to say it had any effect. Only logical explanation seems to be the Iran related escalation. On the technical Nifty was not able to hold above 25200 levels even after multiple attempts. This suggests upside-down there were currently no takes for the upside such scenario only leads to a correction and market diving to find a concrete bottom before beginning the next upward movement. The geo-political developments should be closely watched to speculate about further moves of market.
The zone between 24818 to 24672 has multiple supports including trend line support and mid-channel support and Father line support at 24672 as it can be seen in the chart. A closing below 24672 will only give the advantage to the bears who can further drag the Nifty towards 24492, 24382 or 24208 (Channel bottom support). Things get worse beyond this point but we will only talk about it if we get a closing below this level.
Resistance on the upside remain at 24902, 24974 (Mother line Resistance), 25043, 25138 and 25223. If we get a closing above 25223 then the channel top will be around 25337. Regarding the levels above 25337 we will post once we reach that stage.
Disclaimer: The above information is provided for educational purpose, analysis and paper trading only. Please don't treat this as a buy or sell recommendation for the stock or index. The Techno-Funda analysis is based on data that is more than 3 months old. Supports and Resistances are determined by historic past peaks and Valley in the chart. Many other indicators and patterns like EMA, RSI, MACD, Volumes, Fibonacci, parallel channel etc. use historic data which is 3 months or older cyclical points. There is no guarantee they will work in future as markets are highly volatile and swings in prices are also due to macro and micro factors based on actions taken by the company as well as region and global events. Equity investment is subject to risks. I or my clients or family members might have positions in the stocks that we mention in our educational posts. We will not be responsible for any Profit or loss that may occur due to any financial decision taken based on any data provided in this message. Do consult your investment advisor before taking any financial decisions. Stop losses should be an important part of any investment in equity.
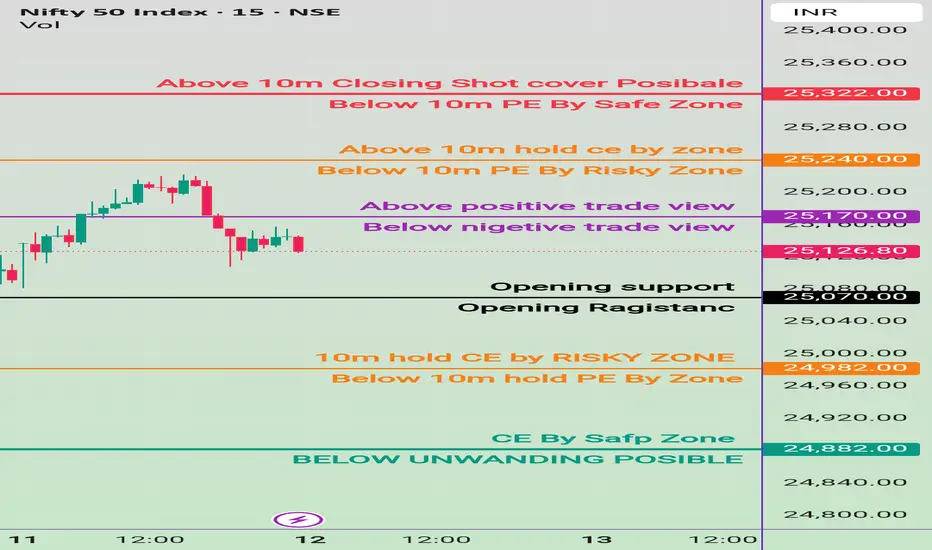
13june Nifty50 brekout and Breakdown leval✅ Bullish (Buy/Call - CE) Zones:
24628–Above 10m hold CE by zone
24788 –Above 10m hold CE by zone
24970 –Above 10m hold CE by zone
25170 –Above 10m hold CE by zone
25388 - Above 10m Closing: Shot Cover Possible
24488 -Above 10m hold CE By Safe Zone
Bearish (Buy/Put - PE) Zones:
25388 -Below 10m hold PE by zone
25170 –Below 10m hold PE by zone
24970 -Below 10m PE By Risky Zone
24628 -Below 10m Hold PE by Risky Zone
24488. BELOW UNWINDING POSSIBLE
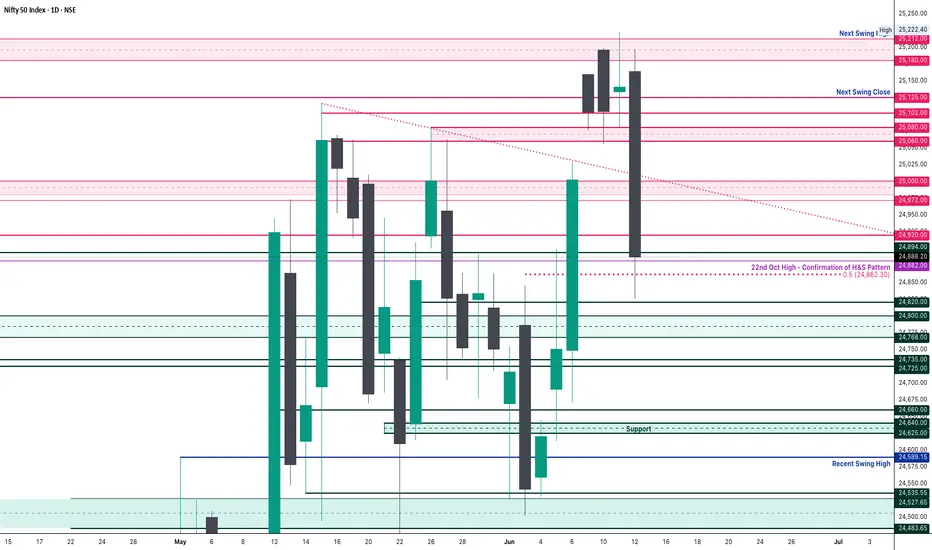
Nifty Analysis EOD – June 12, 2025 – Thursday🟢 Nifty Analysis EOD – June 12, 2025 – Thursday 🔴
📉 Range Breakout on Expiry – Bears Steal the Show
As highlighted in yesterday’s note — “Watch 25,222 on the upside and 25,080 on the downside for breakout” — Thursday’s expiry session decisively broke the range to the downside, unleashing a sharp bearish move.
Nifty opened strong at 25,164.45, briefly tested 25,196, but once again failed to challenge 25,200. The rejection triggered a slide to 25,083, and shortly after, the critical support of 25,080 gave way. This breakdown triggered long unwinding and fresh shorts, accelerating the fall all the way to 24,825.90 — a sharp 197-point drop.
Though there was a brief 90-point retracement, that too was sold into, and the index closed at 24,888.20 (adjusted), very close to the day’s low. This fall filled the Gaps created on June 6 and 9, and settled around the 0.5 Fibonacci retracement level (based on June 3 low to June 11 high).
With such a close, the market signals a strong shift in sentiment. Going ahead, 24800–24768 becomes a critical support zone. Bulls now need to reclaim and close above 25,020 to regain any strength. Until then, bias remains bearish.
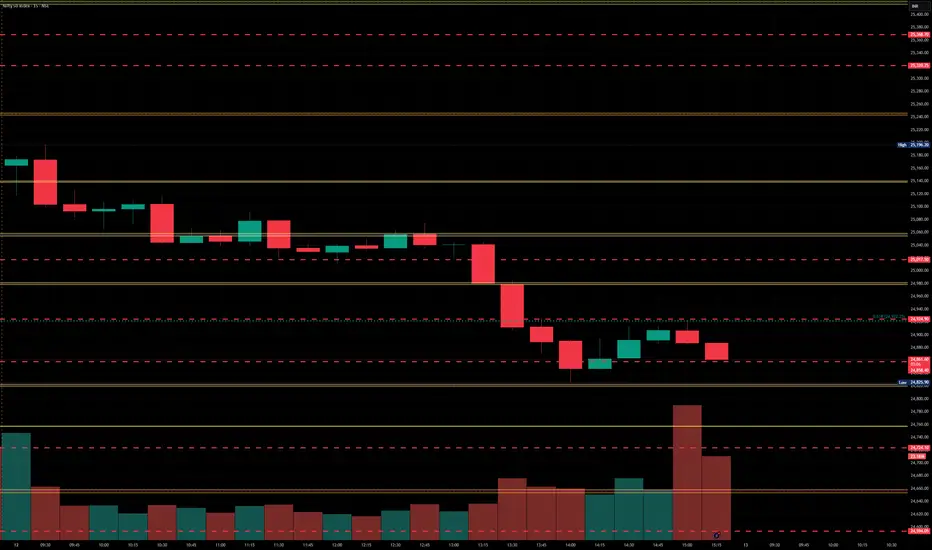
🛡 5 Min Chart with Levels
🕯 Daily Time Frame Chart
🕯 Daily Candle Breakdown
Open: 25,164.45
High: 25,196.20
Low: 24,825.90
Close: 24,888.20
Net Change: −253.20 (−1.01%)
📊 Candle Structure Breakdown
Real Body: 276.25 pts → 🔴 Strong Red Candle
Upper Wick: 31.75 pts
Lower Wick: 62.30 pts
🔍 Interpretation
Bears dominated from start to finish, with hardly any resistance from the bulls.
The close near the day’s low reinforces strong bearish sentiment.
The lower wick is minimal — buying interest was absent post-selloff.
🔦 Candle Type
🔥 Bearish Marubozu–like Candle– Reflects powerful downside momentum and strong seller conviction.
📌 Key Insight
The candle wipes out 3 sessions of buildup — textbook bearish breakdown.
Support at 24,820–24,850 is critical. A breakdown from here could invite deeper correction.
Only a close above 25,020 can negate this bearish tone. Otherwise, weakness may persist.
🛡 5 Min Intraday Chart
⚔️ Gladiator Strategy Update
ATR: 252.81
IB Range: 131.4 → Medium IB
Market Structure: Balanced
Trades:✅ 11:10 AM – Short Triggered → Target Achieved, Trailing SL Hit (RR: 1:4.65)
📌 Support & Resistance Zones
Resistance Levels
24,920
24,972 ~ 25,000
25,060 ~ 25,080
25,102
25,125
25,180 ~ 25,212
Support Levels
24,820
24,800 ~ 24,768
24,735 ~ 24,725
24,660
24,640 ~ 24,625
💭 Final Thoughts
With a decisive range breakdown and expiry volatility behind us, the battle zone shifts to 24,800–25,000. Expect more pressure if bulls fail to reclaim 25,020.
🧠 “Markets don’t wait forever at the edge of range—they break, and break hard.”
✏️ Disclaimer
This is just my personal viewpoint. Always consult your financial advisor before taking any action.
Nifty levels - Jun 13, 2025Nifty support and resistance levels are valuable tools for making informed trading decisions, specifically when combined with the analysis of 5-minute timeframe candlesticks and VWAP. By closely monitoring these levels and observing the price movements within this timeframe, traders can enhance the accuracy of their entry and exit points. It is important to bear in mind that support and resistance levels are not fixed, and they can change over time as market conditions evolve.
The dashed lines on the chart indicate the reaction levels, serving as additional points of significance to consider. Furthermore, take note of the response at the levels of the High, Low, and Close values from the day prior.
We hope you find this information beneficial in your trading endeavors.
* If you found the idea appealing, kindly tap the Boost icon located below the chart. We encourage you to share your thoughts and comments regarding it.
Wishing you success in your trading activities!
Nifty 50 At Key Resistance– Trendline Retest or Bullish BreakoutChart Type: Daily (1D)
Index: Nifty 50 (NSE)
Current Price: ₹24,866
Date: June 12, 2025
🔍 Technical Analysis:
Rising Channel:
Nifty 50 is trading within a well-defined ascending channel. The recent price action shows a strong bounce from the lower channel trendline, but today's candle indicates rejection near the upper boundary around ₹25,300.
Resistance Zone:
The level ₹25,301 is acting as a major resistance zone. A decisive close above this could push Nifty towards ₹25,600–25,800.
Support Levels:
Immediate support rests around ₹24,600 (channel midline) and stronger support near ₹24,250–24,100 (aligned with moving averages).
Moving Averages:
Price is comfortably above both the 50 EMA and 200 EMA, indicating a bullish medium-to-long term trend.
50 EMA ≈ ₹24,253
200 EMA ≈ ₹24,083
MACD Indicator:
MACD line is above the signal line but showing signs of a potential bearish crossover. Momentum is slowing, so short-term caution is advised.
Volume:
Selling volume is picking up—watch for confirmation. If accompanied by a breakdown below ₹24,600, a short-term correction could begin.
📌 Trade Plan:
Bullish Bias:
If Nifty breaks and sustains above ₹25,301 with strong volume, expect upside towards ₹25,600–₹25,800.
Bearish Bias:
Rejection at resistance and break below ₹24,600 could lead to a fall toward ₹24,250, and even ₹23,800 in the short term.
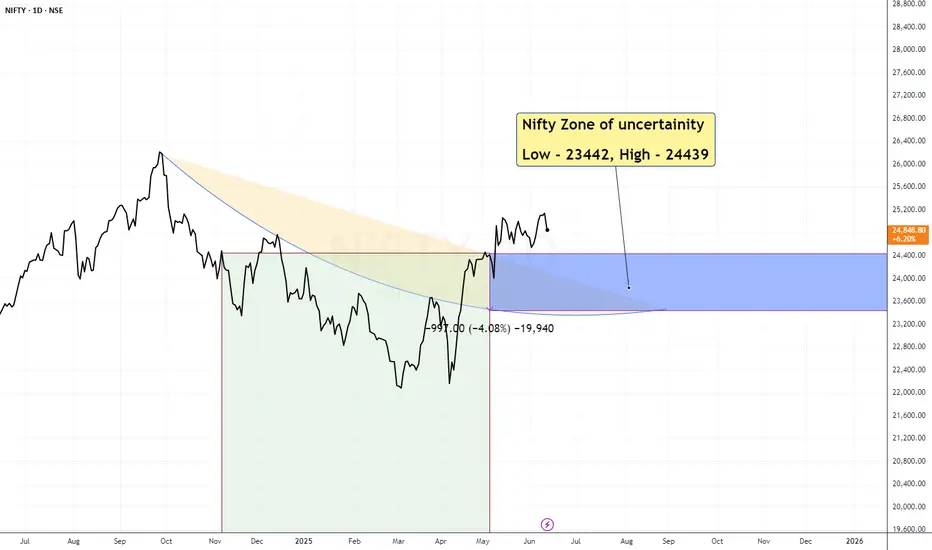
NIFTY ZONE OF UNCERTAINITY NIFTY ZONE OF UNCERTAINITY . Know what to expect and plan accordingly to Buy or Sell
Regards
Psycho Trader
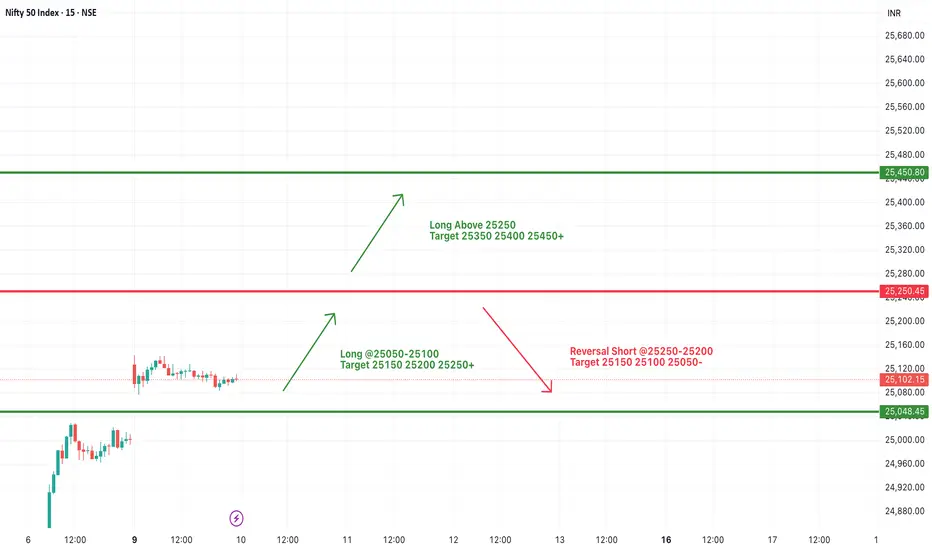
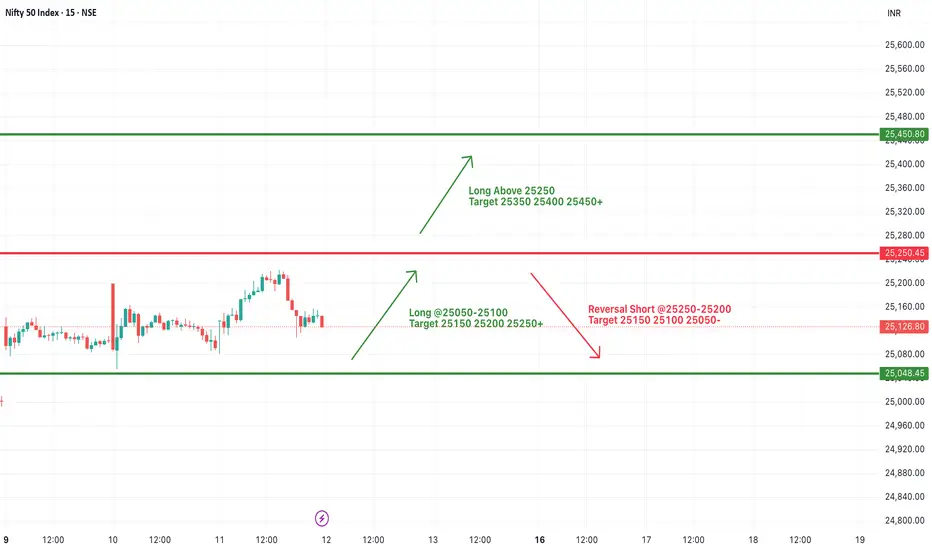
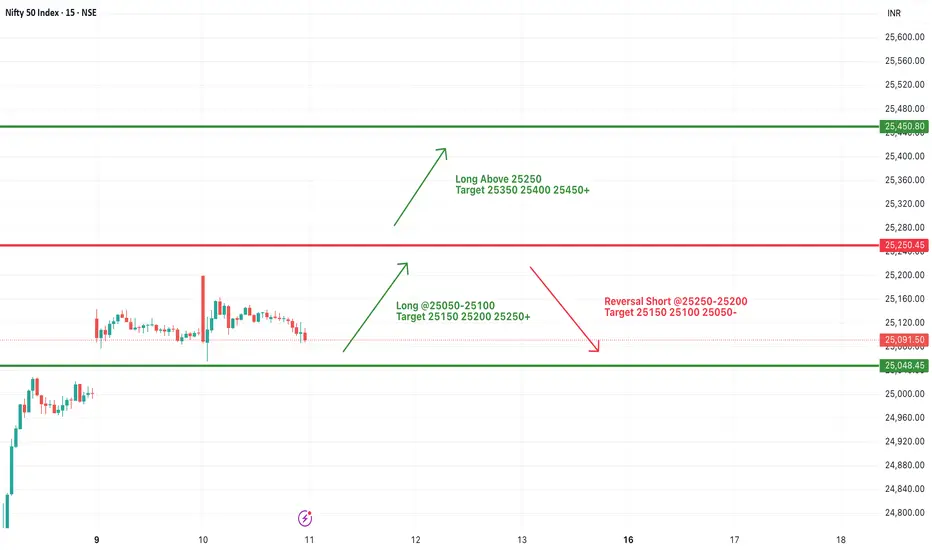
#NIFTY Intraday Support and Resistance Levels - 12/06/2025Today, a gap-up opening is expected in Nifty near the 25250 level. If Nifty sustains above this zone, we may see bullish momentum extending toward the targets of 25350, 25400, and potentially 25450+ during the session.
However, if Nifty fails to hold above 25250 and begins reversing below 25200, it could trigger a pullback move. A reversal short opportunity may arise in the 25250–25200 range with potential downside targets of 25150, 25100, and 25050.
Overall sentiment remains bullish above 25250, but volatility is likely near resistance levels. Traders are advised to keep tight stop-losses and trail profits cautiously, as the market may remain range-bound with occasional spikes.
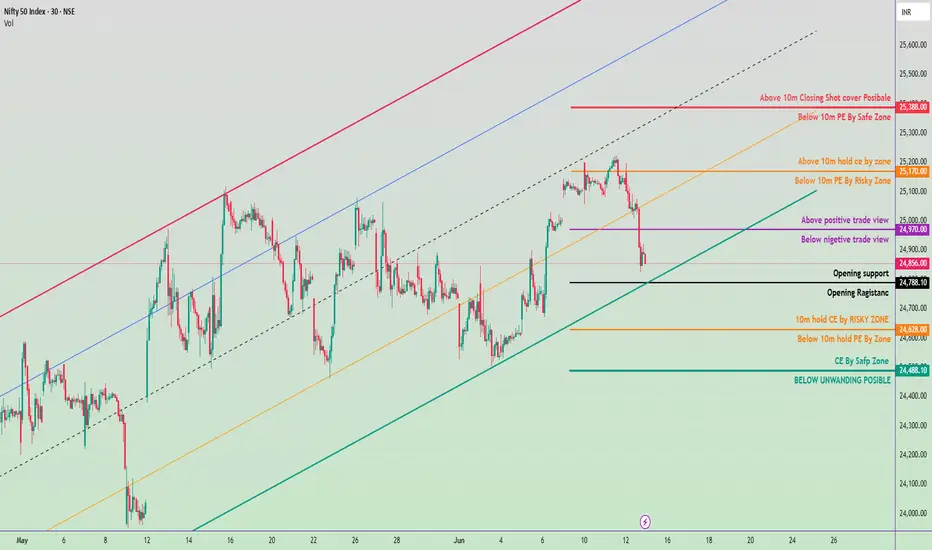
12 june Nifty50 brekout and Breakdown leval
🔼 Call Option (CE) Buy Zones
Above 25,170 → Positive trade view begins
Buy CE if 15m candle sustains above this level.
Target 25,240 → 25,280 → 25,322
SL: below 25,126 (Negative trade zone begins)
Above 25,240 → Strong bullish momentum zone
Aggressive CE buying opportunity.
Possible target: 25,280 → 25,322+ (Short covering possible)
Above 25,322 → Short covering rally zone
Strong CE momentum, consider trailing SL to protect profits.
🔽 Put Option (PE) Buy Zones
Below 25,170 → Negative trade view starts
Buy PE if 15m candle closes below this level.
Target: 25,126 → 25,070
Below 25,070 → Opening support break
More downside expected.
Target: 24,982 → 24,882
Below 24,882 → Unwinding zone
PE strong zone, deep downside risk.
Target: 24,800 and below
Safe for swing PE traders
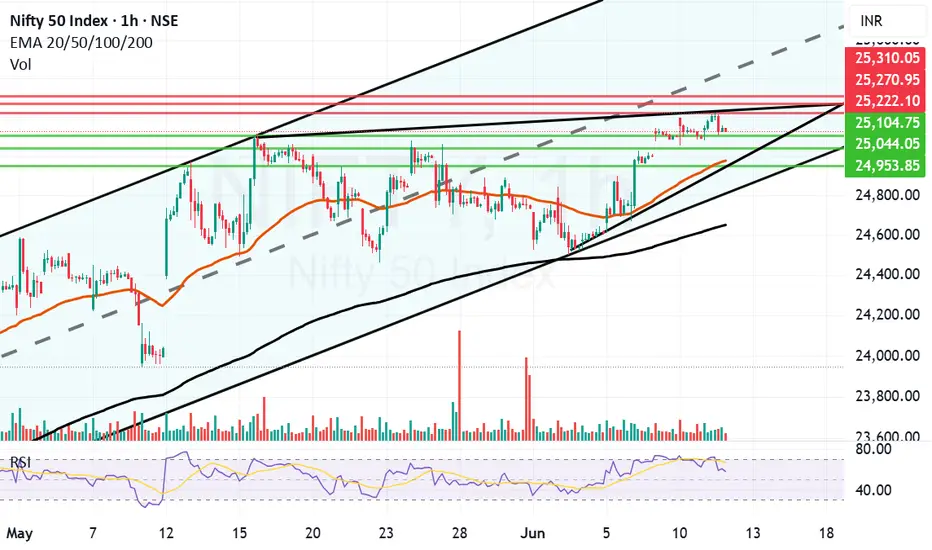
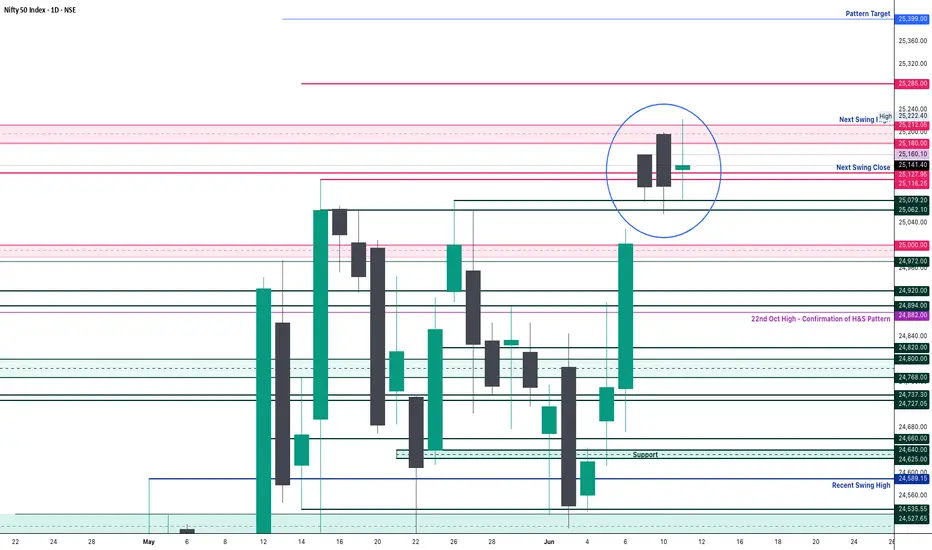
Nifty Facing resistnace above 25200 zoneToday Nifty closing above 25141 is a positive sign but it is evidently facing resistnace above 25200 zone. Nifty made a high of 25222 today but could not sustain at those levels and fell but eventually closed in the positive. The daily candle formed is an indecisive Doji.
IT Sector seems to be on the verge of a Reverse Head and Shoulder Breakout. If this breakout happens and Nifty gets support from other heavy weights we can see it growing further.
The resistances for Nifty now are at 25222, 25270 and 25310.
The supports for Nifty are at 25104, 25044, 24977 (Mother line support of Daily chart and 24953 Channel bottom. Things are in balance with shadow of the candle slightly positive.
Disclaimer: The above information is provided for educational purpose, analysis and paper trading only. Please don't treat this as a buy or sell recommendation for the stock or index. The Techno-Funda analysis is based on data that is more than 3 months old. Supports and Resistances are determined by historic past peaks and Valley in the chart. Many other indicators and patterns like EMA, RSI, MACD, Volumes, Fibonacci, parallel channel etc. use historic data which is 3 months or older cyclical points. There is no guarantee they will work in future as markets are highly volatile and swings in prices are also due to macro and micro factors based on actions taken by the company as well as region and global events. Equity investment is subject to risks. I or my clients or family members might have positions in the stocks that we mention in our educational posts. We will not be responsible for any Profit or loss that may occur due to any financial decision taken based on any data provided in this message. Do consult your investment advisor before taking any financial decisions. Stop losses should be an important part of any investment in equity.
Nifty Analysis EOD – June 11, 2025 – Wednesday🟢 Nifty Analysis EOD – June 11, 2025 – Wednesday 🔴
♻️ Déjà vu Day – Bulls Attempt, Bears Resist
For the third consecutive session, Nifty started on a positive note with a 45-point gap-up at 25,134.15, but as has been the pattern lately, early optimism was wiped out instantly, with the index hitting the day’s low of 25,081 within the first 5 minutes.
What followed was a gradual climb as bulls gained some momentum, pushing Nifty to test the 25,200 zone. However, resistance in the 25,200–25,222 band proved too strong. Despite multiple attempts, bulls gave up the level around 13:20, triggering a sharp fall to 25,100.
Post-fall, the market struggled to recover and closed at 25,141.40, up just 37 points from the previous close. It was yet another rangebound, indecisive session, showing that the index is coiling for a potential breakout—but the direction remains uncertain.
🛡 5 Min Chart with Levels
🕯 Daily Time Frame Chart
🕯 Daily Candle Breakdown
Open: 25,134.15
High: 25,222.40
Low: 25,081.30
Close: 25,141.40
Net Change: +37.15 (+0.15%)
📊 Candle Structure Breakdown
Real Body: 7.25 pts → 🟢 Small Green Candle
Upper Wick: 81.00 pts
Lower Wick: 52.85 pts
🔍 Interpretation
Strong intra-day swings in both directions signal high volatility with no control on either side.
Bulls failed at resistance (25,222); bears couldn’t break support (25,081).
The tiny real body with long shadows reflects market indecision.
🔦 Candle Type
⚖️ Spinning Top– Neutral structure with no clear directional conviction.
📌 Key Insight
The market is clearly taking a breather after recent moves.
Watch 25,222 on the upside and 25,080 on the downside — a breakout from either could set the next directional tone.
Bias stays mildly bullish as long as 25,080 holds, but it’s hanging by a thread.
🛡 5 Min Intraday Chart
⚔️ Gladiator Strategy Update
ATR: 239.75
IB Range: 72.9 → Small IB
Market Structure: Balanced
Trades:✅ 10:30 AM – Long Triggered → Target Achieved, Trailing SL Hit (RR: 1:1.65)
📌 Support & Resistance Zones
Resistance Levels
25,116 ~ 25,128
25,180 ~ 25,222
25,285
Support Levels
25,062 ~ 25,070
24,972
24,920 ~ 24,894
24,800 ~ 24,768
💭 Final Thoughts
Market is in a tight tug-of-war. No clear winner yet, but momentum can build quickly once a side gives in.Patience will pay—wait for the range breakout.
🧠 "Pressure builds silently before an explosion—so does the market before a breakout."
✏️ Disclaimer
This is just my personal viewpoint. Always consult your financial advisor before taking any action.
Nifty levels - Jun 12, 2025Nifty support and resistance levels are valuable tools for making informed trading decisions, specifically when combined with the analysis of 5-minute timeframe candlesticks and VWAP. By closely monitoring these levels and observing the price movements within this timeframe, traders can enhance the accuracy of their entry and exit points. It is important to bear in mind that support and resistance levels are not fixed, and they can change over time as market conditions evolve.
The dashed lines on the chart indicate the reaction levels, serving as additional points of significance to consider. Furthermore, take note of the response at the levels of the High, Low, and Close values from the day prior.
We hope you find this information beneficial in your trading endeavors.
* If you found the idea appealing, kindly tap the Boost icon located below the chart. We encourage you to share your thoughts and comments regarding it.
Wishing you success in your trading activities!
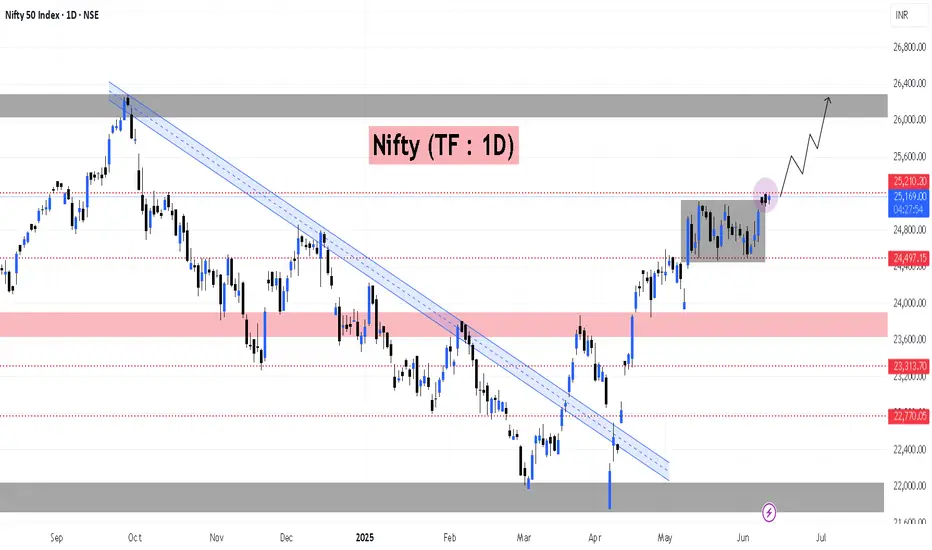
3rd day, and price still hovering within the same range! 📍 Nifty (TF : 1D)
3rd day, and price still hovering within the same range!
Next Hurdle for Nifty @ 25210 / 25325 above this price action indication a stable drive towards 26000 & above
📌 Major Data : US CPI (IST 6:00 PM)
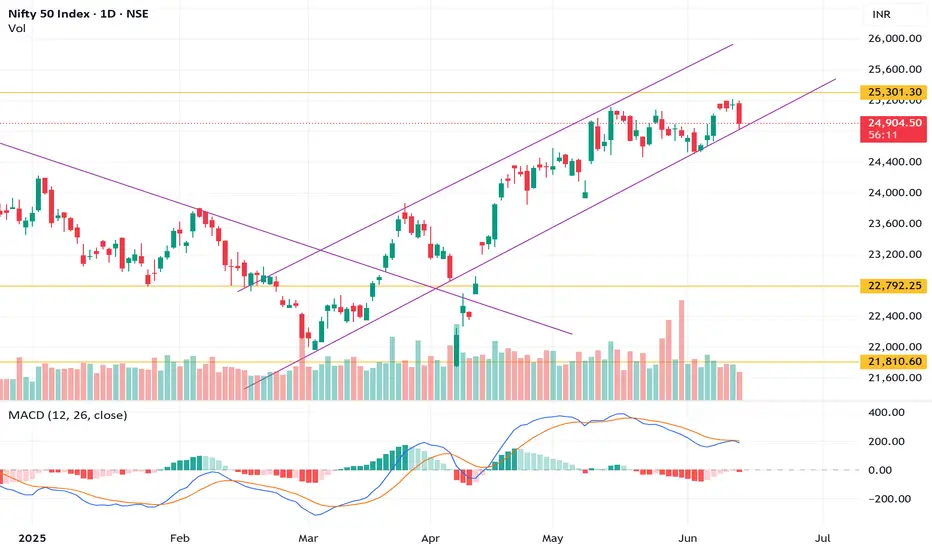
NIFTY 50 Approaching Resistance – Watch for Breakout or ReversalNifty 50 is trading at 25,175, staying strong inside a rising parallel channel since early April. Price action is consolidating just below the key resistance zone at 25,301, which is also the upper boundary of the channel.
Key Levels:
🔼 Resistance Levels:
25,301 – Immediate resistance (channel top)
25,500+ – Possible breakout target if channel is breached
🔽 Support Levels:
24,700 – Channel midline and recent support
24,080 – 50-day moving average
22,792 – Previous major swing low
21,810 – Strong horizontal support zone
Indicators:
MACD is turning bullish again after a minor pullback, hinting at a possible continuation.
Volume has slightly decreased, signaling caution near the top.
Price is above both the 50-day and 200-day moving averages, supporting the bullish structure.
Conclusion:
Nifty is at a crucial juncture. A breakout above 25,301 could trigger further upside momentum, while failure to break may lead to a healthy pullback toward support zones. Keep a close eye on price action near the channel resistance for confirmation.

MARKET DIRECTIONPosiible path of Nifty looking strong after sustain last CHOCH and BOS confirmation looking for top 25750 order block of larg selling orders here seller can not holding to bear the market they need mor order to sell those are present at 25750 only

#NIFTY Intraday Support and Resistance Levels - 11/06/2025Nifty opened with a slight gap-up near the 25100 level, continuing its recent pattern of consolidation. Despite the positive opening, the index remains well within its established range, suggesting that market participants are still awaiting a decisive breakout. There are no major changes observed in key support or resistance levels compared to the previous sessions, reinforcing the view that the market is currently lacking strong directional momentum.
On the upside, if Nifty sustains above the 25100–25250 zone, it could attempt a move toward 25350, followed by 25400 and potentially 25450+. However, this upward move will require strong follow-through buying to break the current consolidation zone. Until then, any intraday rallies may face resistance near the 25250 mark, making it a crucial level to watch for bulls.
Conversely, failure to hold above the 25200–25250 region could lead to a reversal toward 25150, and if selling pressure intensifies, a further decline toward 25100 and 25050 may unfold. These levels are important short-term supports and have previously acted as buying zones. A break below 25050 may open the gates for deeper cuts, though that remains unlikely unless broader market sentiment weakens.
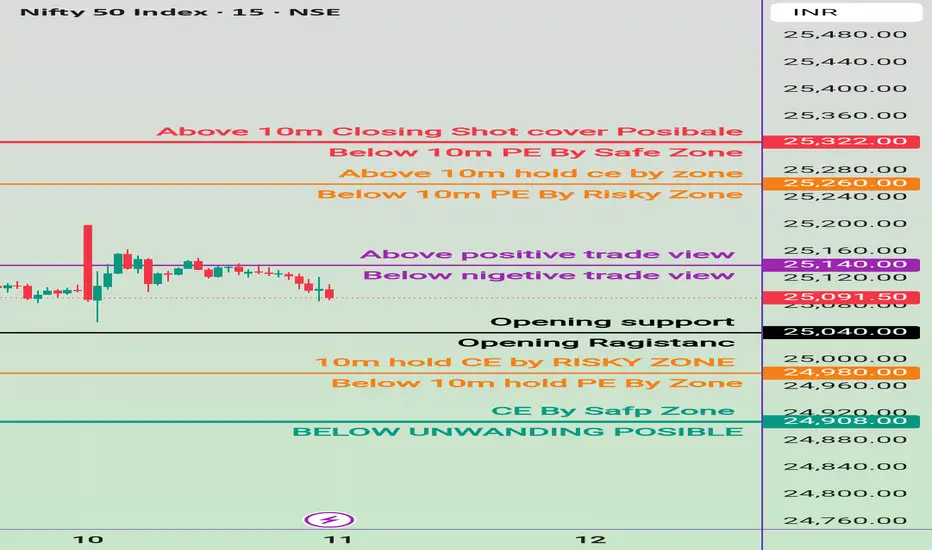
11 june Nifty50 brekout and Breakdown leval Nifty 50 Index, here's a breakdown of the "Sell Levels" from a trading strategy point of view:
📉 Key Sell (Put Entry / PE) Zones:
25,140 – Below this level:
Tagged as "Below nigetive trade view"
This suggests initiating bearish positions (sell or buy PE) if price falls below this
25,040 – Opening Support / Resistance:
If price breaks below this with volume, it's a confirmed breakdown, suitable for short trades.
24,980 – above 10m hold CE by RISKY ZONE:
Below this, call options (CE) become risky. Could start unwinding.
24,980 – Below 10m hold PE By Zone:
Strong confirmation to hold PE positions.
24,908 – CE By Safe Zone:
A very strong bearish confirmation if price dips below this.
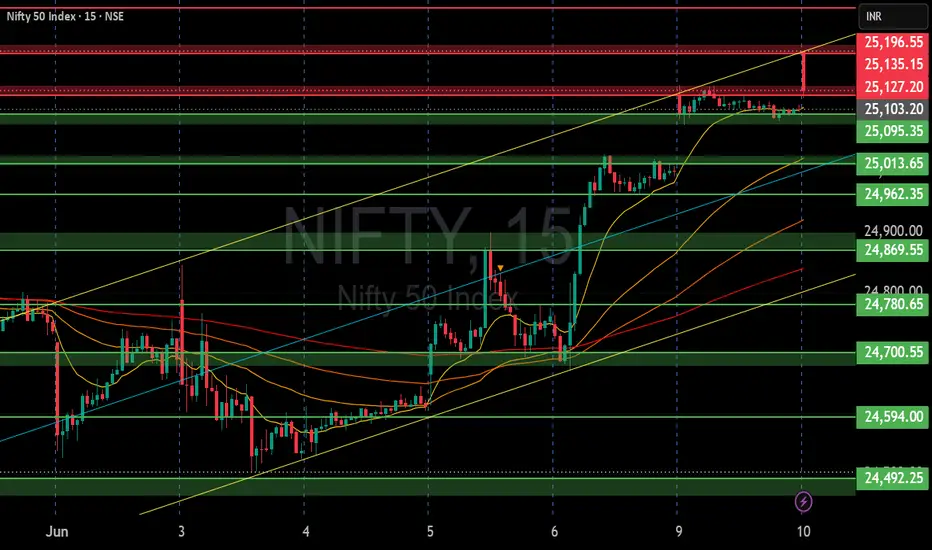
Nifty Analysis EOD – June 10, 2025 – Monday🟢 Nifty Analysis EOD – June 10, 2025 – Monday 🔴
🔄 Fallback From the Top – Another Rangebound Day
Nifty began the session on a bullish note with a Gap-Up of 97 points at 25,199.30, but that turned out to be both the Open and High of the day.
Within the first 20 minutes, the index plunged 144 points, even breaking below the previous day’s low, signaling a swift sentiment shift. However, just a few minutes later, it rebounded sharply and tested the previous day’s high — not surprising, given the narrow range of the prior session.
But after 11:00 AM, the action dried up. The rest of the day saw tight, sideways movement within just 35 points, eventually closing at 25,104.25, barely 1 point above the previous close.
On paper, it looks like a neutral session, but price action reveals weakness and distribution near the top. Bulls need to reclaim control quickly, or the door opens for a short-term dip.
🛡 5 Min Chart with Levels
🕯 Daily Time Frame Chart
🕯 Daily Candle Breakdown
Open: 25,196.05
High: 25,199.30
Low: 25,055.45
Close: 25,104.25
Net Change: +1.05 (0.00%)
📊 Candle Structure Breakdown
Real Body: 91.80 pts → 🔴 Red Candle (Close < Open)
Upper Wick: 3.25 pts (Very Small)
Lower Wick: 48.80 pts
🔍 Interpretation
Price opened at the top, immediately reversed, and closed near the lower end of the day’s range.
Despite the flat close, the intraday structure is weak, showing signs of profit booking or early distribution.
The small upper wick reflects no follow-through buying.
🔦 Candle Type
🟥 Bearish Candle with Long Body and Lower Wick– Often seen during pullbacks or trend pauses.
📌 Key Insight
Support near 25,050–25,070 is critical—if it breaks, expect further downside pressure.
Bulls must reclaim 25,200 to keep the uptrend intact.
🛡 5 Min Intraday Chart
⚔️ Gladiator Strategy Update
ATR: 250.71
IB Range: 143.85 → Medium IB
Market Structure: Balanced
Trades:❌ No Trade Triggered by the system
📌 Support & Resistance Zones
Resistance Levels
25,116 ~ 25,128
25,180 ~ 25,212
25,285
Support Levels
25,062 ~ 25,070
24,972
24,920 ~ 24,894
24,800 ~ 24,768
💭 Final Thoughts
Market is playing inside a box, testing patience on both sides.Expansion is near, but which way? Keep risk defined and emotions in check.
🧠 “Don't mistake silence for weakness. The market is coiling—ready to snap.”
✏️ Disclaimer
This is just my personal viewpoint. Always consult your financial advisor before taking any action.
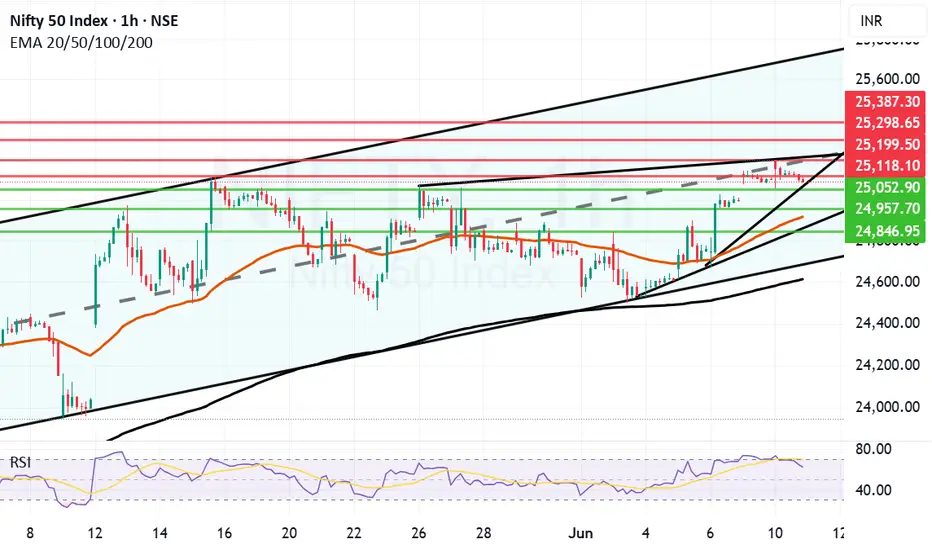
Nifty facing trendline resistance and RSI cooling down. Nifty had come close to overbought zone. Not that it was immensely overbought. It is also facing a trendline resistance which is hampering it's further progress. Bears are trying their best to bring it down while Bulls are trying to pull it above the trend line. The trade is in perfect balance right now. Once during the day Nifty had broken the trendline resistnace too as it made a high of 25199 but could not sustain the levels and was pulled down immediately. 25055 provided support and kept it Flat.
Supports for Nifty now remain at 25052, 24957, 24917 (Mother line of hourly chart), 24846 is another trend line support. Father line support is at 24614. Below this level bears will take over.
Resistances for Nifty remain at 25118, 25199 (Trend line resistance), A closing above 25199 will enable and empower bears as this will be a closing above mid channel resistance too. In such a scenario Bulls can further full Nifty upwards towards 25298 and 25387 levels.
Disclaimer: The above information is provided for educational purpose, analysis and paper trading only. Please don't treat this as a buy or sell recommendation for the stock or index. The Techno-Funda analysis is based on data that is more than 3 months old. Supports and Resistances are determined by historic past peaks and Valley in the chart. Many other indicators and patterns like EMA, RSI, MACD, Volumes, Fibonacci, parallel channel etc. use historic data which is 3 months or older cyclical points. There is no guarantee they will work in future as markets are highly volatile and swings in prices are also due to macro and micro factors based on actions taken by the company as well as region and global events. Equity investment is subject to risks. I or my clients or family members might have positions in the stocks that we mention in our educational posts. We will not be responsible for any Profit or loss that may occur due to any financial decision taken based on any data provided in this message. Do consult your investment advisor before taking any financial decisions. Stop losses should be an important part of any investment in equity.
Nifty levels - Jun 11, 2025Nifty support and resistance levels are valuable tools for making informed trading decisions, specifically when combined with the analysis of 5-minute timeframe candlesticks and VWAP. By closely monitoring these levels and observing the price movements within this timeframe, traders can enhance the accuracy of their entry and exit points. It is important to bear in mind that support and resistance levels are not fixed, and they can change over time as market conditions evolve.
The dashed lines on the chart indicate the reaction levels, serving as additional points of significance to consider. Furthermore, take note of the response at the levels of the High, Low, and Close values from the day prior.
We hope you find this information beneficial in your trading endeavors.
* If you found the idea appealing, kindly tap the Boost icon located below the chart. We encourage you to share your thoughts and comments regarding it.
Wishing you success in your trading activities!
NIFTY S/R Support and Resistance Levels:
Support Levels: These are price points (green line/shade) where a downward trend may be halted due to a concentration of buying interest. Imagine them as a safety net where buyers step in, preventing further decline.
Resistance Levels: Conversely, resistance levels (red line/shade) are where upward trends might stall due to increased selling interest. They act like a ceiling where sellers come in to push prices down.
Breakouts:
Bullish Breakout: When the price moves above resistance, it often indicates strong buying interest and the potential for a continued uptrend. Traders may view this as a signal to buy or hold.
Bearish Breakout: When the price falls below support, it can signal strong selling interest and the potential for a continued downtrend. Traders might see this as a cue to sell or avoid buying.
MA Ribbon (EMA 20, EMA 50, EMA 100, EMA 200) :
Above EMA: If the stock price is above the EMA, it suggests a potential uptrend or bullish momentum.
Below EMA: If the stock price is below the EMA, it indicates a potential downtrend or bearish momentum.
Trendline: A trendline is a straight line drawn on a chart to represent the general direction of a data point set.
Uptrend Line: Drawn by connecting the lows in an upward trend. Indicates that the price is moving higher over time. Acts as a support level, where prices tend to bounce upward.
Downtrend Line: Drawn by connecting the highs in a downward trend. Indicates that the price is moving lower over time. It acts as a resistance level, where prices tend to drop.
Disclaimer:
I am not a SEBI registered. The information provided here is for learning purposes only and should not be interpreted as financial advice. Consider the broader market context and consult with a qualified financial advisor before making investment decisions.
#NIFTY Intraday Support and Resistance Levels - 10/06/2025Nifty is opening with a gap-up near the 25250 level, approaching a crucial resistance zone. This area has previously acted as a turning point, and today's opening could define whether bulls retain control or face exhaustion.
If Nifty sustains above 25250, we can expect further upside momentum toward 25350, 25400, and 25450+. A clean breakout above this level could open the path to short-term bullish continuation.
However, if the index struggles to hold above 25250 and reverses, profit booking may kick in, pulling the index back toward 25150, 25100, and even 25050.
Holding above 25050–25100 will be key for maintaining a positive structure. A breakdown below this zone may shift sentiment in favor of bears.