#Nifty - DailyDate: 06-06-2025
Nifty -
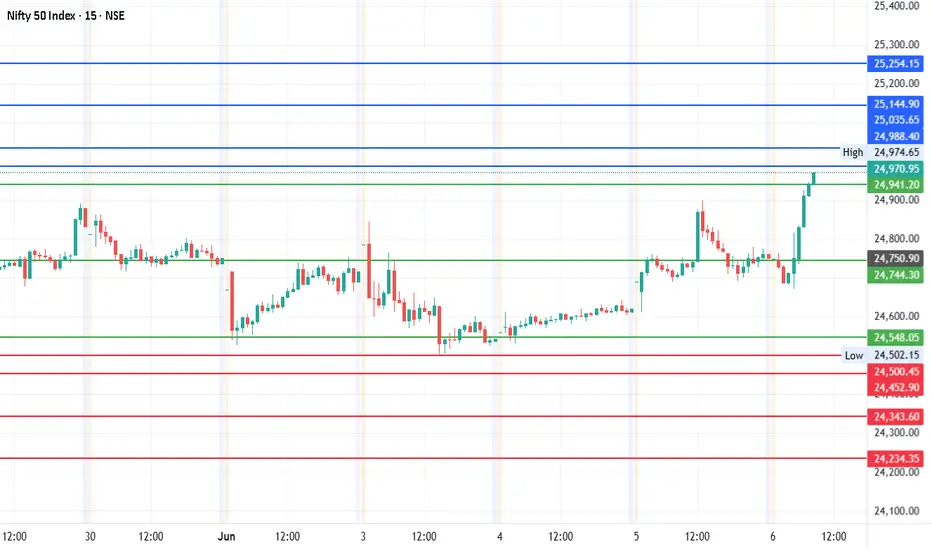
Pivot Point: 24744.26 Support: 24548.05 Resistance: 24941.19
Upside Targets:
Target 1: 24988.41
Target 2: 25035.64
Target 3: 25144.90
Target 4: 25254.17
Downside Targets:
Target 1: 24500.46
Target 2: 24452.875
Target 3: 24343.6075
Target 4: 24234.34
NIFTY trade ideas
10 june Nifty50 brekout and Breakdown leval
🔼 Call Option (CE) Buy Levels:
Above 25,030 (Risky Zone)
"10m hold CE by RISKY ZONE"
Above 25,190 (Positive Trade View Zone)
Confirm bullishness and enter CE trades cautiously.
25,270"Above 10m hold CE by zone" – Strong confirmation.
25,390"Above 10m Closing Shot cover Possible" – Higher breakout level.
🔽 Put Option (PE) Buy Levels:
Below 25,030
"Below 10m hold PE by Zone"
Below 25,190
"Below nigetive trade view" – Sentiment turning bearish.
25,270 Below 10m PE by Risky Zone" – Confirmation of downward pressure.
Below 25,390 10m PE By Safe Zone" – Strong PE entry.
✅ Extra Key Zones:
Opening Support: 25,070
Opening Resistance: 25,030
CE Safe Zone: Above 24,970
Below 24,970: Possible unwinding (strong downside)

Nifty Analysis EOD – June 9, 2025 – Monday🟢 Nifty Analysis EOD – June 9, 2025 – Monday 🔴
🎯 Stuck at the Top – Expansion Coming Soon?
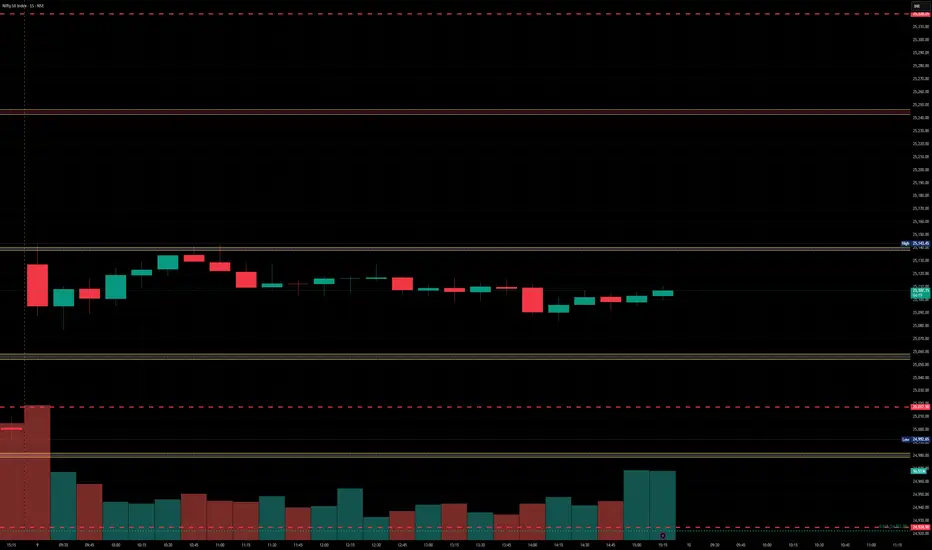
Nifty opened with a strong Gap-Up of 127 points at 25,127, landing right at the upper resistance cap. But from the very first candle, it was clear that the market was unsure—price action showed indecision, and the index could barely add another 16 points before hitting the day’s high of 25,143.45.
From there, the index retraced about 66 points, marking a low at 25,077.15, before attempting a gradual recovery toward the high. But that breakout attempt was unsuccessful, and Nifty drifted back to the mean and closed the day at 25,103.20—essentially wrapping the entire session within a tight 65-point range.
Buyers fought hard to defend 25,100, while sellers tried to fill the morning gap. The narrow range and mean reversion hint at consolidation, setting the stage for a possible expansion in the coming sessions. Stay patient—the coil is tightening.
🛡 5 Min Chart with Levels
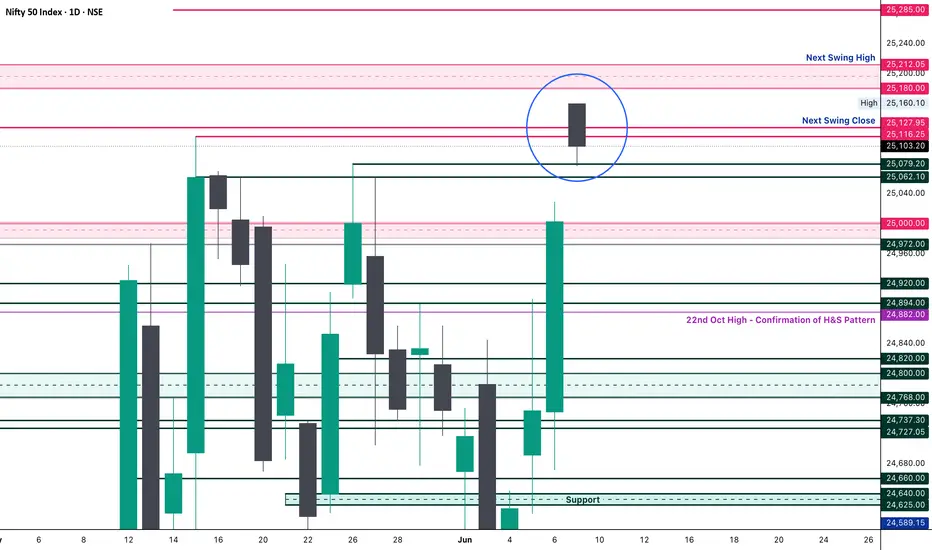
🕯 Daily Time Frame Chart
🕯 Daily Candle Breakdown
Open: 25,160.10
High: 25,160.10
Low: 25,077.15
Close: 25,103.20
Net Change: +100.15 (+0.40%)
📊 Candle Structure Breakdown
Real Body: 56.90 pts → 🔴 Red candle (Close < Open)
Upper Wick: 0 pts (Open = High)
Lower Wick: 26.05 pts
🔍 Interpretation
Price opened at the high and failed to push any higher – showing no strength above the open.
Despite a positive close versus the previous session, the candle is bearish intraday.
The lower wick shows some support, but not enough to flip the bias.
🔦 Candle Type
🟥 Red Inverted Hammer / Bearish Pin Bar– Typically signals weakness or potential reversal, especially when forming near resistance zones.
📌 Key Insight
The structure shows exhaustion or profit booking.
A move below 25,077 could open the door to further downside.
However, holding above 25,100–25,130 will keep bullish hopes alive.
🛡 5 Min Intraday Chart
⚔️ Gladiator Strategy Update
ATR: 262.59
IB Range: 66.3 → Small IB
Market Structure: imBalanced
Trades:❌ No Trade Triggered by the system
📌 Support & Resistance Zones
Resistance Levels
25,116 ~ 25,128
25,180 ~ 25,212
25,285
Support Levels
25,062 ~ 25,070
24,972
24,920 ~ 24,894
24,800 ~ 24,768
💭 Final Thoughts
Today was a pause, not a pullback—yet.With price compressed in a tight band, volatility expansion is likely ahead.
🧠 “Markets don't stay quiet for long. Silence often precedes a scream—watch which direction the breakout takes.”
✏️ Disclaimer
This is just my personal viewpoint. Always consult your financial advisor before taking any action.
NIFTY PREDICTIONThis could play a crucial role in planning strategic entries and understanding when heavy accumulation is likely to begin.

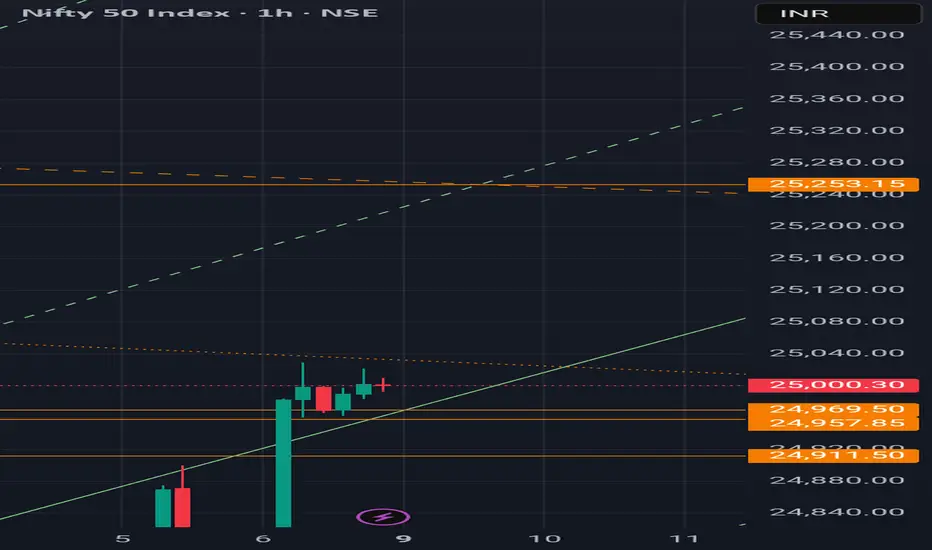
Nifty levels - Jun 10, 2025Nifty support and resistance levels are valuable tools for making informed trading decisions, specifically when combined with the analysis of 5-minute timeframe candlesticks and VWAP. By closely monitoring these levels and observing the price movements within this timeframe, traders can enhance the accuracy of their entry and exit points. It is important to bear in mind that support and resistance levels are not fixed, and they can change over time as market conditions evolve.
The dashed lines on the chart indicate the reaction levels, serving as additional points of significance to consider. Furthermore, take note of the response at the levels of the High, Low, and Close values from the day prior.
We hope you find this information beneficial in your trading endeavors.
* If you found the idea appealing, kindly tap the Boost icon located below the chart. We encourage you to share your thoughts and comments regarding it.
Wishing you success in your trading activities!
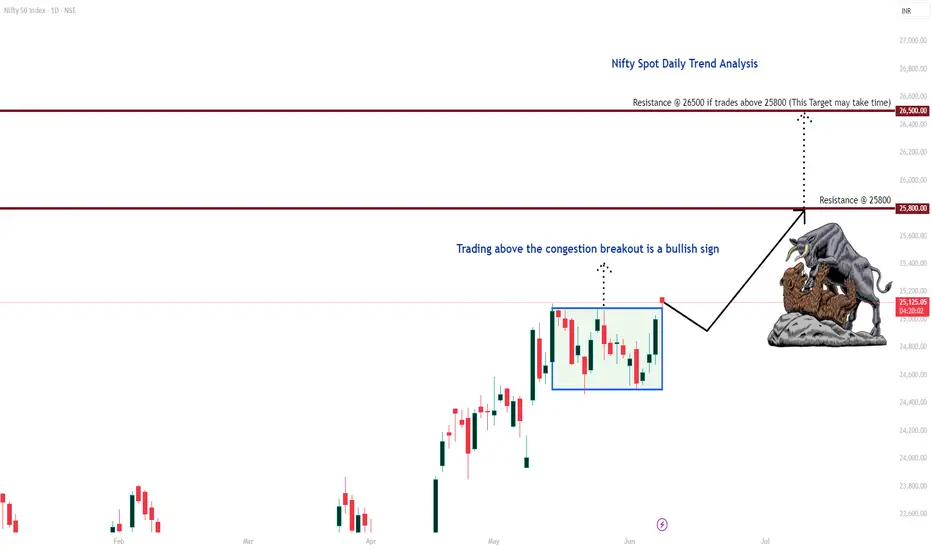
Nifty Daily Trend AnaysisMy Observation:
Nifty Spot had been consolidating within a range for 16 consecutive trading sessions. Today, it broke out decisively and is now trading above that range. If it sustains this breakout, it indicates bullish momentum and the index could potentially rally towards the targets of 25,800 and 26,500.
However, if the market slips back into the previous range, I anticipate support around 24,600—although this scenario seems less likely given the strength of today’s breakout.
Disclaimer: This is purely my personal view and is shared for educational purposes only. Please do your own analysis before making any trading decisions.
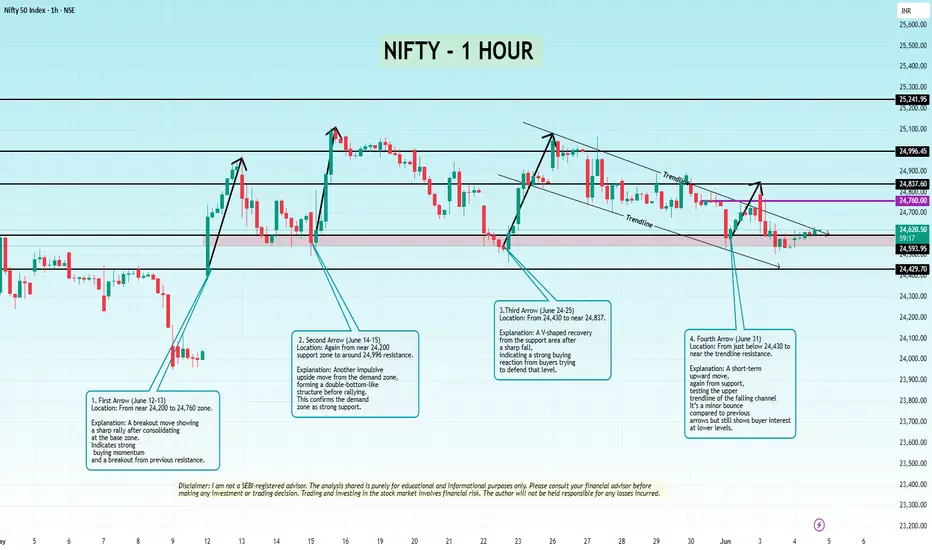
#nifty - 1 hour time frameAll these arrows show strong buyer reactions from support zones (mostly around 24,430–24,590).
The chart indicates a bullish bias at lower levels, but the price is still struggling to break the falling channel trendline (which acts as resistance).
A break above the purple line (24,760) and the upper trendline would confirm a trend reversal or breakout.
NSE:NIFTY
Only for educational purposes.
This content is not a recommendation to buy and sell.
Not SEBI REGISTRAR.
@Tradeforecast
#NIFTY #BANKNIFTY #SENSEX #STOCKMARKET
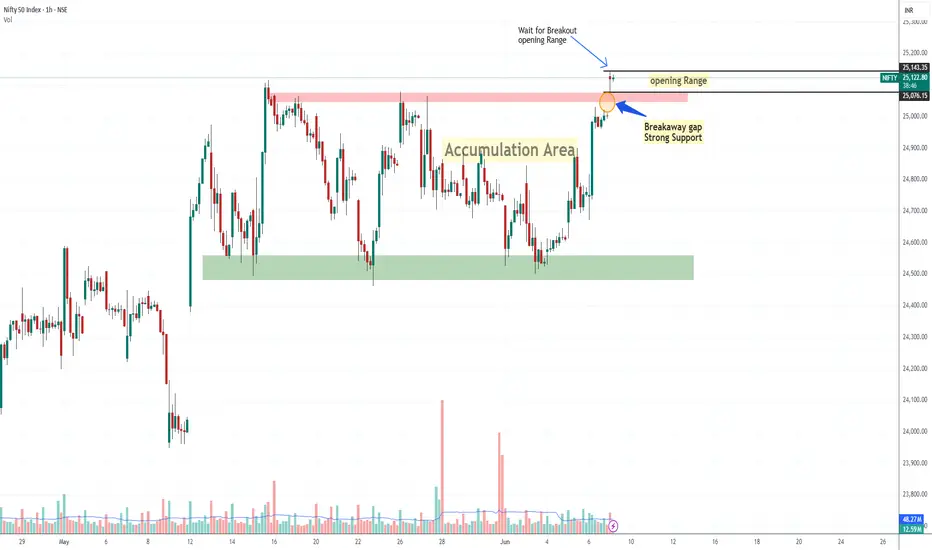
Nifty Gave Breakaway Gap Strong Bullish SignalWhat is Breakaway GAP?
A breakaway gap refers to the situation in the market where there is a strong price movement that crosses support or resistance. Breakaway gaps are formed after substantial periods of consolidation of prices in the market. It signifies a break from the previous trading range or pattern, and it suggests that a new trend or direction is emerging.
Nifty was trading in a range for 5 days and today 6/09/2025 it gap up and sustained above 25000 crucial level, the importance of break-away gap is that it's very strong sign of bullishness in market this also strong support too so if nifty come to retrace it would become support around 25000 level,
if nifty break today opening rang then it's very likely that it will go further so there are possibly Two entry Sign for Long: - first, OR breakout, second: -retracement on 15 Min chart near 20 Ema -50 Ema. Thats My opinion
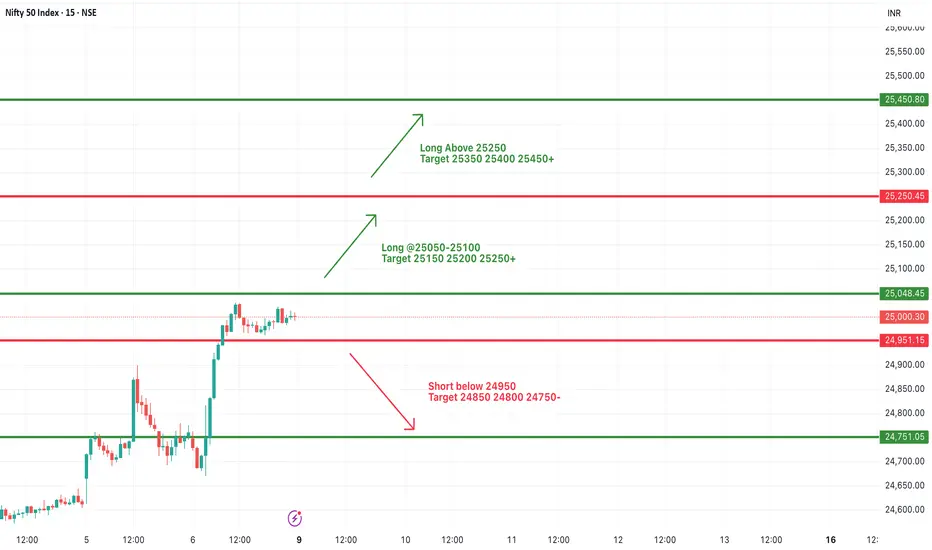
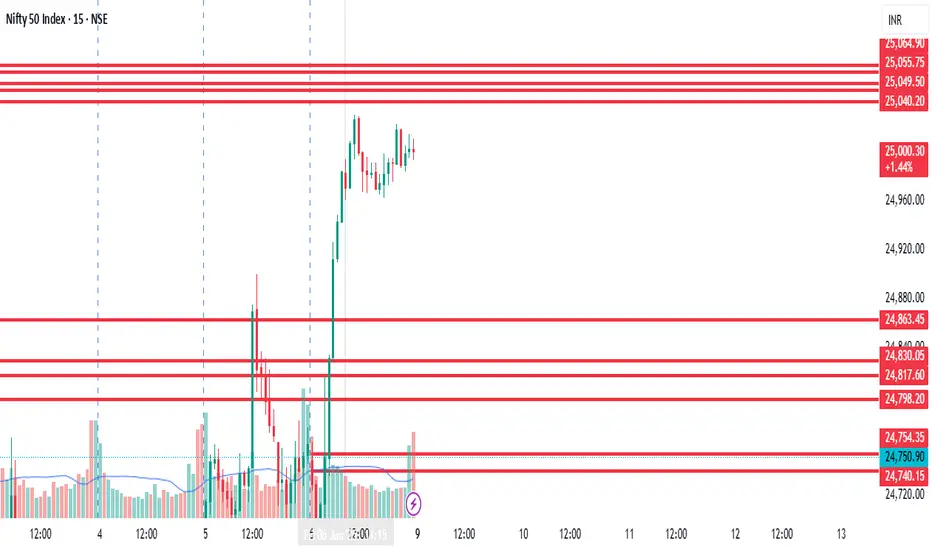
#NIFTY Intraday Support and Resistance Levels - 09/06/2025Nifty is opening with a gap-up above the 25050 level, continuing the recent bullish momentum. The index has broken out of its previous range and is now hovering near a key breakout zone.
If Nifty sustains above 25050–25100, we could see further upside toward 25150, 25200, and 25250+. A clean breakout above 25250 may unlock extended targets at 25350, 25400, and 25450+.
However, if the index fails to hold above 25000 and slips back below 24950, it could lead to a short-term pullback. In that case, expect downside toward 24850, 24800, and 24750.
Stocks & ETF : Breaking out and Ready for Massive Bull runBelow is the list of stocks and ETFs that are in the early stage of breakout with ultra volume level. Good time to buy.
NSE:SCHNEIDER
NSE:ASAHIINDIA
NSE:HINDZINC
NSE:ABREL
NSE:TATAINVEST
NSE:UJJIVANSFB
NSE:PNBHOUSING
NSE:BANDHANBNK
NSE:DLF
NSE:ICICIGI
NSE:IDFCFIRSTB
NSE:SHRIRAMFIN
NSE:AUTOBEES
NSE:INDUSINDBK
NSE:ABB
NSE:TATACHEM
NSE:GODREJPROP
NSE:SIGNATURE
NSE:JPPOWER
NSE:HFCL
9 june Nifty50 brekout and Breakdown leval
🔵 Call (CE) Buy Levels:
24,768 – Above 10m hold CE by Risky Zone
25,122 –Above 10m hold CE Zone
25,290 – Above 10m hold CE by Zone
25,490 – Above 10m closing, short covering possible
🔴 Put (PE) Buy Levels:
25,290 – Below 10m PE by Risky Zone
25,490 – Below 10m PE by Safe Zone
24,768 – Below 10m hold PE by Zone
🟢 Other Key Zones:
24,530 – CE by Safe Zone
➤ Below this: Unwinding Possible
25,122 – Above: Positive Trade View
➤ Below: Negative Trade View

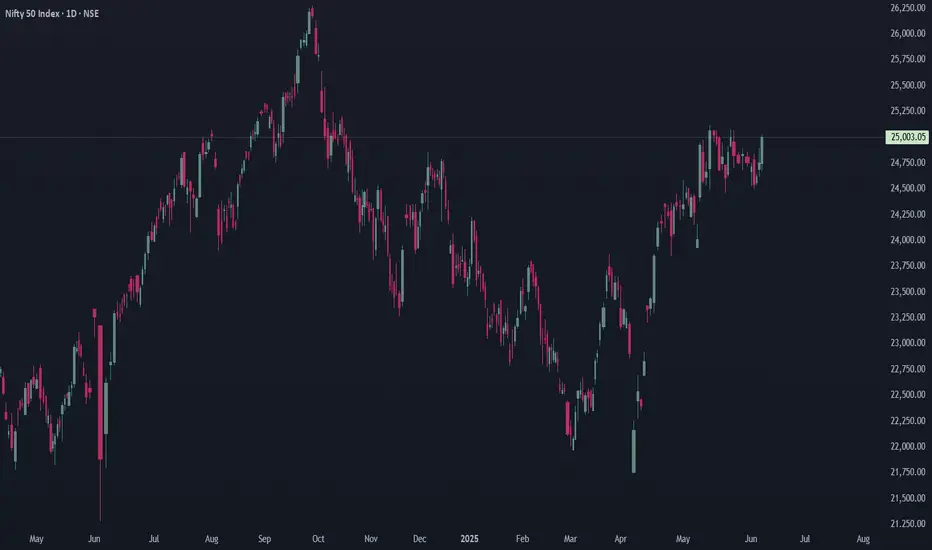
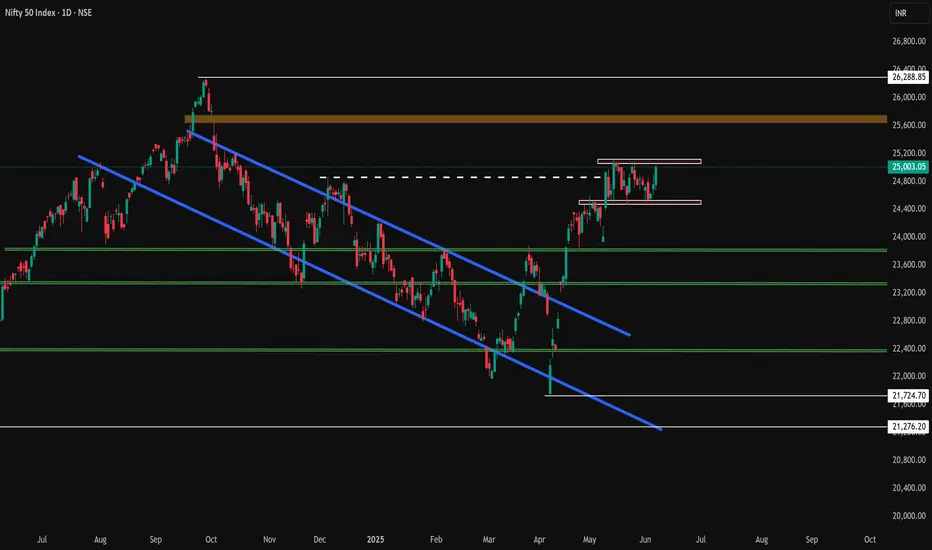
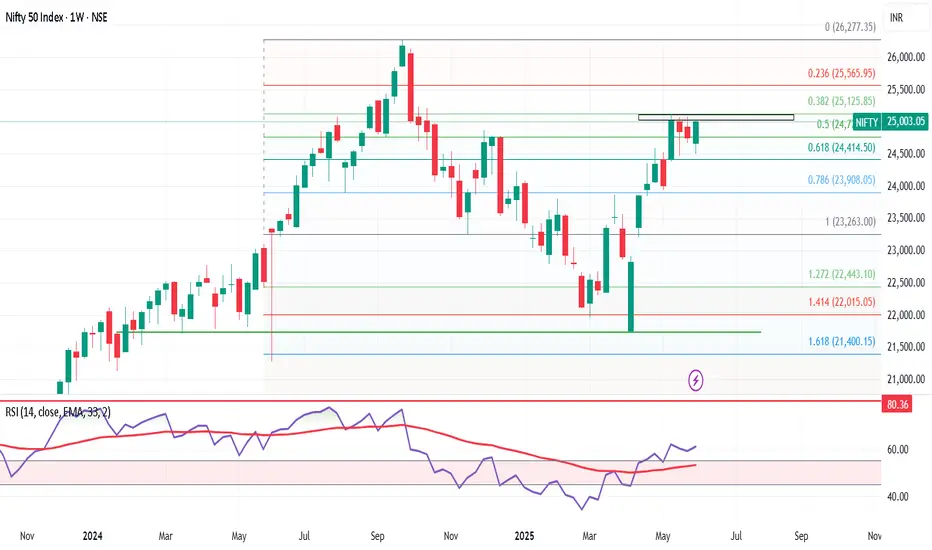
NIFTY 50 Long term Analysis I had a VIew in September 2024 that NIfty Should Fall from Its Life time HIgh to the levels of 22000 which is a strong Support and Monthly EMI 20 in Sept 2024 was nearing 22000 levels.
Now as nifty has taken support from 22000 and have relied till 25000 now. in HTF it is sideways. Important levels above is 25250 and then 26000 (LTH) and on lower side 24000 & 22000.
US after trump is very volatile and now after trump and elon musk issue and off course trade war with mostly china may drive the US market down as it is already overvalued and effects could be seen here in India market
Market Cap to GDP ratio of US (190%) & India (125%) is very High Still.
Nifty 50 analysis :
If Nifty from here if breaks 25250 level and sustain there it will face resistance @ 26000 (LTF) and if it is able to break it and sustain over it. It should zoom to 30000 levels in next 10-12 months
if nifty is not able to hold 25250 and gets rejection from here it should get it support @ 24000 but if it is not able to hold on to it. The Next Level will be 22000 again which is a very strong support but it is been tested already twice.
I have view here that Economic Conditions, US Market, Wars & Other Factors if not favourble at that time Nifty can Test 19500 Levels and curruntly 3 Month EMA 20 also is Calling the market to hand shake once @ 19500 Very Strong 3 Months Demand Zone.
This should also take 10-12 months from here.
Lets see where nifty 50 takes us 30000 or 19500.
;)

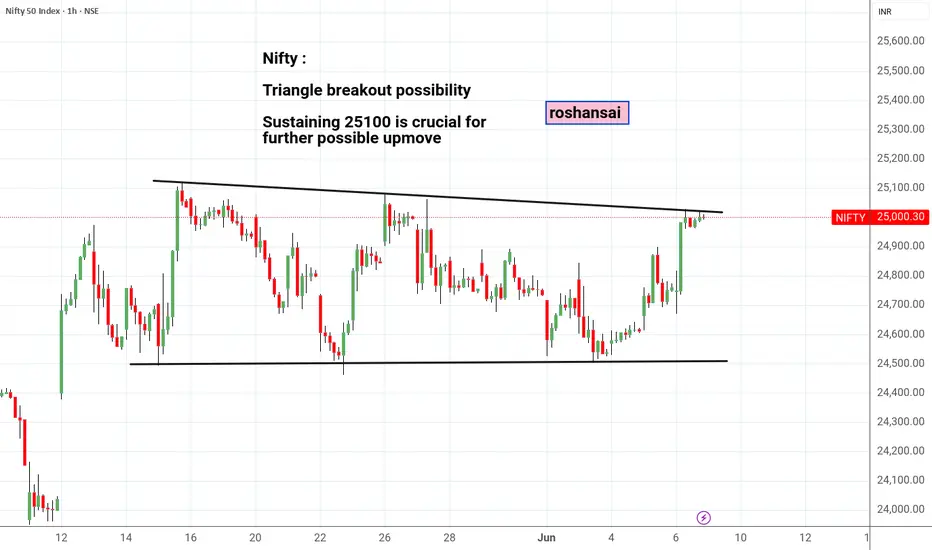
NIFTY - Triangle Breakout viewNifty :
Triangle breakout possibility
Sustaining 25100 is crucial for further possible upmove
Nifty uptrend doubtI m not bullish for nifty after Friday RBI rate cuts until it crosses above 25300 level, if it takes resistance at 25255 level on Monday or Tuesday then there is high chances that this up move from 7 April and this breakout after a month long range bound nifty is nothing more than a trap of bulls. And market may break this 22000 level in upcoming 2-3 months.
NIFTY50....Wave c of iv ended?!Hello Traders,
waves ((ii)) (magenta) probably ended @24502! There is a possibility given, that this pattern could morph into a "triangle shape". However, this would be the pattern with the most unlikely chance to be established!
Therefore, we focus on a potential a-b-c wave (iv) in green that is complete, and the next move will be to the upside.
Chart analysis!
It needs to make a new high above the waves "b" high @25079 and, at least, a new high above the waves "v" of (iii) 25116 to create a breakout signal! A possible target would be around the 25528 range.
A break to the downside below waves "c" low @ 25502 would not eliminate the triangle pattern, but chances would weaken to be one!
Anyway!
Once a trend is established, the chance of continuing is higher as to break down! So, I favor the idea of an extending wave of advance in the coming 1–2 weeks. If this happens, a new ATH will be reached! Not within the same time period but; I guess in the coming 4–6 weeks!
That's it for today.
Have a great Sunday and a great week....
Ruebennase
Please ask or comment as appropriate.
Trade on this analysis at your own risk.

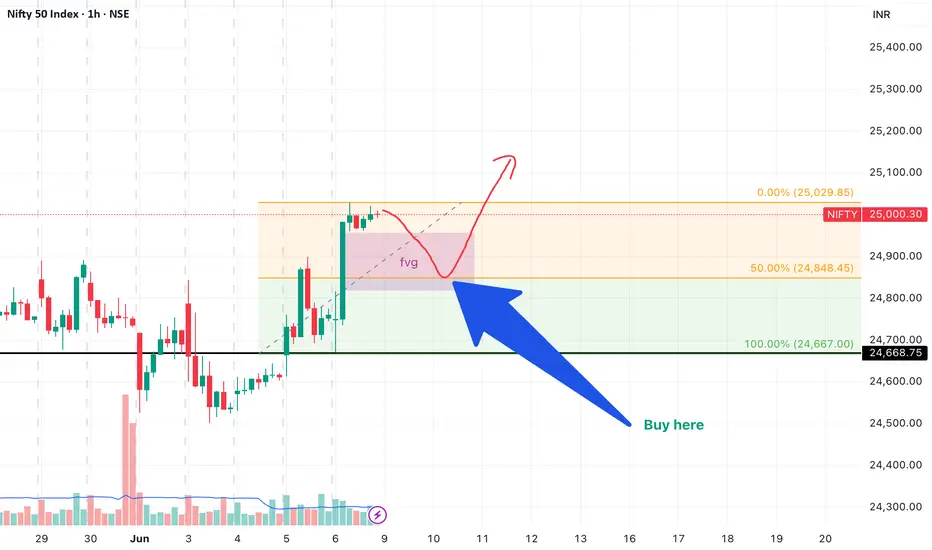
ICT SMC nifty for mondayThis analysis is based on the Smart Money Concepts (SMC) introduced by ICT (Inner Circle Trader), focusing on Fair Value Gaps (FVGs) as a core element of price inefficiencies left behind by institutional order flow. The idea aims to identify potential price action setups on the Nifty index for Monday, using these concepts to anticipate high-probability areas of interest for either continuation or reversal.
Fair Value Gaps represent imbalances where price moves rapidly, leaving little to no trading in between, which often creates zones that institutions may revisit for mitigation or re-entry. This analysis highlights such zones on the higher and lower timeframes, aligning them with potential liquidity pools, order blocks, and displacement moves.
The market structure, breaker blocks, and liquidity sweeps are also taken into account to frame a precise bias—bullish or bearish—for the upcoming trading session. Key levels have been marked to help traders watch for reaction zones, and any confluences with daily or 4H imbalances are noted for added conviction.
This setup is intended for educational purposes, helping traders understand how smart money operates and how to incorporate institutional-style trading frameworks into their own strategies.
Nifty June 2nd Week Analysis Nifty is looking positive for the upcoming week, and we can expect upside momentum to continue up to 25500 in the upcoming week. Right now, downside risk is looking limited up to 24650, which we can expect only if Nifty daily closes below 24900.

Nifty all set to travel towards ATH & aboveNifty (TF : 1D)
With Positive bias & built, nifty is seems all set to travel towards ATH & above.
- Minor Hurdle at 25200-25325 above this next aim should be 26000 & above 📷
- Interim Support @ 24470 -24360 which need to protect on daily basis from the buyers.

Market Outlook – Nifty Near Critical Levels! Caution Advised
Nifty Weekly Wrap-Up:
The Nifty 50 index closed the week at 25,003, posting a solid gain of +250 points from last week's close. It touched a high of 25,029 and a low of 24,502 during the week.
But here’s the twist—while the uptrend looks strong, we’re now at a crucial inflection point on the weekly chart.
Technical Outlook – Is a Bearish “M” Pattern Forming?
On the weekly timeframe, Nifty is at a level where a bearish M-pattern could potentially develop. To complete this pattern, the index could pull back towards support levels at:
24,414
24,200
24,000
If the selling deepens, the final support zone lies between 23,900–23,700, where a bounce-back is likely.
Bullish Scenario – Can Nifty Break Out?
If Nifty holds above 25,000 for at least 2 consecutive sessions, it could trigger a short-covering rally, paving the way for a move toward key resistance zones at:
25,400
25,565
26,100
Next Week’s Expected Range: 24,500 – 25,500
This range should see most of the action next week. If you're holding long positions, now is a great time to:
✔️ Lock in profits
✔️ Trail stop-losses
✔️ Prepare cash reserves for potential dip-buying opportunities
Global Watch – S&P 500 Hits Key Resistance
The S&P 500 closed near 6,000, up 100 points for the week. But heads up—it’s now testing a strong Fibonacci resistance at 6,013.
A rejection here could lead to a correction toward 5,900–5,850, a dip of 1.5–2.5%. If this unfolds alongside a Nifty pullback, it would align perfectly with our support targets around 24,400–24,500.
Final Takeaway:
Markets are looking stretched. While momentum remains positive, profit booking at higher levels is essential. Don’t get caught unprepared in case of a reversal. Stay tactical, stay liquid.
Smart money is already locking in gains. Are you?

$NIFTY: New highs incoming; 27500 can be cycle highsNSE:NIFTY the index from India which holds the top 50 stocks in India. IN the chart below we have overlayed the SP:SPX index. The NSE:NIFTY and $S&P500 have been in lockstep for more than 5 years as shown in the chart below. The indices are just 2.5% away from their ATH. Even with these levels the RSI for NSE:NIFTY is 61 and 58 in case of $SPX.
The RSI is far from overbought condition. So, this rally which started in NSE:NIFTY can have more legs. With Global liquidity on the rise and RBI easing policy rates the NSE:NIFTY can reach its all-previous highs of the Fib retracement levels. The previous peak was 0.786 Fib retracement level which on this upward sloping chart can be as high as 27500 which can indicate another 10% upside.
Verdict : Stay long $NIFTY. More upside possible. RSI still not overbought.
