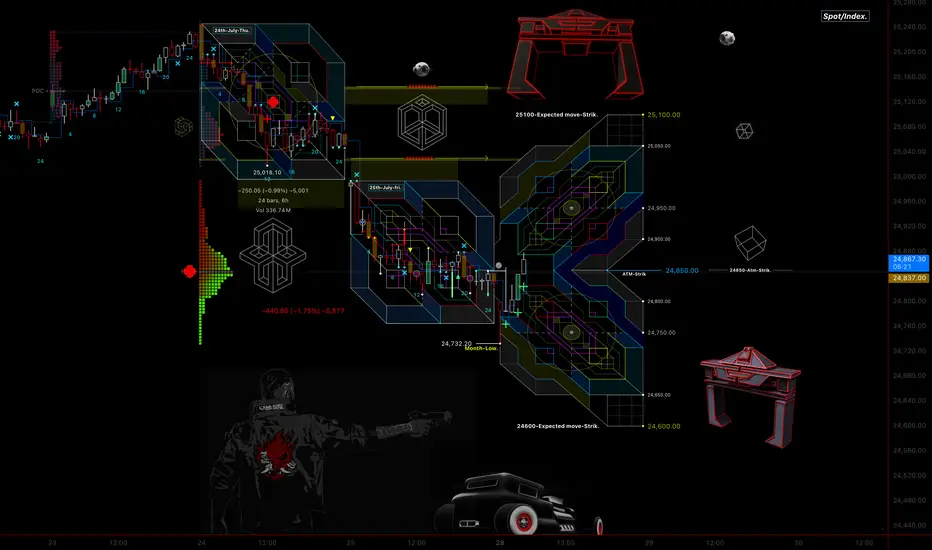
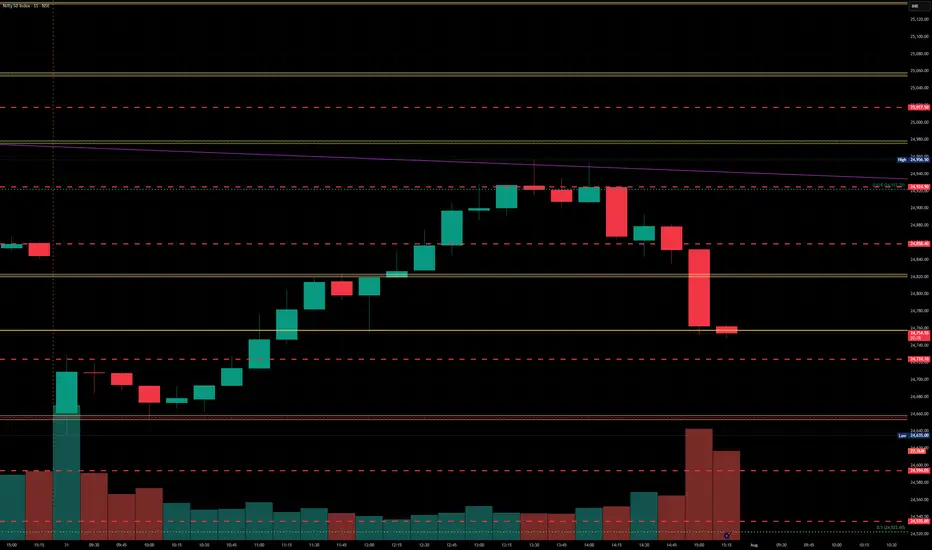
Nifty50 Index Monthly expiry week Grid projection.(July 2025)Hello everyone !!
Welcome to Nifty50 Index Grid projection for last week of July (Monthly expiry week)
this Grid is based on the Expected move reverse engineered from option pricing for the week
our market has been breaking the lows
today its been the lowest in the whole month
so expecting this to be not only the day's low but also the Month's low
Thank you
Grid-_-Work's.
safety first
NIFTY trade ideas
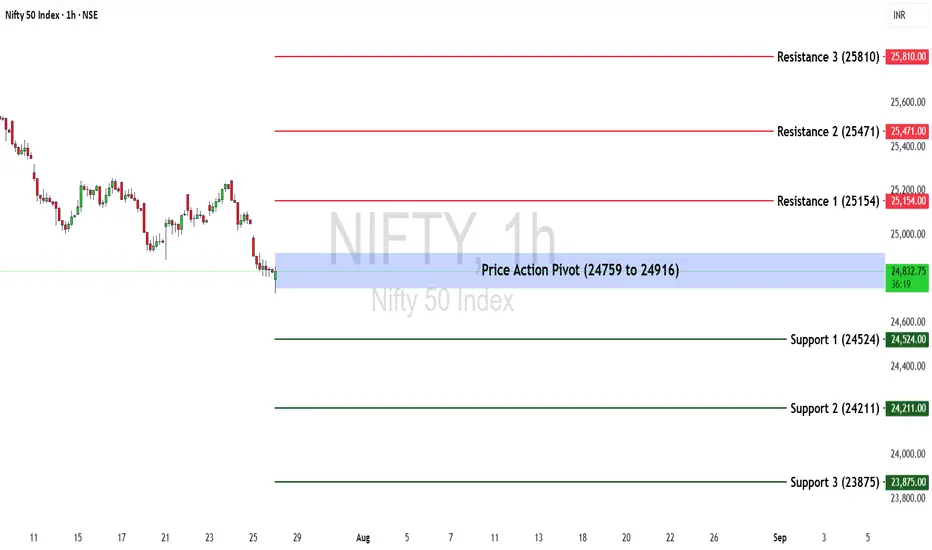
Nifty 50 at a Turning Point? Key Levels & Market Outlook AheadThe Nifty 50 ended the week at 24,837.00, registering a decline of -0.53%.
🔹 Key Levels for the Upcoming Week
📌 Price Action Pivot Zone:
24,759 to 24,916 – This range is crucial for identifying potential trend continuation or reversal. A move outside this zone could set the directional tone for the coming sessions.
🔻 Support Levels:
Support 1 (S1): 24,524
Support 2 (S2): 24,211
Support 3 (S3): 23,875
🔺 Resistance Levels:
Resistance 1 (R1): 25,154
Resistance 2 (R2): 25,471
Resistance 3 (R3): 25,810
📈 Market Outlook
✅ Bullish Scenario:
A sustained move above 24,916 (top of the pivot zone) may attract buying interest. If this momentum builds, the index could test R1 (25,154), and potentially advance towards R2 (25,471) and R3 (25,810).
❌ Bearish Scenario:
Failure to hold above 24,759 (bottom of the pivot zone) may lead to further downside pressure. In such a case, Nifty may move towards S1 (24,524), and deeper support levels like S2 (24,211) and S3 (23,875)
Disclaimer: lnkd.in
Nifty levels - Jul 29, 2025Nifty support and resistance levels are valuable tools for making informed trading decisions, specifically when combined with the analysis of 5-minute timeframe candlesticks and VWAP. By closely monitoring these levels and observing the price movements within this timeframe, traders can enhance the accuracy of their entry and exit points. It is important to bear in mind that support and resistance levels are not fixed, and they can change over time as market conditions evolve.
The dashed lines on the chart indicate the reaction levels, serving as additional points of significance to consider. Furthermore, take note of the response at the levels of the High, Low, and Close values from the day prior.
We hope you find this information beneficial in your trading endeavors.
* If you found the idea appealing, kindly tap the Boost icon located below the chart. We encourage you to share your thoughts and comments regarding it.
Wishing you success in your trading activities!

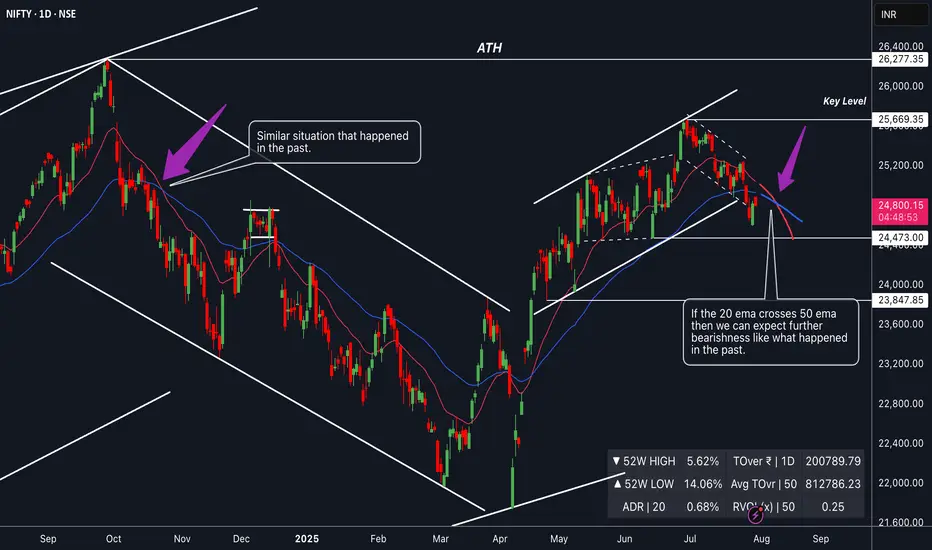
Nifty : Bearish EMA Crossover Loading… Watch Out...The 20 EMA is inching dangerously close to crossing below the 50 EMA on the daily chart — a key technical zone that often signals the start of a short-term downtrend.
📉 What this setup could mean:
Momentum is fading, and bulls are losing grip.
A confirmed crossover may invite fresh selling pressure.
Price structure already showing signs of weakness.
🔍 What to watch:
A clear 20 EMA < 50 EMA crossover with a bearish candle close.
Increased volume on red days could validate the move.
Retest of key support zones if crossover plays out.
⚠️ This is a high-probability setup, but not a confirmation yet. Keep alerts set — the next few candles could decide the trend!
📢📢📢
If my perspective changes or if I gather additional fundamental data that influences my views, I will provide updates accordingly.
Thank you for following along with this journey, and I remain committed to sharing insights and updates as my trading strategy evolves. As always, please feel free to reach out with any questions or comments.
Other posts related to this particular position and scrip, if any, will be attached underneath. Do check those out too.
Disclaimer : The analysis shared here is for informational purposes only and should not be considered as financial advice. Trading in all markets carries inherent risks, and past performance is not indicative of future results. It’s essential to conduct your own research and assess your risk tolerance before making any investment decisions. The views expressed in this analysis are solely mine. It’s important to note that I am not a SEBI registered analyst, so the analysis provided does not constitute formal investment advice under SEBI regulations.
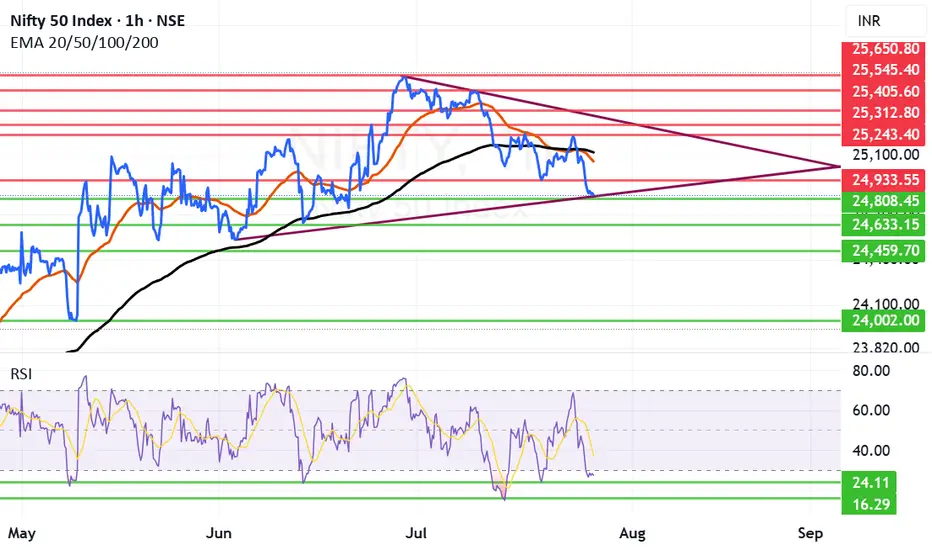
Nifty Next Week: Can Nifty make a comeback after drubbing?Nifty received proper drubbing after falling below critical supports of Mother and Father line. Trump's warning signals for IT companies and the continuing deadlock in Trade deal with US weighing on Indian markets. Additionally the earning season also giving many disappointing and few good result has broken the back of the Bull rally and now Nifty is reeling under 25K levels.
Only silver line in the cloud seems to be that RSI is below 30. Currently RSI is at 27.52. Usually RSI has found support near 24 if not 24 it might bounce back from 16. So hopefully we can see some short covering in the beginning or middle of next week. Also next week the decision for Tariffs should come. If the result will be in favour of India we might see a strong come back as lot of sectors / Large cap stocks currently are looking oversold.
The Supports for Nifty Remain at: 24808 (Strong support), 24633, 24459 Below 24459 the index will be in firm grip of Bears who might try to drag Nifty towards 24K levels or even below that in unlikely circumstances.
The Resistances for Nifty Remain at: 24933, 25058 (Mother Line Resistance of Daily Chart), 25119 (Father Line Resistance) and 25243. After we get a closing above 25243 the Bulls can gain some momentum.
Disclaimer: The above information is provided for educational purpose, analysis and paper trading only. Please don't treat this as a buy or sell recommendation for the stock or index. The Techno-Funda analysis is based on data that is more than 3 months old. Supports and Resistances are determined by historic past peaks and Valley in the chart. Many other indicators and patterns like EMA, RSI, MACD, Volumes, Fibonacci, parallel channel etc. use historic data which is 3 months or older cyclical points. There is no guarantee they will work in future as markets are highly volatile and swings in prices are also due to macro and micro factors based on actions taken by the company as well as region and global events. Equity investment is subject to risks. I or my clients or family members might have positions in the stocks that we mention in our educational posts. We will not be responsible for any Profit or loss that may occur due to any financial decision taken based on any data provided in this message. Do consult your investment advisor before taking any financial decisions. Stop losses should be an important part of any investment in equity.
Nifty levels - Jul 31, 2025Nifty support and resistance levels are valuable tools for making informed trading decisions, specifically when combined with the analysis of 5-minute timeframe candlesticks and VWAP. By closely monitoring these levels and observing the price movements within this timeframe, traders can enhance the accuracy of their entry and exit points. It is important to bear in mind that support and resistance levels are not fixed, and they can change over time as market conditions evolve.
The dashed lines on the chart indicate the reaction levels, serving as additional points of significance to consider. Furthermore, take note of the response at the levels of the High, Low, and Close values from the day prior.
We hope you find this information beneficial in your trading endeavors.
* If you found the idea appealing, kindly tap the Boost icon located below the chart. We encourage you to share your thoughts and comments regarding it.
Wishing you success in your trading activities!

Nifty levels - Aug 01, 2025Nifty support and resistance levels are valuable tools for making informed trading decisions, specifically when combined with the analysis of 5-minute timeframe candlesticks and VWAP. By closely monitoring these levels and observing the price movements within this timeframe, traders can enhance the accuracy of their entry and exit points. It is important to bear in mind that support and resistance levels are not fixed, and they can change over time as market conditions evolve.
The dashed lines on the chart indicate the reaction levels, serving as additional points of significance to consider. Furthermore, take note of the response at the levels of the High, Low, and Close values from the day prior.
We hope you find this information beneficial in your trading endeavors.
* If you found the idea appealing, kindly tap the Boost icon located below the chart. We encourage you to share your thoughts and comments regarding it.
Wishing you success in your trading activities!
Nifty Chart📉 Nifty Technical Outlook – Bearish Bias with Macro Overhang
Nifty continues to show bearish momentum, having taken strong resistance near the 25450–25800 zone, which aligns with the runaway gap on the daily chart and the 78.6% Fibonacci retracement level from the recent decline.
On the short-term chart, a Head and Shoulder breakdown has already occurred, followed by a retest, which supports the ongoing weak sentiment.
In addition to technical factors, India–US trade talks are currently in focus. Uncertainty around tariffs, tech cooperation, and strategic agreements may keep market participants cautious in the near term. Any negative development could add to downside pressure, while a breakthrough might limit losses.
🔻 Key Technical Levels:
Major Resistance: 25450–25800 (Runaway Gap + Fibo 78.6%)
Immediate Support: 24200 (short-term support zone)
Next Support: 23700 (historical support level)
As long as Nifty stays below 25450, the trend remains bearish, with potential downside toward 24150–24200 and further to 23700, depending on trade talk developments and market sentiment.
📝 Note: This analysis is intended only for study and educational purposes. Please consult a qualified advisor before making any investment decisions. Market behavior is subject to change based on news, global trends, and macroeconomic factors.

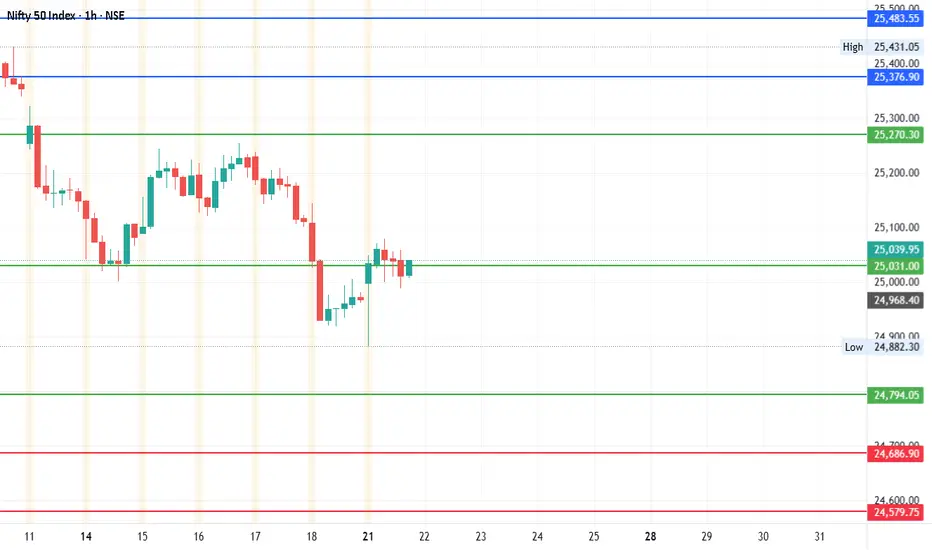
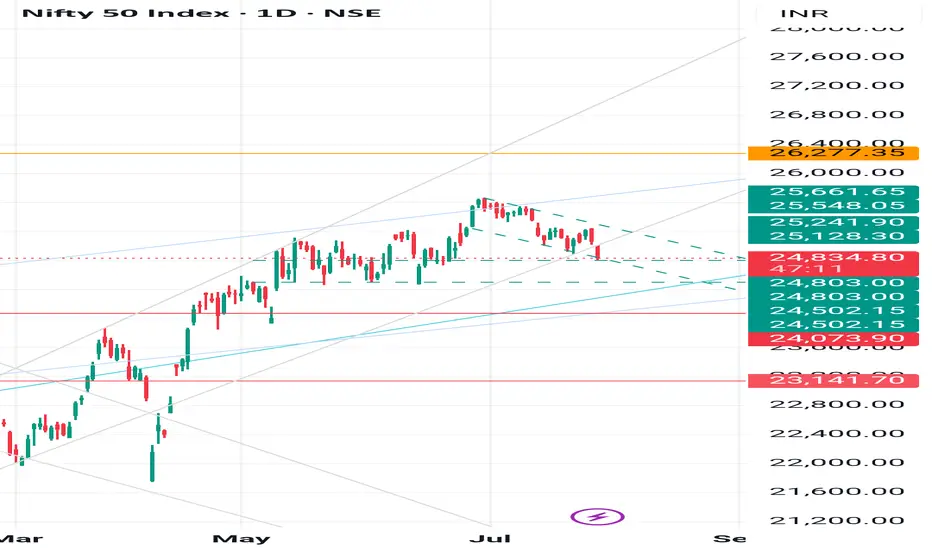
#Nifty - Pivot Point: 25031.63Date: 18-07-2025
#Nifty Current Price: 25025
Pivot Point: 25031.63 Support: 24794.06 Resistance: 25270.32
#NiftyUpside Targets:
Target 1: 25376.92
Target 2: 25483.53
Target 3: 25652.99
Target 4: 25822.45
#NiftyDownside Targets:
Target 1: 24686.89
Target 2: 24579.73
Target 3: 24410.26
Target 4: 24240.80
#TradingView #Stocks #Equities #StockMarket #Investing #Trading #Nifty
#TechnicalAnalysis #StockCharts #Finance
Basics of Options: Calls and PutsWhat are Options?
An option is a financial contract that gives the buyer the right, but not the obligation, to buy or sell an underlying asset (like a stock or index) at a specific price, on or before a specific date.
Think of it like booking a movie ticket. You reserve the right to watch a movie at a particular time and seat. But if you don’t go, it’s your choice. You lose the ticket price (premium), but you're not forced to go. Options work similarly.
Options are of two basic types:
Call Option
Put Option
Let’s break both down in detail.
1. What is a Call Option?
A Call Option gives the buyer the right (but not the obligation) to buy the underlying asset at a pre-decided price (called the strike price) on or before a certain date (called the expiry date).
When do traders buy a Call Option?
When they believe the price of the underlying stock or index will go up in the future.
Example of Call Option (Simple Case)
Let’s say you are bullish on Reliance Industries stock, which is currently trading at ₹2,500.
You buy a Call Option with:
Strike Price: ₹2,550
Premium Paid: ₹30 per share
Lot Size: 250 shares
Expiry: Monthly expiry (say end of the month)
You believe Reliance will go up beyond ₹2,550 soon. If it goes to ₹2,600 before expiry:
Your profit per share = ₹2,600 (market price) - ₹2,550 (strike price) = ₹50
Net Profit = ₹50 - ₹30 (premium) = ₹20 per share
Total Profit = ₹20 x 250 = ₹5,000
But if Reliance stays below ₹2,550, say at ₹2,500 on expiry, you won’t exercise the option. You lose only the premium (₹30 x 250 = ₹7,500).
Key Terminologies in Call Options
In the Money (ITM): When the stock price is above the strike price.
At the Money (ATM): When the stock price is equal to the strike price.
Out of the Money (OTM): When the stock price is below the strike price.
2. What is a Put Option?
A Put Option gives the buyer the right (but not the obligation) to sell the underlying asset at a pre-decided price (strike price) on or before the expiry.
When do traders buy a Put Option?
When they believe the price of the underlying stock or index will fall in the future.
Example of Put Option (Simple Case)
Assume HDFC Bank is trading at ₹1,600. You are bearish and expect it to fall.
You buy a Put Option with:
Strike Price: ₹1,580
Premium: ₹20 per share
Lot Size: 500 shares
Expiry: Monthly
If HDFC Bank falls to ₹1,520:
You can sell at ₹1,580 even though market price is ₹1,520
Gross profit per share = ₹60
Net profit = ₹60 - ₹20 = ₹40 per share
Total profit = ₹40 x 500 = ₹20,000
If HDFC stays above ₹1,580, your put expires worthless. You lose only the premium (₹10,000).
Key Terminologies in Put Options
In the Money (ITM): Stock price below strike price.
At the Money (ATM): Stock price = strike price.
Out of the Money (OTM): Stock price above strike price.
Who are the Two Parties in an Option Contract?
1. Option Buyer (Holder)
Pays the premium
Has rights, but not obligations
Can exercise the option if profitable
Loss is limited to the premium paid
2. Option Seller (Writer)
Receives the premium
Has obligation to fulfill the contract if the buyer exercises
Risk is unlimited for call writers and limited for put writers (if stock price becomes zero)
Profit is limited to the premium received
Difference between Call and Put Options (Summary Table)
Feature Call Option Put Option
Buyer’s Expectation Bullish (price will go up) Bearish (price will go down)
Right Buy at strike price Sell at strike price
Profit Potential Unlimited Limited (until price reaches zero)
Risk (for buyer) Limited to premium Limited to premium
Seller’s Role Sells call & hopes price won’t rise Sells put & hopes price won’t fall
Premium and What Influences It?
The premium is the price you pay to buy an option. This is influenced by:
Intrinsic Value: Difference between market price and strike price
Time Value: More days to expiry = higher premium
Volatility: Higher the volatility = higher the premium
Interest Rates and Dividends
What is Strike Price and Expiry?
Strike Price: The price at which you can buy (call) or sell (put) the underlying stock
Expiry: The last date till which the option is valid. In India:
Weekly expiry for Nifty, Bank Nifty, and FINNIFTY
Monthly expiry for stocks
Nifty 50 analysis I have done my nifty analysis as we enter august month expiry. July has been a volatile month with 5 week and corporate results.

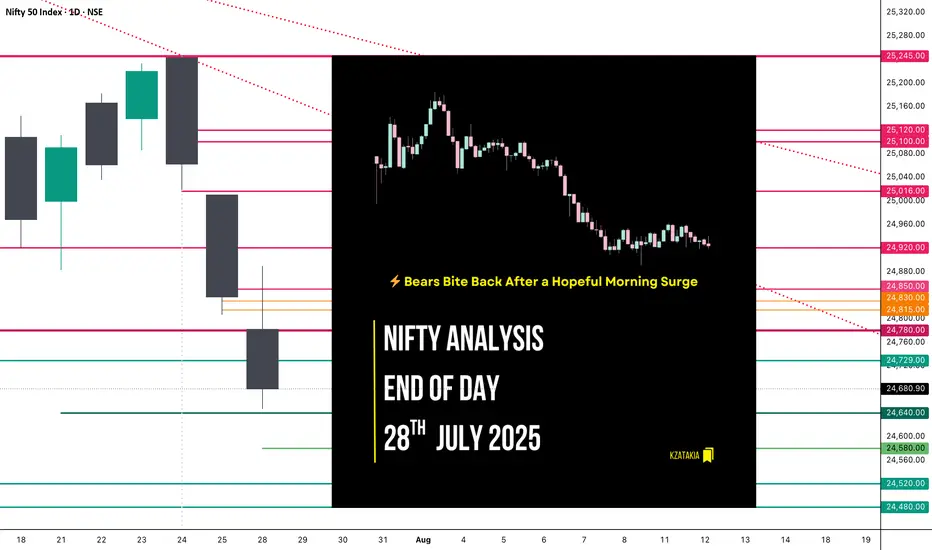
Nifty Analysis EOD – July 28, 2025 – Monday 🟢 Nifty Analysis EOD – July 28, 2025 – Monday 🔴
⚡️ Bears Bite Back After a Hopeful Morning Surge
📊 Nifty Summary
Nifty opened with a minor gap-down of 32 points and slipped an additional 67 points in the first 3 minutes, testing the critical support zone of 24,755 ~ 24,729. After marking a day low at 24,732.70, it witnessed a sharp recovery breaching key levels — CDO, Gap, PDC — and touched the CPR BC level. Rejection from there caused a retracement to the mean, followed by another successful attempt breaching CPR BC and IB High. However, it couldn’t sustain above, as profit booking and pressure from a higher time frame bearish trendline dragged the index below the CPR zone and even past the PDL.
Support at 24,780 offered brief relief, but a bearish triangle formed between the HTF trendline and that support and The breakdown at 12:40 led to a clean move, with the pattern target achieved.
🕯 5 Min Time Frame Chart with Intraday Levels
🔁 Trend & Zone Update
📍 Resistance Zone Shifted To: 25,100 ~ 25,120
📍 Support Zone Shifted To: 24,520 ~ 24,480
🧭 What If Plans – 29th July Outlook
🅰️ Plan A (Contra Long Setup)
If market opens inside the previous day range and finds support at 24,700 ~ 24,729,
→ Potential targets: 24,780, 24,815, 24,840
🅱️ Plan B (Trend is Friend – Short Continuation)
If market opens inside range and faces resistance around 24,830 ~ 24,815,
→ Aim for: 24,780, 24,720, 24,640, 24,580
🔄 On-the-Go Plan
If market Gaps Up/Down outside previous day’s range,
→ Wait for IB formation and act based on structure & S/R levels.
🕯 Daily Time Frame Chart with Intraday Levels
🕯 Daily Candle Breakdown
Open: 24,782.45
High: 24,889.20
Low: 24,646.60
Close: 24,680.90
Change: −156.10 (−0.63%)
🕯 Candle Structure Breakdown:
Real Body: 101.55 pts (Red candle, bearish)
Upper Wick: 106.75 pts (Long — rejection from highs)
Lower Wick: 34.30 pts (Defended slightly)
🕯 Interpretation:
Tried to rally above 24,880 but faced aggressive selling. Closed well below open, forming a bearish rejection candle resembling a shooting star. Bears clearly took control after the intraday bounce attempt.
🕯 Key Insight:
Selling pressure visible from 24,880–24,900 zone.
Close below 24,700 keeps bearish tone intact.
Next Support: 24,650–24,620.
Bulls' challenge: Reclaim and close above 24,850.
🛡 5 Min Intraday Chart
⚔️ Gladiator Strategy Update
ATR: 197.91
IB Range: 122 → Medium
Market Structure: Imbalanced
Trades Triggered:
09:27 – Long Entry → 🎯 Target Hit (1:1.5 R:R)
12:40 – Short Entry → 🎯 Target Hit (1:2.5 R:R)
🧱 Support & Resistance Levels
Resistance Zones:
📍 24,729
📍 24,780
📍 24,815 ~ 24,830
📍 24,850
📍 24,920
Support Zones:
📍 24,640
📍 24,580
📍 24,520 ~ 24,480
💭 Final Thoughts
🧠 “Every breakout starts with hesitation — but not every hesitation leads to a breakout.”
Today’s structure showed strong indecision, but sellers used it to dominate.
Monday’s triangle breakdown proved that structure plus patience = power. Keep your bias flexible and trust your levels.
✏️ Disclaimer
This is just my personal viewpoint. Always consult your financial advisor before taking any action.
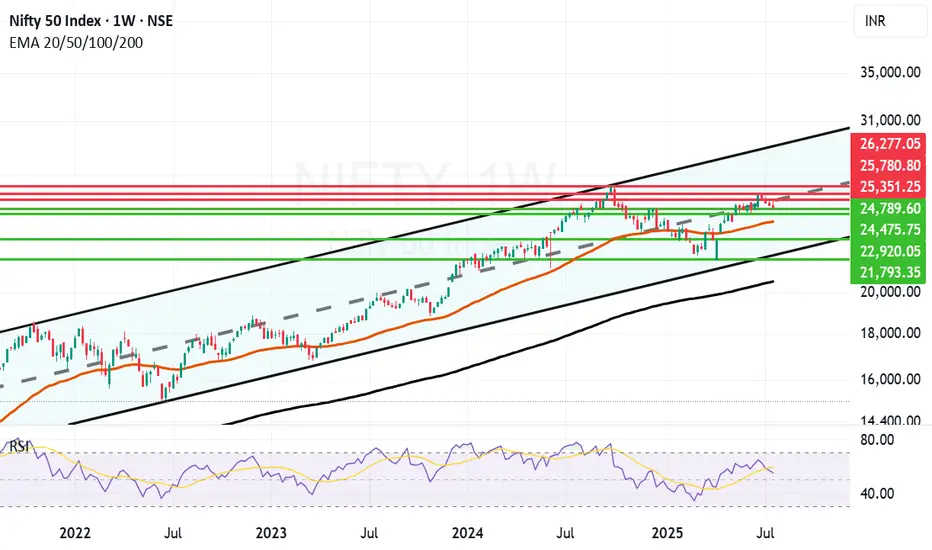
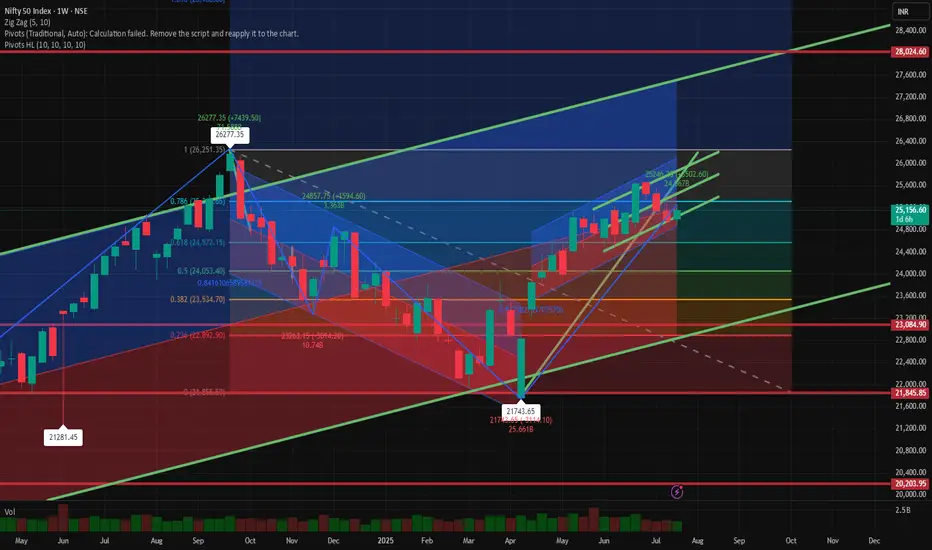
Long term Nifty Outlook Still upbeat. Long term outlook of Nifty is still upbeat. As you can see in the parallel channel in the weekly chart of Nifty. As you can see in the weekly chart Nifty attempted to break free above the Mid-Channel resistance went above it briefly but due to various geopolitical, Tariff and earning related concerns has not yet been successful. In a few years time the channel top can be around 30K and channel bottom seems to be around 21K. Supports for Nifty currently are near 24789, 24475, 23969 (Mother Line support of Weekly chart), 22920 and 21793 (Channel Bottom.) Below that 200 Weeks EMA ot the Father line is at 20577. Resistances for Nifty with long term perspective remain at 25351, 25780 and previous All time high of 26277. Once we get a weekly or monthly closing above 26277 the doors towards 27K+ will open.
Disclaimer: The above information is provided for educational purpose, analysis and paper trading only. Please don't treat this as a buy or sell recommendation for the stock or index. The Techno-Funda analysis is based on data that is more than 3 months old. Supports and Resistances are determined by historic past peaks and Valley in the chart. Many other indicators and patterns like EMA, RSI, MACD, Volumes, Fibonacci, parallel channel etc. use historic data which is 3 months or older cyclical points. There is no guarantee they will work in future as markets are highly volatile and swings in prices are also due to macro and micro factors based on actions taken by the company as well as region and global events. Equity investment is subject to risks. I or my clients or family members might have positions in the stocks that we mention in our educational posts. We will not be responsible for any Profit or loss that may occur due to any financial decision taken based on any data provided in this message. Do consult your investment advisor before taking any financial decisions. Stop losses should be an important part of any investment in equity.
posting full SSThis post serves only to share the complete SS, which was not inadvertently included in the earlier post shared today.

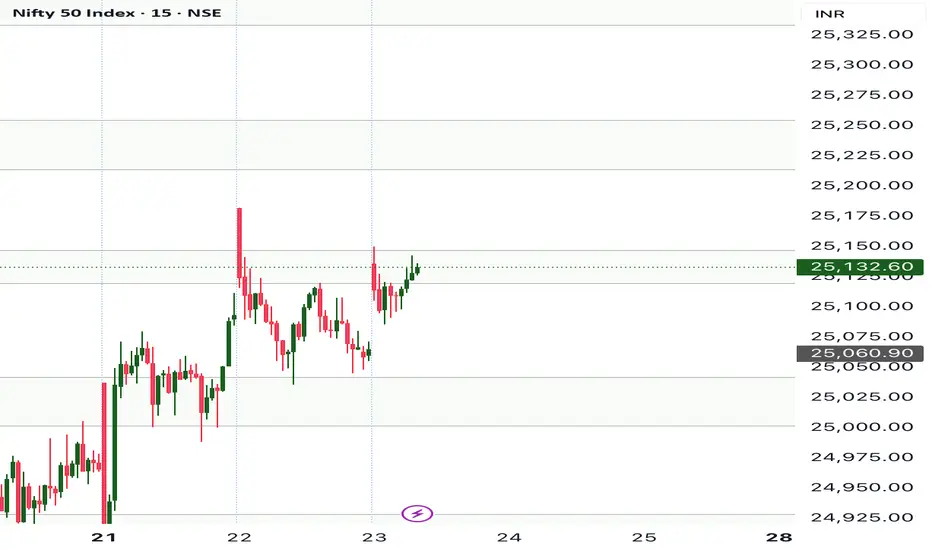
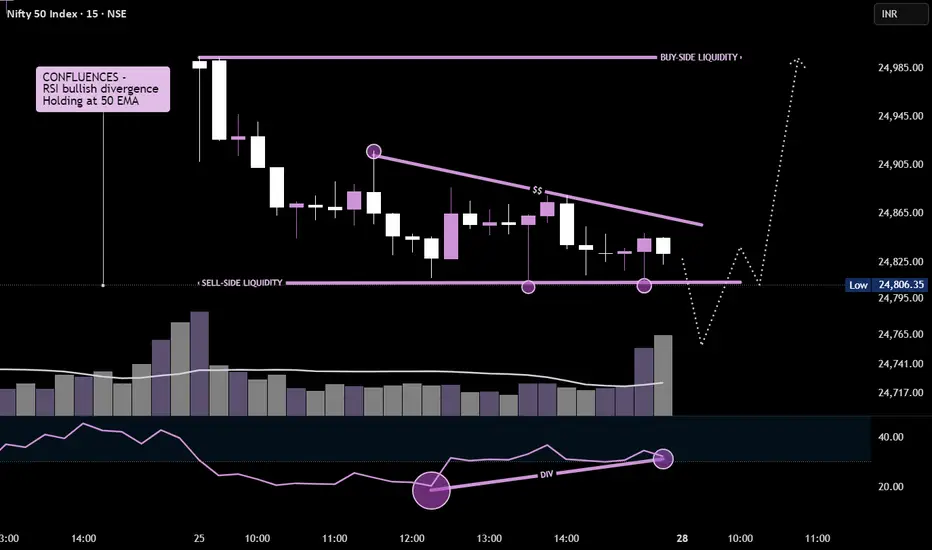
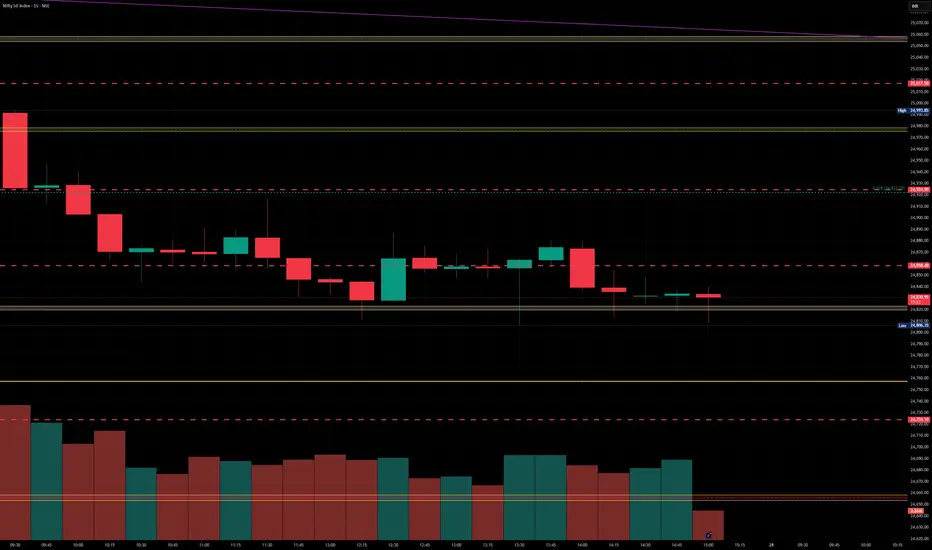
NIFTY50 - 15MIN Potential reversal brewingPrice is forming a falling wedge pattern with clear bullish RSI divergence, signaling potential reversal.
Reliance: 24837 - 1st target exact doneAs posted yesterday, 24836.65 this target is done today.
Now sideways move are expected for 1-2 sessions and 24545 is expected slowly.
Keep an eyes on this level.
As soon as this is done we can expect big upside moves with rapid action. 👍🚩
NIFTY50.....Where are the targets?Hello Traders,
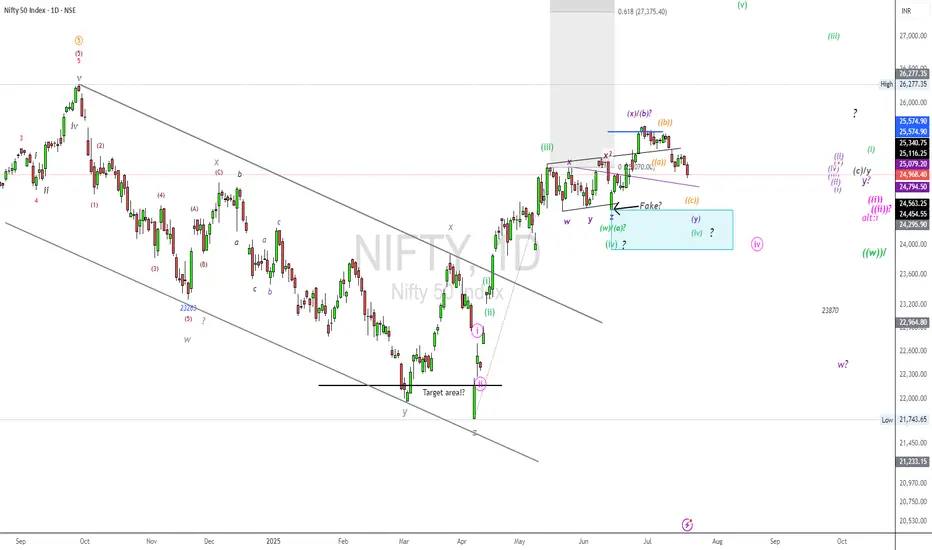
The NFTY50 failed to make new high's, but has achieved my long-term target @25577 points.
It also broke below the trend-line, connecting the high's of 25116 to 25222. This is a bearish sign!
I have labelled the chart as a w-x-y pattern, that could also morph into an a-b-c!
But what to expect for the coming sessions?
Chart analysis.
The weakness at chart is not done to my view!
In normal, a corrective move, here a possible wave ((iv)), pink, will return to a wave 4 of lower degree. So we should expect a target range at or around the 24000 points! If so to come, this would be potentially buy_area! A break to the upside is not in (my) the cards. Too much overlapping waves, buy and immediately sell-orders..... This is not how an impulse look like!
Of course; a wave iv correction can morph into a w-x-y pattern. And if so, the price would extend to an 2.618 Fibo after it was complete!
Again. The correction look like not complete, and it will be interesting how markets will answer on Monday.
So, that's it for today!
Have a great weekend.....
Ruebennnase
Please ask or comment as appropriate.
Trade on this analysis at your own risk.
Long term Goal on Nifty 50Nifty should break 25,300 to reach the next level.
The Fib Retracement shows 26,200 as the next resistend, if India has more positive news and supported by Corporate results. It should break it. But as of now today(24/7/2025), the corporate results are mixed, today is infosys result after market, which may be crucial to watch. There should be some reforms backed by Government support may change the market direction. The FII are selling for a while. Tech is at its peak with AI and Robotics. NASDAQ is its all time high, Bitcoin is sky-rocketing, when is the Nifty touches its next peek.
what do you think of it.?
share your comments.
Nifty levels - Jul 28, 2025Nifty support and resistance levels are valuable tools for making informed trading decisions, specifically when combined with the analysis of 5-minute timeframe candlesticks and VWAP. By closely monitoring these levels and observing the price movements within this timeframe, traders can enhance the accuracy of their entry and exit points. It is important to bear in mind that support and resistance levels are not fixed, and they can change over time as market conditions evolve.
The dashed lines on the chart indicate the reaction levels, serving as additional points of significance to consider. Furthermore, take note of the response at the levels of the High, Low, and Close values from the day prior.
We hope you find this information beneficial in your trading endeavors.
* If you found the idea appealing, kindly tap the Boost icon located below the chart. We encourage you to share your thoughts and comments regarding it.
Wishing you success in your trading activities!
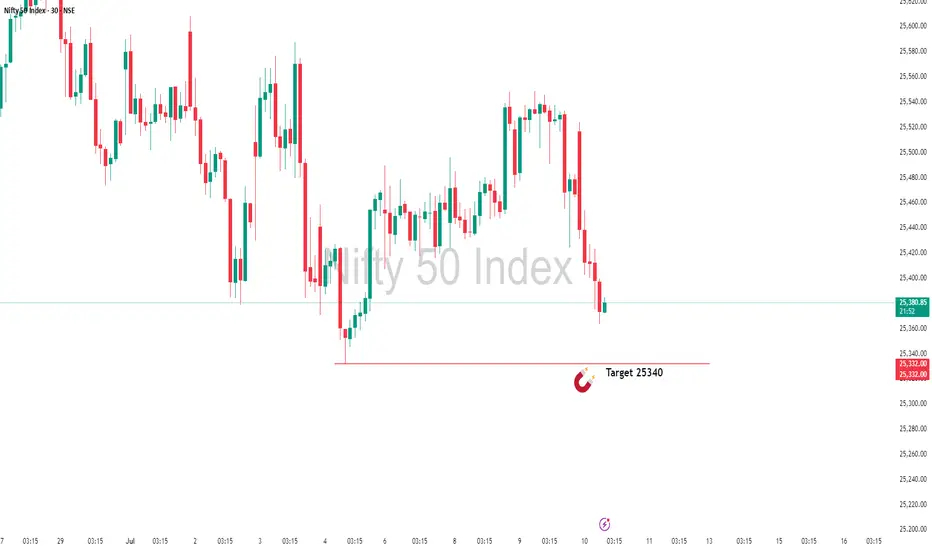
Almost There: Nifty Closing in on My Target Zone 25340In this update, I’m revisiting the setup I shared earlier that points towards NIFTY’s next potential target at 25,340. The analysis covers the key levels, price action structure, and the factors supporting this move. This setup is based on clear technical confirmations and disciplined risk management — not just speculation.
Please remember to follow your own plan and manage your trades responsibly. This is for educational purposes and not financial advice. Let’s see how the price action unfolds!
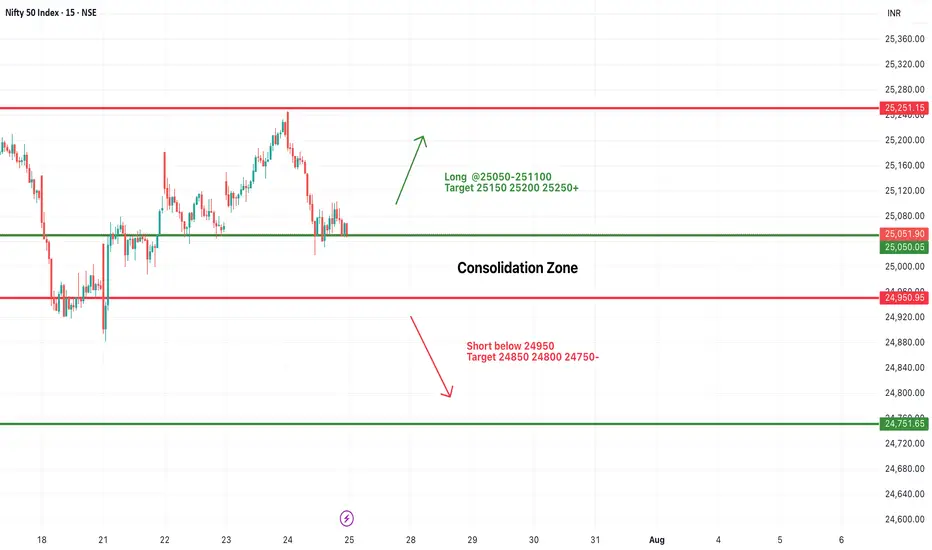
#NIFTY Intraday Support and Resistance Levels - 25/07/2025Nifty is expected to open with a slight gap-down and is currently trading within a tight consolidation zone between 24,950 and 25,050. This narrow 100-point range has acted as a critical zone over the past sessions, indicating indecision and low conviction among traders.
A sustained move above 25,050–25,100 may provide a long opportunity with potential upside targets of 25,150, 25,200, and 25,250+. Strong bullish momentum will only be confirmed if Nifty manages to close above 25,250, which may push the index further toward 25,350–25,400 in the coming days.
On the other hand, a breakdown below 24,950 will shift the bias toward bearishness. A short setup could then target 24,850, 24,800, and 24,750- levels.
Until then, expect sideways price action between 24,950 and 25,050. Traders should wait for a breakout or breakdown before entering fresh trades. Avoid aggressive entries inside this tight band.
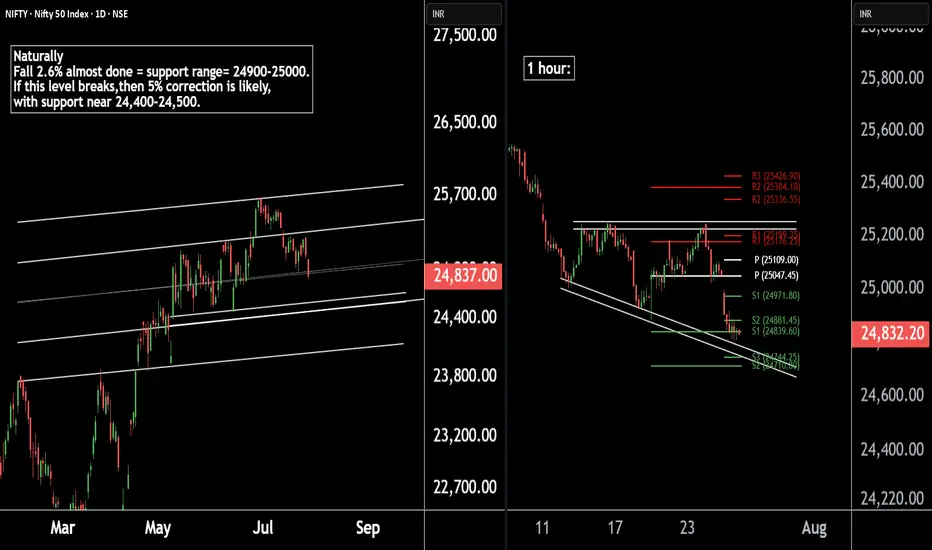
Nifty 50 Update | Technical Levels MappedThere are two chart of Nifty50.
Nifty 50 is trading within a well-defined parallel channel. As part of its natural corrective phase, a potential decline of around 5% cannot be ruled out, with key support anticipated near the 24,400–24,500 zone.
Nifty is forming a broadening wedge pattern on the 1-hour timeframe, with crucial support around 24,740. Additionally, both the weekly and monthly pivot supports are aligned in the 24,740–24,710 zone, reinforcing the significance of this level.
If this level sustain then we may see higher prices in Nifty50.
Thank You !!
Todays nifty market analysis.if nifty sustains above 25150 expecting a target of 25225.
you can expect a bearish momentum below 25118. Target will be 25050.