4 June Nifty50 best trading zone#Nifty50 #option trading
🚀 If you like my trading plan and levels, don't forget to boost the post
99% working trading plan
👉Gap up open 24640 above & 15m hold after positive trade target 24840, 25033
👉Gap up open 24640 below 15m not break upside after nigetive trade target 24390 , 24220
👉Gap down open 24390 above 15m hold after positive trade target 24640
👉Gap down open 24390 below 15m not break upside after nigetive trade target 24220, 24090
📌 Trade plan for education purpose I'm not responsible your trade
More education follow social media and boost my idea
📌 koi bhi trade leval se 20 point ke sl ke bhina karan nahi hi
📌 koi trade app activate tabhi karana hota hi level pe 2 candle uper ya niche closing aati hai to
📌 leval par Ane pe turant trade plan na kare ...
📌 Full risk apaki hi hi meri nahi
NIFTY trade ideas

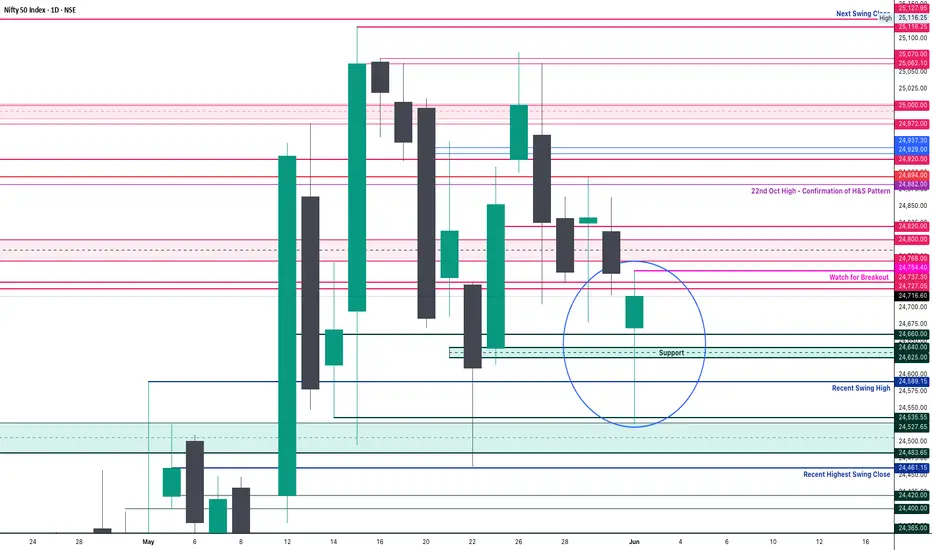
Nifty Analysis EOD – June 3, 2025 – Tuesday🟢 Nifty Analysis EOD – June 3, 2025 – Tuesday 🔴
Opening Sentiment vs. Reality: A Day of Dual Personality
Nifty opened with a 70-point gap-up above the previous day’s high, carrying a positive vibe. In just one minute, it surged another 57 points, marking the day’s high at 24,845. However, that bullish momentum didn’t last. The index faced strong resistance, leading to a sharp 243-point drop within 15 minutes, breaching CPR and the previous swing low to hit the first Current Day Low (CDL) at 24,601.30.
Despite the jolt, Nifty showed resilience—bounced back from the 24,625–24,640 zone, recovered to VWAP, and even retested the PDH. Yet again, it failed to hold above 24,700, echoing the morning's rejection. A second wave of selling took Nifty to a fresh low of 24,502.15 mid-session.
The closing wasn’t any better. Nifty quietly slid again, retested the breakout zone, and closed at 24,542.50, nearly at the intraday low—a day that started with hope ended on a pessimistic note.
Interestingly, India VIX also dropped, despite the downward market move—signalling premium crush and a double whammy for option buyers who got the direction right but profits wrong.
🛡 5 Min Chart with Levels
📊 Daily Summary Highlights
✅ Gap-up Start but sharp reversal
📉 Both PDH and PDL tested intraday
📉 Marubozu Engulfing Candle
⚠️ Closed below Higher Swing Low – a potential trend-shift signal
🕯 Daily Time Frame Chart
🕯 Daily Time Frame Chart
🕯 Daily Candle Breakdown
Open: 24,786.30
High: 24,845.10
Low: 24,502.15
Close: 24,542.50
Net Change: −174.10 (−0.70%)
🕯 Candle Structure
Real Body: 243.80 pts (Big red candle)
Upper Wick: 58.80 pts
Lower Wick: 40.35 pts
Interpretation
A classic bearish reversal day. Price opened higher, reached a new high, but was aggressively sold off, closing near the day’s low. This large-bodied red candle with small wicks shows clear control by the bears.
Candle Type
🟥 Bearish Marubozu-like Candle
Strong rejection at highs
Bearish dominance confirmed
Lower close signals momentum continuation to the downside
Key Insight
24,845 now acts as a firm resistance.
Break below 24,500 could accelerate correction.
Bulls need to defend 24,500–24,520 zone decisively to avoid further weakness.
🛡 5 Min Intraday Chart
⚔️ Gladiator Strategy Update
ATR: 279.13
IB Range: 243.80 → Medium IB
Market Structure: Balanced
Trades:
🔻 12:50 PM – Short Triggered → 📍 1:1 Target Achieved, but timeout
📌 Support & Resistance Zones
Resistance Levels
24,600
24,625 ~ 24,640
24,660
24,727 ~ 24,737
24,768 ~ 24,800
24,820
24,882
24,894 (Strong Resistance)
Support Levels
24,530 ~ 24,480
24,460
24,420 ~ 24,400
24,365 ~ 24,330
24,245 ~ 24,240
💭 Final Thoughts
The market showcased a classic reversal and punished emotional entries. Despite the gap-up euphoria, technical levels reigned supreme. The break below swing low could signal caution for bulls in the coming sessions.
📌 "Respect the levels, not the emotions. Every bounce is not a bottom; every fall isn’t a crash."
✏️ Disclaimer
This is just my personal viewpoint. Always consult your financial advisor before taking any action.

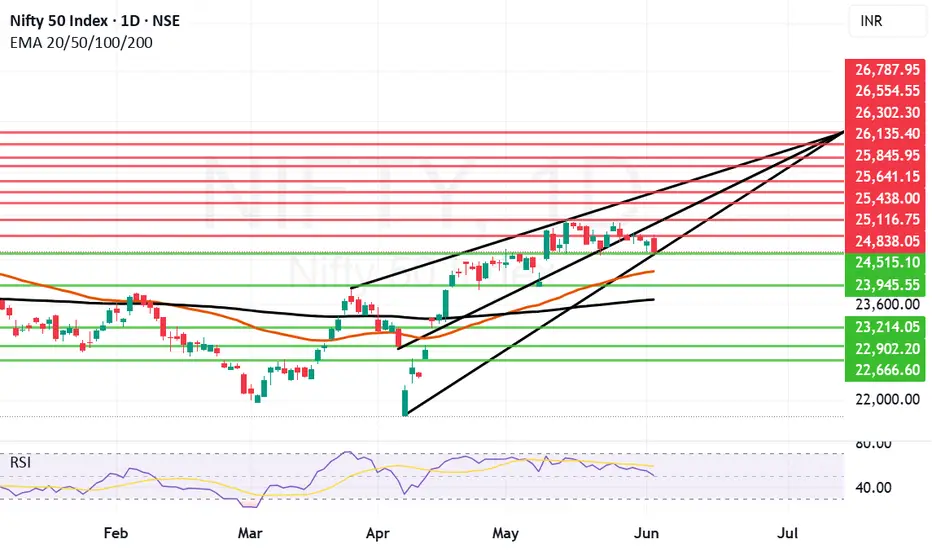
Bull Rally Losing steam as international factors weigh in. The Bull rally that we saw in Nifty in the last one month or so is losing a little steam as international factors related to escalating Russia and Ukraine war and International Tariff war start to weigh in. This made it difficult for Nifty to hold on to levels above 25000 after making a high of 25116 in the current rally. After making a high it is any substantial rally would try to consolidate and find a reasonable bottom from where it can launch again. Verifying a solid support is necessary for rally to move forward.
The supports for Nifty currently are at: 24515, 24185 (Mother line important support), 23945, 23689 (Father line important support). If 23689 is broken the bears will be very active again and can potentially drag down nifty to 23214, 22902 or even 22666. So 24185 and 23689 are important levels for Nifty to hold.
The Resistances for Nifty currently are at: 24838, 25116 (Important Resistance level, recent high). Sustaining above 25116 and Nifty closing above it can enable next leg of the rally which can take us in future to next resistance levels of 25438, 25641, 25845 and 26K+ levels.
The market might be speculating Russian response to Ukraine Drone attack. The scale of Russian attack if it happens will determine the movement of market. The local factors are mostly in favour of Indian markets. So long term investors should not worry. Traders and short term investors should avoid taking unnecessary risk as situation on international front. Geo-Political risk in the subcontinent, at Israel front and Between Russia and other EU nations should be on the hindsight of any decision making. Additionally there are rising number of COVID cases in India which can also become a factor which can effect market sentiment.
Disclaimer: The above information is provided for educational purpose, analysis and paper trading only. Please don't treat this as a buy or sell recommendation for the stock or index. The Techno-Funda analysis is based on data that is more than 3 months old. Supports and Resistances are determined by historic past peaks and Valley in the chart. Many other indicators and patterns like EMA, RSI, MACD, Volumes, Fibonacci, parallel channel etc. use historic data which is 3 months or older cyclical points. There is no guarantee they will work in future as markets are highly volatile and swings in prices are also due to macro and micro factors based on actions taken by the company as well as region and global events. Equity investment is subject to risks. I or my clients or family members might have positions in the stocks that we mention in our educational posts. We will not be responsible for any Profit or loss that may occur due to any financial decision taken based on any data provided in this message. Do consult your investment advisor before taking any financial decisions. Stop losses should be an important part of any investment in equity.
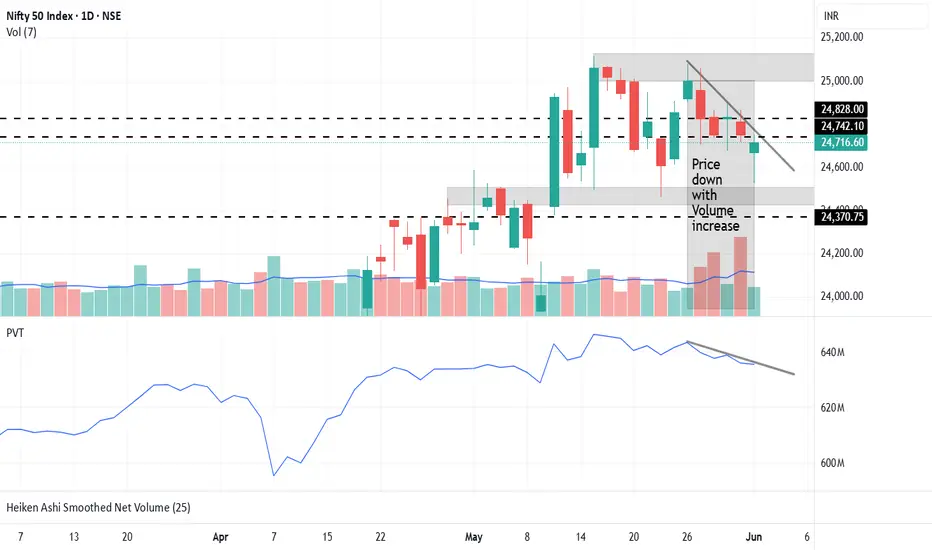
nifty trend directionNifty 24716 result ( spread low-close ) not validating effort ( volume ).Fii's have sold contracts. We expect the trend to continue until Nifty trade below 24712
Nifty levels - Jun 04, 2025Nifty support and resistance levels are valuable tools for making informed trading decisions, specifically when combined with the analysis of 5-minute timeframe candlesticks and VWAP. By closely monitoring these levels and observing the price movements within this timeframe, traders can enhance the accuracy of their entry and exit points. It is important to bear in mind that support and resistance levels are not fixed, and they can change over time as market conditions evolve.
The dashed lines on the chart indicate the reaction levels, serving as additional points of significance to consider. Furthermore, take note of the response at the levels of the High, Low, and Close values from the day prior.
We hope you find this information beneficial in your trading endeavors.
* If you found the idea appealing, kindly tap the Boost icon located below the chart. We encourage you to share your thoughts and comments regarding it.
Wishing you success in your trading activities!

Diametric Pattern near completion?Anticipating a big Upside move after completing g-wave of the Diametric pattern.

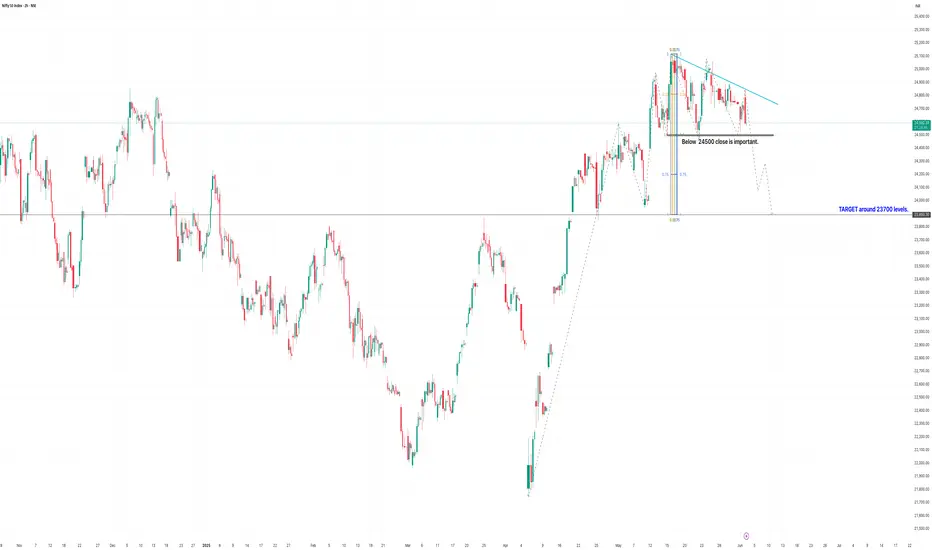
NIFTY 50 Technical View - Symmetrical Triangle PatternNIFTY 50 Technical View:
Formation: Symmetrical Triangle Pattern formation is observed.
Key Support Level: 24,500 — A daily close below 24,500 is critical for confirmation of a breakdown.
Downside Target: Post-breakdown, the next target is projected around 23,700 levels.
Resistance Trendline: Descending trendline acting as a strong resistance on the top side.
Market Implication:
Breakdown of the triangle could trigger a sharp downside move.
Below 24,500, sentiment will likely turn bearish leading toward the 23,700 zone.
Quick Highlights:
⚠️ Watch for a daily close below 24,500.
🎯 Target: 23,700 levels.
⛔ Invalidation: Sustained move above the descending trendline would invalidate the bearish view.
Chart Summary:
The lower highs and strong horizontal support setup which typically hints at a bearish breakout from a triangle.
Disclaimer:
This analysis is for educational and informational purposes only and should not be considered as investment advice or a recommendation to buy or sell any financial instrument. Trading and investing involve significant risk, and you should always conduct your own research or consult with a qualified financial advisor before making any trading decisions. Past performance is not indicative of future results. The author will not be held responsible for any losses incurred from the use of this information.
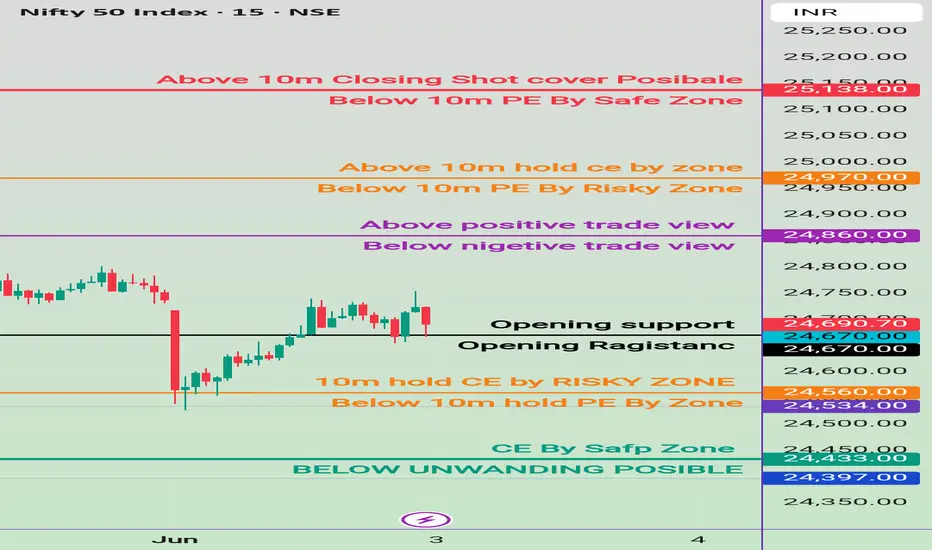
Today 3june 2025 nifty prediction and trade plan 🔼 Upside Scenario (Bullish Bias)
Above 24,820:
➤ "Above positive trade view" zone → Bullish momentum expected.
➤ Target Zone: 24,930
➤ Further target: 25,128
(Strong resistance & short-cover possible).
Above 25,128:
➤ Strong breakout area → Possible aggressive short covering.
➤ Bullish continuation possible if it sustains above this level.
🔽 Downside Scenario (Bearish Bias)
Below 24,630:
➤ Breaks opening support.
➤ Next support: 24,538 → Opening resistance turned into potential support.
Below 24,534 – 24,518:
➤ Enters PE (Put Entry) zone.
➤ Weakness increases below 24,516 → Safe zone for PE traders.
➤ Final bear trigger: Below 24,397 → Unwinding possible.
➤ Target zone for heavy downside: 24,300–24,200.
🟡 Sideways / Choppy Zone
Between 24,630 to 24,820:
➤ No clear trend unless breakout.
➤ Stay cautious → scalp only at levels.
📣 Summary View:
Trend Trigger Level Target Range
Bullish Above 24,820 24,930 → 25,128+
Bearish Below 24,630 24,534 → 24,397 → 24,300
Sideways 24,630 – 24,820 Wait for breakout

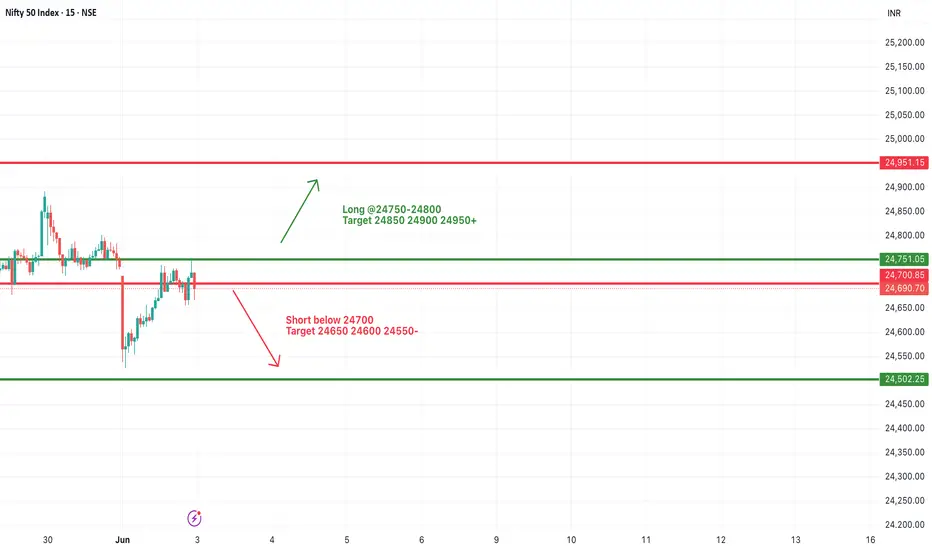
#NIFTY Intraday Support and Resistance Levels - 03/06/2025Nifty is expected to open flat near the 24700 mark, continuing its sideways trend from previous sessions. The index is currently hovering just below the key resistance zone of 24750–24800. A breakout above this level can trigger bullish momentum with upside targets of 24850, 24900, and 24950+. Sustained strength may push the index further toward the 25000–25050 area.
However, if Nifty fails to hold and breaks below 24700, it could lead to bearish pressure. A confirmed breakdown may open downside targets of 24650, 24600, and 24550. Further decline could test the next major support at 24500–24450 levels.
As the market remains range-bound, traders are advised to wait for breakout confirmation with strict stop-loss. Watch for volume and momentum near breakout zones to avoid false signals.
3 june Nifty prediction #Nifty50 #option trading
99% working trading plan
✅ Gap-Up Opening Strategy
🔹 If Nifty opens above 24,860 and hold for 15 mins:
📈 Bullish Trade
🎯 Targets: 24,970
🔹 If Nifty opens at 24,860 but fails to break above after 15 mins:
📉 Bearish Trade
🎯 Targets: 24,670 → 24,560
✅ Gap-Down Opening Strategy
🔹 If Nifty opens above 24,670 and hold for 15 mins:
📈 Bullish Trade
🎯 Targets: 24,860 → 24,970
🔹 If Nifty opens below 24,670 and fails to break above after 15 mins:
📉 Bearish Trade
🎯 Target: 24,560
🎓 For more educational content, follow & support me!
📈 TradingView ID: @mayuraj_820
NIFTY50.....Buy signal!Hello Traders,
the NIFTY50 declined this morning roughly 210 points to 24526! This was today's low!
After, a upmove started and created a buy-signal!
Chart analisys!
This buy-signal will be eliminated below the Monday's low @ 24526! You can enter the trade, if the upmove getting exhausted and retrace a 0.618 Fibo of the advance or you jump directly into the marked!
Price targets will be submitted later!
It becomes essential to handle the stop-loss level consequently @ 24526 points! Just one tick below and the trade must be stop!
If the bulls want to ride this buy signal we can expect a wave c=a!
I will update the count in the coming 1-2 days!
Thank you for your understanding!
Have a great week.....
Ruebennase
Please ask or comment as appropriate.
Trade on this analysis at your own risk.

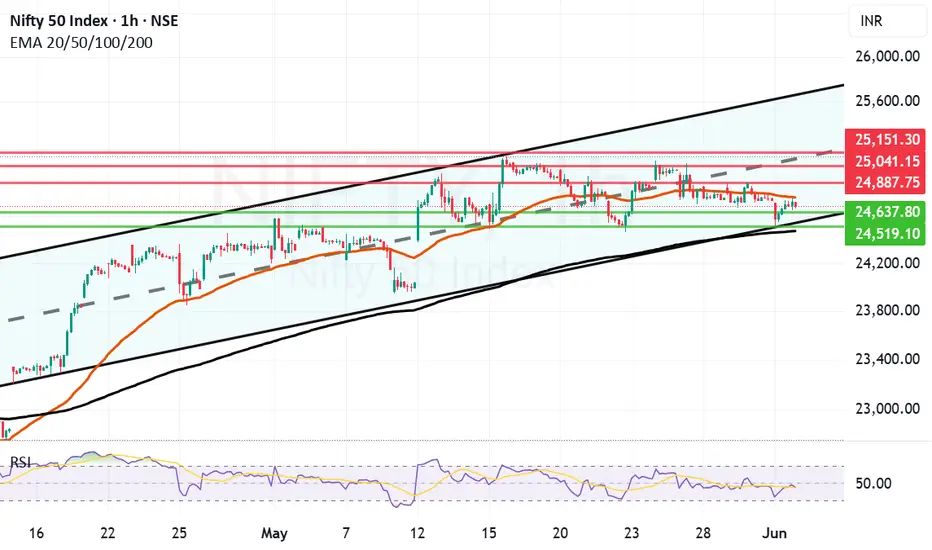
Nifty Bounces from Channel Bottom. Amidst escalation in Ukraine and Russia tussle with Ukraine going on major Drone offensive and Russia likely to respond anytime this week. The escalation can lead to NATO involvement and this can spell a major downside for Global market. The above is just speculation and things can take a different trajectory as well. During such global negative news Indian markets made a low of 24526 but recovered 190 points to close near 24716. This shows the strength of Indian market and shows that we are quiet buoyant.
Resistance for Nifty Remain near: 24763 (Mother Line of Hourly Chart), 24887, 25041 (Mid channel resistance and 25151.
Supports For Nifty Currently remain at: 24637, 24519 (Parallel Channel Bottom) and 24474 (Father Line of Hourly Chart).
If we get a closing below 24474 Bears will have an upper hand and can drag market further down we give the downside levels if we reach there. If we get a closing above 25151 Bulls Will have an Upper hand and can pull the index further upwards we give further upside levels once we reach there.
Disclaimer: The above information is provided for educational purpose, analysis and paper trading only. Please don't treat this as a buy or sell recommendation for the stock or index. The Techno-Funda analysis is based on data that is more than 3 months old. Supports and Resistances are determined by historic past peaks and Valley in the chart. Many other indicators and patterns like EMA, RSI, MACD, Volumes, Fibonacci, parallel channel etc. use historic data which is 3 months or older cyclical points. There is no guarantee they will work in future as markets are highly volatile and swings in prices are also due to macro and micro factors based on actions taken by the company as well as region and global events. Equity investment is subject to risks. I or my clients or family members might have positions in the stocks that we mention in our educational posts. We will not be responsible for any Profit or loss that may occur due to any financial decision taken based on any data provided in this message. Do consult your investment advisor before taking any financial decisions. Stop losses should be an important part of any investment in equity.
Nifty Analysis EOD – June 2, 2025 – Monday🟢 Nifty Analysis EOD – June 2, 2025 – Monday 🔴
“Relaxed day... if you forget the first and last 20 minutes!”
Nifty opened flat with a slightly negative tone and, within the first 20 minutes, collapsed over 200 points, hitting an intraday low of 24,526. However, the day had other plans. A slow and steady recovery followed, with Nifty reclaiming almost all its losses by mid-session. But just when things looked stable, the index shed 88 points in the final 20 minutes, eventually closing at 24,716.60, just 34 points lower than the previous close.
If you ignore the volatility of the first and last few minutes, the day felt calm—almost deceptive. Small and mid-cap stocks, along with Bank Nifty, saw a positive day, showcasing broad market strength despite Nifty’s indecisiveness.
🛡 5 Min Chart with Levels
📌 Diamond Pattern BreakoutAs discussed in yesterday’s note, the diamond pattern on the daily and 5-min chart finally saw a breakout today—and yes, the target was achieved. But let’s be real: with all the action packed into the opening move, most traders (including me) missed the train. A frustratingly textbook pattern—but a tricky execution.
🕯 Daily Time Frame Chart
📊 Daily Candle Breakdown
Open: 24,669.70
High: 24,754.40
Low: 24,526.15
Close: 24,716.60
Change: −34.10 (−0.14%)
Candle Structure:
🟩 Green Candle: Close > Open (46.90 pts body)
🔻 Lower Wick: 143.55 pts – Strong buying at the dip
🔺 Upper Wick: 37.80 pts – Limited rejection from top
Interpretation:Despite closing slightly lower, the candle reflects strong intraday buying after a deep dip. The long lower shadow shows support around 24,520–24,550 is active. Close near the top half signals buyers held their ground after early weakness.
Candle Type:🔨 Hammer-like: Bullish sentiment hidden in the chaos.
Key Insight:
Holding above 24,755 can trigger a fresh bullish leg.
Breach of 24,520 may invite more selling pressure.
🛡 5 Min Intraday Chart
⚔️ Gladiator Strategy Update
ATR: 272.03
IB Range: 191.40 → 🔴 Wide IB
Market Structure: ImBalanced
Total Trades: 0
12:35 – Long signal came, but entry didn’t trigger. No trades taken.
🧭 Support & Resistance Levels
📈 Resistance Zones:
24,727 ~ 24,737
24,768 ~ 24,800
24,820
24,882
24,894
24,920
24,972 ~ 25,000
25,062 ~ 25,070 (5th rejection!)
25,116 ~ 25,128
25,180 ~ 25,212
25,285 ~ 25,399
📉 Support Zones:
24,700
24,660
24,640 ~ 24,625
24,590
24,530 ~ 24,480
24,460
🧠 Final Thoughts
"Structure se hi samjho... market bhale chhup jaye, lekin footprint chhod deta hai."Diamond breakout ho gaya, lekin execution ne dhoka diya. Lesson? Stay ready—patterns repeat, but you only profit if you’re prepared.
✏️ DisclaimerThis is just my personal viewpoint. Always consult your financial advisor before taking any action.
Nifty levels - Jun 03, 2025Nifty support and resistance levels are valuable tools for making informed trading decisions, specifically when combined with the analysis of 5-minute timeframe candlesticks and VWAP. By closely monitoring these levels and observing the price movements within this timeframe, traders can enhance the accuracy of their entry and exit points. It is important to bear in mind that support and resistance levels are not fixed, and they can change over time as market conditions evolve.
The dashed lines on the chart indicate the reaction levels, serving as additional points of significance to consider. Furthermore, take note of the response at the levels of the High, Low, and Close values from the day prior.
We hope you find this information beneficial in your trading endeavors.
* If you found the idea appealing, kindly tap the Boost icon located below the chart. We encourage you to share your thoughts and comments regarding it.
Wishing you success in your trading activities!

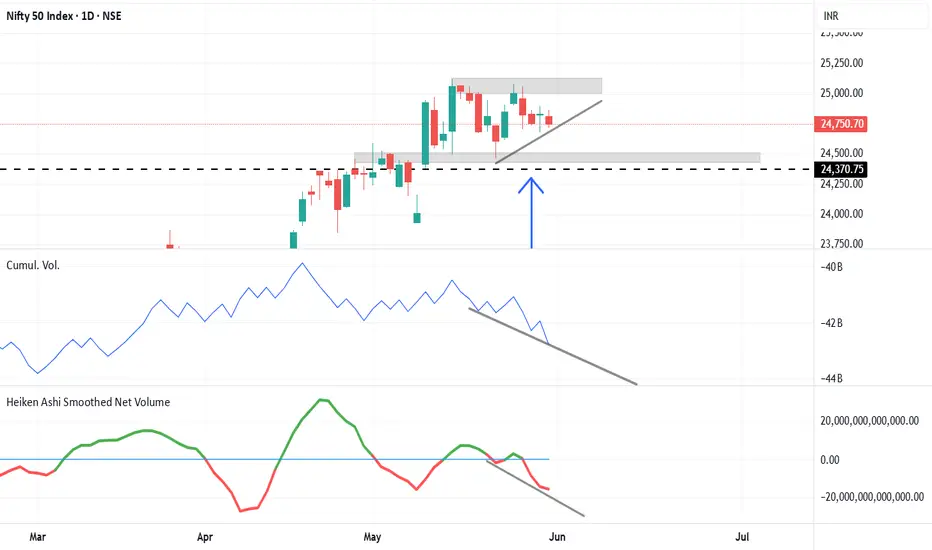
Nifty Trend direction Nifty 24750 is showing hidden divergence in volume which could make nifty to move higher again to test 25005-25116 zone.
Nifty all set to move high ?Nifty 24833 has shown up move sign. We expect Nifty will be moved to high of 25080 with support 24770.

#NIFTY Intraday Support and Resistance Levels - 02/06/2025Nifty is expected to open flat near the 24700–24750 zone. The index has been consolidating in a tight range over the past few sessions, indicating indecision and a potential breakout on either side.
If Nifty sustains above the 24750–24800 zone, a bullish breakout may unfold with upside targets of 24850, 24900, and 24950+. A clear move above 25000 will confirm strong buying momentum with extended targets of 25150, 25200, and 25250+.
On the downside, if Nifty breaks below 24700 and fails to recover, fresh selling pressure could drag the index toward 24650, 24600, and 24550.

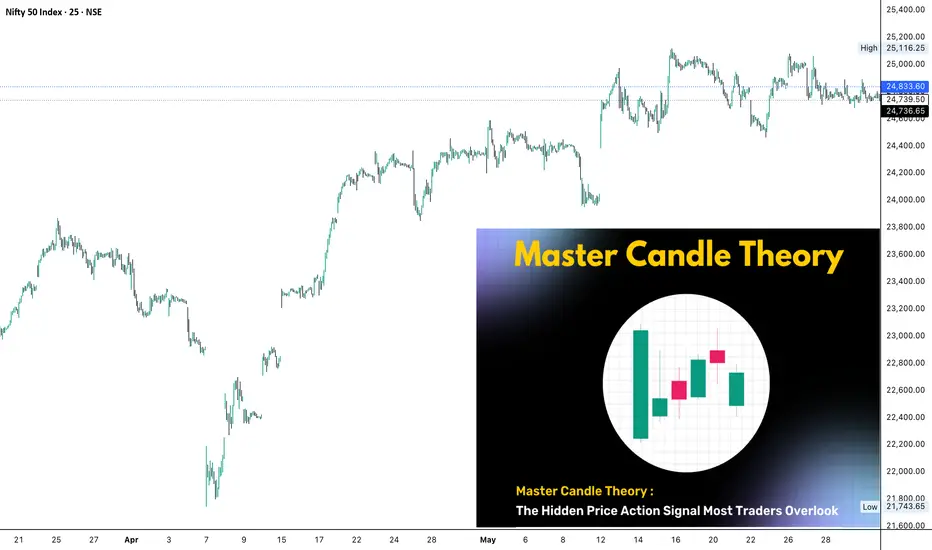
Learning#01 : Master Candle Theory🕯️ Master Candle Theory:
The Hidden Price Action Signal Most Traders Overlook
Introduction
In a world full of overcomplicated indicators and conflicting signals, sometimes the simplest patterns reveal the deepest insights. Master Candle Theory is one such underrated concept — a clean, structure-based method of reading price that often signals major breakouts before they happen.
Whether you're a beginner trying to understand price behavior or a seasoned trader looking to tighten your entries, this article will break down how to identify, understand, and apply Master Candle setups in real markets.
🔍 What is a Master Candle?
A Master Candle (MC) is a single large candlestick that fully engulfs the range (high to low) of the next 3 to 5 candles.
To qualify as a Master Candle:
The candle must have a relatively large range.
The next 3–5 candles should form completely within the high and low of that Master Candle.
These inside candles usually show reduced volatility and indecision.
This creates a "box" or price compression zone, which often leads to a significant breakout.
📊 Why It Matters
Price moves in cycles: expansion → contraction → expansion.
Master Candle formations represent the contraction phase — a build-up of pressure. Traders watching for breakouts from these formations can catch the next expansion leg with better precision.
Key benefits:
Clear structure: Easy to identify on any time frame.
Built-in risk control: The high and low of the MC give natural breakout and stop-loss levels.
Works across markets: Forex, crypto, indices — the principle applies universally.
🛠️ How to Trade the Master Candle Setup
Step 1: Identify the Master Candle
Look for a candle with a wide range.
Confirm that the next 3–5 candles stay within the high-low range of the MC.
Step 2: Mark the MC Range
Draw horizontal lines at the high and low of the MC.
This defines your breakout zone.
Step 3: Wait for a Breakout
Price should break out clearly above or below the MC range.
Volume increase or confirmation candle helps strengthen the signal.
Step 4: Manage the Trade
Entry: On breakout close or retest of the MC boundary.
Stop-loss: Just inside the opposite side of the MC.
Targets: Use previous structure, Fibonacci, or a fixed R:R ratio (e.g., 1:2+).
☠️ Pro Tips and Common Mistakes
✅ Best on higher time frames: MC setups are more reliable on 1H and above.
✅ Look for confluence: Combine MC setups with support/resistance, trendlines, or moving averages for higher probability trades.
❌ Avoid trading inside the MC range: It’s a zone of uncertainty — wait for confirmation.
❌ Don’t force the setup: Not every big candle is a Master Candle. Let the market show you clean, well-formed patterns.
🧠 Kiran’s Approach:
Real-World Application of Master Candle Theory
While the core theory is powerful on its own, I’ve refined a method that filters noise and improves accuracy using a multi-timeframe strategy I call HTF ~ LTF (Higher Time Frame vs. Lower Time Frame).
Here’s how I apply it in my day-to-day trading:
Identify the Master CandleI start by spotting a valid Master Candle and marking its high and low. This forms my breakout zone.
Define the No-Trade ZoneThe middle of the MC range is what I call the No-Trade Zone — a chop area where false breakouts are common. I avoid trading within this midrange.
Use HTF ~ LTF Confluence for BreakoutsOnce the price breaks the high or low of the Higher Time Frame (HTF) Master Candle, I don’t enter right away. Instead, I drop down to the Lower Time Frame (LTF) and wait for a candle to close beyond that breakout level.
Entry ConfirmationMy entry is taken above the high of the breakout candle on the LTF (for long setups), and vice versa for shorts. This gives me an added layer of confirmation and filters out weak breakouts.
Target and Stop-Loss
Target:
The full range of the Master Candle.
Stop-Loss:
For long trades: below the low of the MC.
For short trades: above the high of the MC.
⏱️ Ideal Time Frame Pairings
To apply the HTF ~ LTF (Higher Time Frame vs. Lower Time Frame) approach effectively, I use different time frame combinations based on the style of trade:
⏱️ For Intraday Trades:
Higher Time Frame: 15-minute or 25-minute
Lower Time Frame: 5-minute
⏱️ For Swing Trades:
Higher Time Frame: 75-minute or 1-Day
Lower Time Frame: 25-minute
⏱️ For Positional Trades:
Higher Time Frame: 1-Week
Lower Time Frame: 75-minute
This layered approach has helped me filter out noise, catch stronger momentum moves, and keep my trades structured and disciplined.
📈 Real Market Example
👻 Valid Breakout with Target Example :
👻 Valid Breakout with Partial Target Example :
👻 False Breakout with Valid Breakout Example :
📚 Final Thoughts
Master Candle Theory is a great way to bring structure and patience into your trading. Instead of chasing price, you’re learning to anticipate breakouts and position yourself logically.
Like all strategies, it’s not a magic bullet — but with the right discipline and context, Master Candles can become a high-probability tool in your technical arsenal.
Nifty June Series - 1st Week Analysis Nifty is trading at a very important zone; this week will be very important for both bulls and bears. Upside only above 24970 as it will act as a resistance until Nifty crosses and sustains over it. If Nifty manages to hold above 24970, then we can expect strong short covering upto 25300-400. But if Nifty breaches 24600 on the downside, then we can expect retracement upto 24400-265 zone. So overall, a big move is expected in the upcoming week.

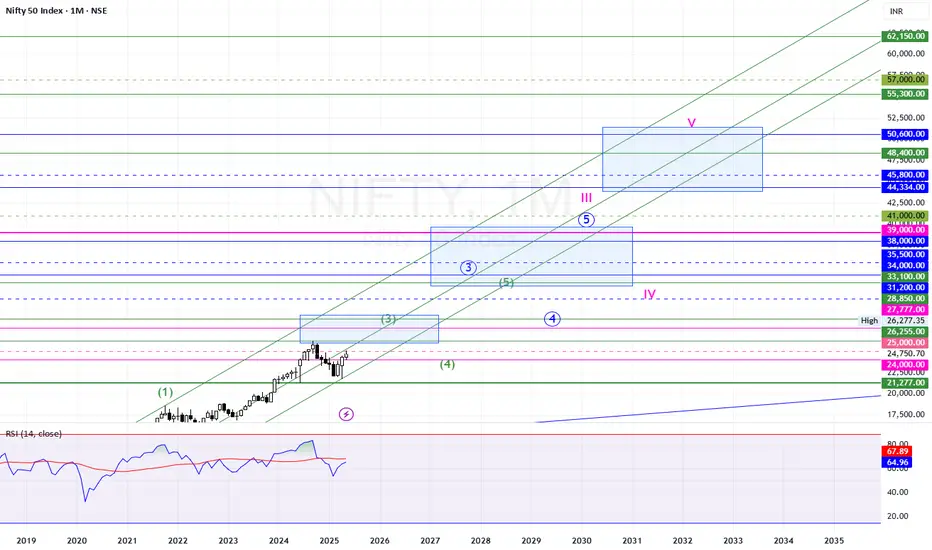
NIFTY ANALYSIS - BIGGER PICTURE for NEXT 5-10-15-20 YEARS - 01-JLTP: 24750
Resistance: 26277
Supports: 21277/14177/7508/2255 (base support)
As long as these supports hold, we can expect more bull move towards 27K/39K/55K/69K/80K+
Target zones:
25000-26255-27777-28850
31200
33100-34000-35500-38K-39K
44300-45800-48400-50600
55300-57K-62150
69555
82500
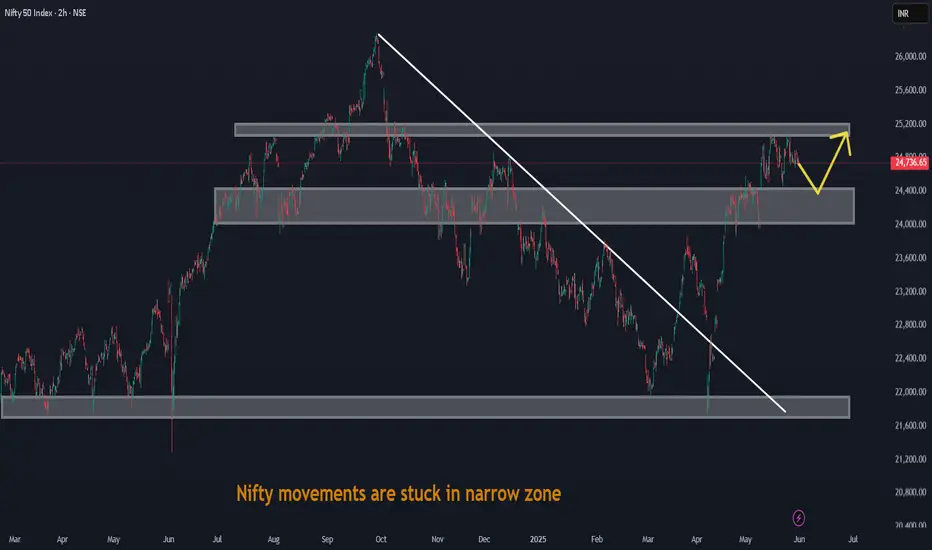
Nifty movements are stuck in narrow zoneNifty movements are stuck in narrow zone, waiting for some new news/event for breakout.
Fibonacci Supports and Resistances Medium to Long term Outlook.Here we have tried to show you Fibonacci supports and resistances for Nifty on Monthly chart with Medium to Long term outlook. Fibonacci retracement suggests the nearby major resistances at 25233.
Crossing this zone and closing above this zone is imperative for proper bull market to return. In such a scenario the next resistances will be at 26277 (Previous All Time high). Closing above 26277 will open the door for the targets of 27K+. The Golden ratio of Fibonacci suggest the cap near 29540 within next 13 to 21 months. Supports for Nifty remain at 24443, 23903, 23375.
Below 23375 Bear market can return and can drag Nifty towards unlikely levels of 22737 or 21743. (This looks unlikely as of now but you can never say never looking at the Tariff wars and not so conducive Geo-Political situation of the subcontinent, Russia-Ukraine, Israel and other factors.)
So one eye of investors should be on macro factors also while looking at rosy micro factors related to Indian markets. While we look forward to making new highs in the next 1 or 2 years. Never forget Stop losses / Trailing stop Losses are best friends of investors. Stop losses protect your capital and trailing stop losses protect your profits.
Disclaimer: The above information is provided for educational purpose, analysis and paper trading only. Please don't treat this as a buy or sell recommendation for the stock or index. The Techno-Funda analysis is based on data that is more than 3 months old. Supports and Resistances are determined by historic past peaks and Valley in the chart. Many other indicators and patterns like EMA, RSI, MACD, Volumes, Fibonacci, parallel channel etc. use historic data which is 3 months or older cyclical points. There is no guarantee they will work in future as markets are highly volatile and swings in prices are also due to macro and micro factors based on actions taken by the company as well as region and global events. Equity investment is subject to risks. I or my clients or family members might have positions in the stocks that we mention in our educational posts. We will not be responsible for any Profit or loss that may occur due to any financial decision taken based on any data provided in this message. Do consult your investment advisor before taking any financial decisions. Stop losses should be an important part of any investment in equity.

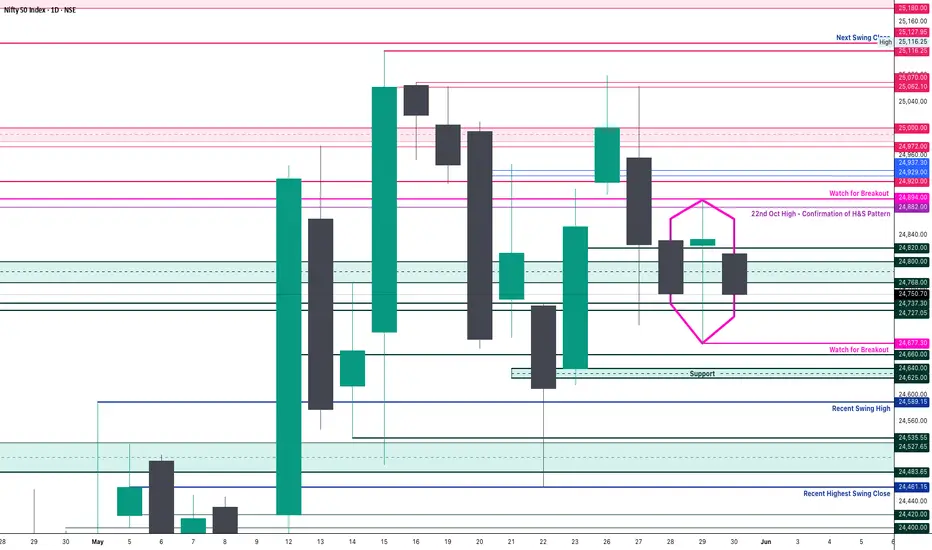
Nifty Analysis EOD – May 30, 2025 – Friday🟢 Nifty Analysis EOD – May 30, 2025 – Friday 🔴
Whatever gain on Thursday, wiped out... today! classic trap reset day
📌 Opening Note:After Thursday’s expiry surprise rally, today’s session turned out to be a mean reversion reality check. With a 44-point gap-down, Nifty attempted a recovery but failed to cross the previous day’s high — just 27 points shy, and rolled over into selling pressure.
📊 Nifty Summary:
Today’s price action stayed entirely within yesterday’s range, forming an inside bar pattern — a classic sign of indecision before a breakout. The morning attempt towards the high was quickly sold into, and the index retraced straight to PDL, where the previous day’s swing low came to the rescue at 24,717.40. From there, it bounced back to VWAP and stayed rangebound (~60–70 points) for the rest of the session.
By the close, intraday gains of Thursday were completely erased — ending exactly at the breakout zone of yesterday: 24,736.65.
🛡 5 Min Chart with Levels
🪞 Mirror Candle Alert!Interestingly, today’s candle (May 30) closely mimics the May 28 candle in structure and price levels:
High: 24,864.25 ~ 24,863.95 (🔁 0.30 pt diff)
Close: 24,752.45 ~ 24,750.70 (🔁 1.75 pt diff)
Low: 24,737.05 ~ 24,717.40 (🔁 19.65 pt diff)
This pattern alignment forms a diamond shape across the last 3 days (May 28–30), visible clearly on Daily and 5-min charts. This diamond formation + inside bar combo could be a powerful breakout setup — direction to be confirmed by the next session’s range expansion. Check out 5 min and Daily candle chart for visual insight.
🛡 5 Min Chart with Patterns
🕯 Daily Time Frame Chart
📉 Daily Candle Breakdown:
Candle Type: Inside Bar
Structure:
Real Body: Very small
Wick Sizes: Decent on both ends, implying indecision
Interpretation:
Inside bar at the top of a move with a prior hammer-like candle signals pause or reversal.
A break of 24,717 on downside = bearish confirmation
A break of 24,893 on upside = bullish breakout
🛡 5 Min Intraday Chart
⚔️ Gladiator Strategy Update:
ATR: 276.90
IB Range: 83.95 → Small
Market Structure: Balanced
Total Trades: 3
🔹 10:15 – Short triggered → Trailing SL hit @ 1:1.6
🔹 11:30 – Short triggered → 1:1.5 achieved
🔹 13:40 – Short triggered → SL Hit
📌 Support & Resistance Zones:
Resistance:
24,768 ~ 24,800
24,820
24,882
24,894
24,920
24,972 ~ 25,000
25,062 ~ 25,070 (5th rejection!)
25,116 ~ 25,128
25,180 ~ 25,212
25,285 ~ 25,399
Support:
24,737 ~ 24,727
24,700
24,660
24,640 ~ 24,625
24,590
24,530 ~ 24,480
24,460
📌 What’s Next? / Bias Direction:
Nifty has compressed into a tight 3-day structure — with a diamond and an inside bar pattern.🎯 Watch for breakout beyond 24,894 or breakdown below 24,677 for directional clarity.Bias remains neutral until price decisively exits this range.
💬 Final Thoughts:
“Breakouts don't lie. Ranges prepare. Patience pays.”
Today was a classic trap reset day. Tomorrow, the trigger might fire. Stay sharp.
✏️ Disclaimer:
This is just my personal viewpoint. Always consult your financial advisor before taking any action.