Nifty levels - May 07, 2025Nifty support and resistance levels are valuable tools for making informed trading decisions, specifically when combined with the analysis of 5-minute timeframe candlesticks and VWAP. By closely monitoring these levels and observing the price movements within this timeframe, traders can enhance the accuracy of their entry and exit points. It is important to bear in mind that support and resistance levels are not fixed, and they can change over time as market conditions evolve.
The dashed lines on the chart indicate the reaction levels, serving as additional points of significance to consider. Furthermore, take note of the response at the levels of the High, Low, and Close values from the day prior.
We hope you find this information beneficial in your trading endeavors.
* If you found the idea appealing, kindly tap the Boost icon located below the chart. We encourage you to share your thoughts and comments regarding it.
Wishing you success in your trading activities!
NIFTY trade ideas

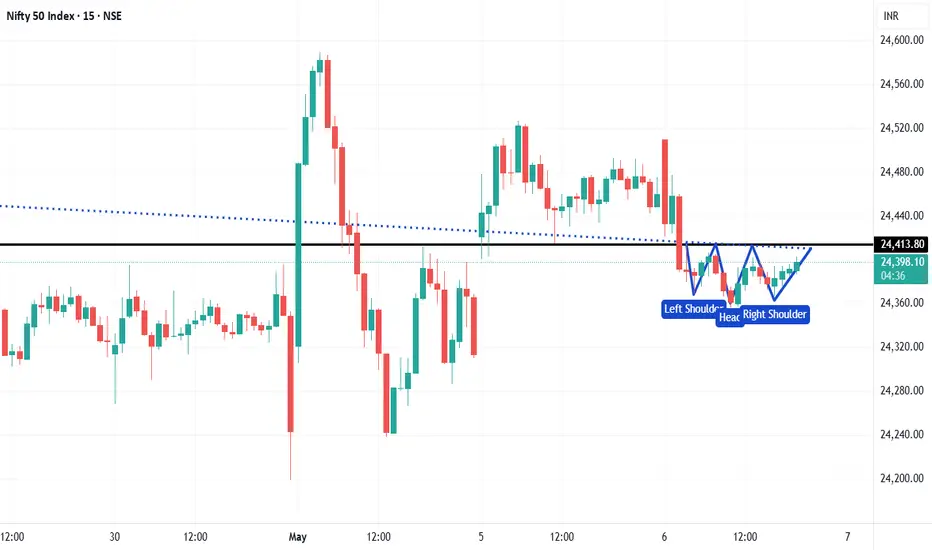
Nifty HS pattern intraday chartNifty 24396 is showing HS pattern in intraday 15 min chart. Possibility to move to 472
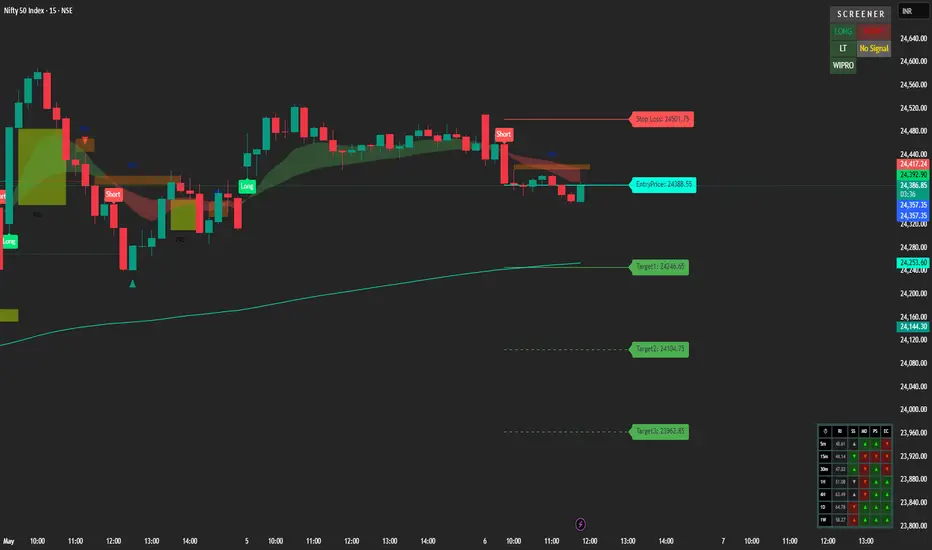
Nifty 50 Short Setup | FVG + EMA | Entry: 24388🧠 Description:
This is a short trade setup on the Nifty 50 Index (15-minute chart) based on a confluence of key indicators and price action patterns.
🔍 Setup Overview:
The price broke below a minor consolidation zone after rejecting the Fair Value Gap (FVG) and the dynamic EMA resistance.
The bearish bias is confirmed by the structure and a clear lower-high formation, indicating short-term weakness.
📌 Trade Details:
Entry Price: ₹24,388.55
Stop Loss: ₹24,501.75 (above recent swing high and FVG rejection zone)
Target 1: ₹24,246.65
Target 2: ₹24,104.75
Target 3: ₹23,962.85
These targets align with previous demand zones and EMA support areas on higher timeframes.
📊 Indicators Used:
Fair Value Gaps (FVG) to identify supply zones.
Exponential Moving Average (EMA) as a dynamic resistance.
Multi-timeframe screener (bottom-right) confirms bearish pressure across multiple timeframes — strong bearish momentum visible on 5m to 1h charts.
🧩 Trade Logic:
The FVG rejection and price trading below the EMA band suggest weakness. The entry was taken after a confirmation candle closed below the EMA cloud, with low buying volume. Targets are conservative and mapped according to volume gaps and previous consolidation zones.
🔔 Risk-Reward Consideration:
The setup offers a healthy reward-to-risk ratio (~3:1) if price reaches the final target.
📈 Let me know your thoughts or feedback. This is a purely technical setup — no news or macro fundamentals are factored in.
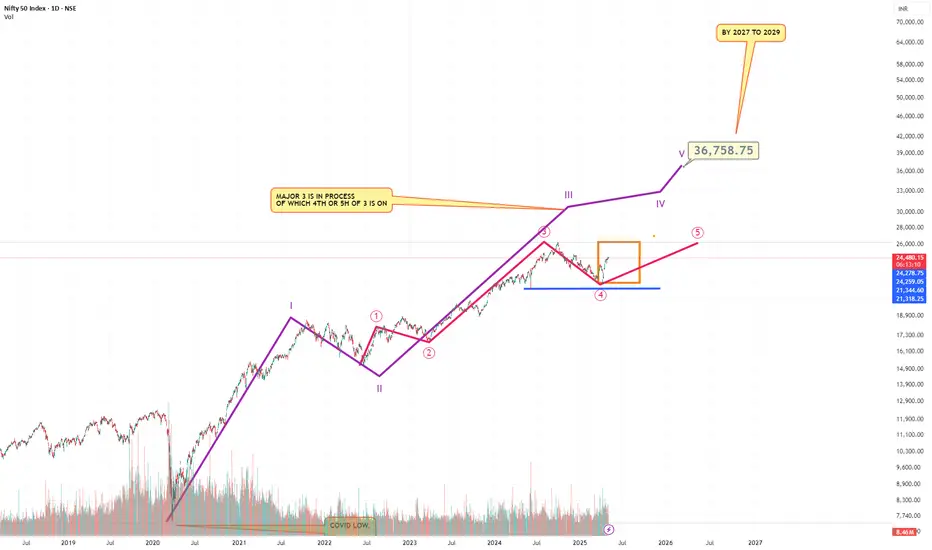
NIFTY Future Marked on chart...And its good News.I did the count of Neo waves on the Nifty...I have marked the larger cycle and the tgt by 2029 is around 37000...If all 5 waves are completed..right now we are in the 5th wave of the 3rd wave ..Please refer to chart....Also the Indian demographics support this..So please enter your favorate frontline blue chip stocks and sit tight...Please feel free to challenge this chart..I would be happy
#NIFTY Intraday Support and Resistance Levels - 06/05/2025Flat opening in nifty in consolidation zone of 24450-24500 level. After opening any side breakout can gives strong rally in nifty. If nifty starts trading and sustain above 24500 level then expected upside rally upto 24750+ level in today's session. Downside below 24450 level there will be further downside possible upto the 24250 support level.

Nifty Impulsive Sequence Approaching Its EndThe Nifty Index has staged a notable recovery after a selloff that began on September 27, 2024, from a high of 21,748.65. We label this decline as wave (II), and the index has since turned upward. However, to confirm that the correction is over and avoid a potential double correction, the index must break above its previous peak of 26,277.35. The rally from the wave (II) low is expected to unfold as a five-wave impulse structure, a pattern commonly analyzed in Elliott Wave theory.
Starting from the wave (II) low, the first wave (wave 1) peaked at 22,697.2, followed by a pullback in wave 2 that bottomed at 22,353.25. The index then surged in wave 3, which itself subdivided into a smaller impulsive structure. Within wave 3, the first sub-wave ((i)) reached 23,372.75, followed by a dip in wave ((ii)) to 23,273.05. The third sub-wave ((iii)) climbed to 24,242.6, with a brief pullback in wave ((iv)) to 24,126.95. The final sub-wave ((v)) concluded at 24,359.3, completing wave 3. A subsequent wave 4 pullback found support at 23,847.85.
Currently, the index may achieve a few more highs, but the rally from the April 7, 2025, low appears mature and could soon face a three-wave correction. As long as the key support at 21,748.65 holds, any near-term pullbacks should find support in a 3, 7, or 11-swing pattern, setting the stage for further upside.

Nifty EOD Analysis – May 3, 2025 Monday🟢 Nifty EOD Analysis – May 3, 2025 Monday🔴
A positive open... but no follow-through. Still stuck in consolidation.
📊 Nifty Summary
Nifty opened with a gap up of 72 points at 24,420, marking the first open above 24,365 in the last 7 sessions — a positive sign. However, the enthusiasm lacked momentum. Price struggled to cross the resistance at 24,526, and the index drifted back toward the mean, trading the entire day between the initial balance (IB) range and hovering around VWAP.
🔹 Intraday Movement: Just 125 points, the smallest in the last 12 sessions — a clear sign of contraction.
🔹 Closing: 24461 closing is the first closing above 24365 in the last 7 sessions.
🔹 Structure: Daily candle formed an Inside Bar, signaling potential energy buildup.
📌 Strategy Forward: Stay alert for an expansion move from this coil — contraction often precedes sharp action.
📌 5 Min Time FrameChart
📌 Daily Time FrameChart
🕯️ Daily Time Frame Chart & Candle Breakdown
🔍 Today’s Candle Type: Spinning Top with a long upper wick
Candle Definition:
A Spinning Top reflects market indecision — both bulls and bears attempted moves, but neither gained dominance. A long upper wick with a narrow body often signals failed bullish momentum or fading enthusiasm.
📌 Today’s OHLC:
Open: 24,419.50
High: 24,526.40
Low: 24,400.65
Close: 24,461.15
Change: +114.45 (+0.47%)
🧱 Candle Structure:
🔹 Real Body:
🟢 Green candle with a modest body →
24,461.15 – 24,419.50 = 41.65 pts
🔹 Upper Wick:
24,526.40 – 24,461.15 = 65.25 pts
🔹 Lower Wick:
24,419.50 – 24,400.65 = 18.85 pts
📖 Candle’s Interpretation:
Despite a strong open and attempt to push higher, the resistance at 24,526 capped the move. The long upper wick shows that buyers lacked follow-through strength, and the close back near the middle of the range indicates a market still stuck in balance.
📉 The Inside Bar + Narrow Range combo is a potential signal for volatility ahead — traders should watch closely for a breakout from this range.
⚔️ Gladiator Strategy Update
📊 Strategy Parameters:
ATR: 303.46
IB Range: 110.65 pts
IB Category: Medium IB
Market Structure: Balanced
📌 Trade Highlights:
Trade Count: 0
❌ No Trigger generated by the system — a no-trade day.
🧠 Note: In contraction phases, it’s common to get fewer setups. Patience is key.
🔮 What’s Next?
Markets are coiling tightly, and an expansion move is likely around the corner. As long as price holds above the 24,330–24,360 band, bulls have hope — but conviction is needed above 24,540.
🧱 Support & Resistance Levels
🔺 Resistance Zones:
24,480 ~ 24,540 (Includes psychological level: 24,500)
24,590 (PDH – Immediate hurdle)
24,800
🔻 Support Zones:
24,400 (CDL)
24,330 ~ 24,360
24,190 ~ 24,225 (Immediate Support)
24,120
24,050
24,000 ~ 23,950
23,820
23,710 ~ 23,660
23,500
23,410 ~ 23,370
23,215
✏️ Disclaimer
This is just my personal viewpoint. Always consult your financial advisor before taking any action.
Nifty May Series ExpectedNifty Last close as expected zone 24471.30
Expected inspite of INDO-PAK pressure
Possibility upmoves slow n steadily as per marked range/
Profit booking or similar correction due to indo pak cannot be avoided
as per marked gap filling zone active till then

Nifty Trend directionNifty 24461 - Has resistance at 24687 and support at 24330.
Has given wedge pattern.
Trend decider will be 24480.

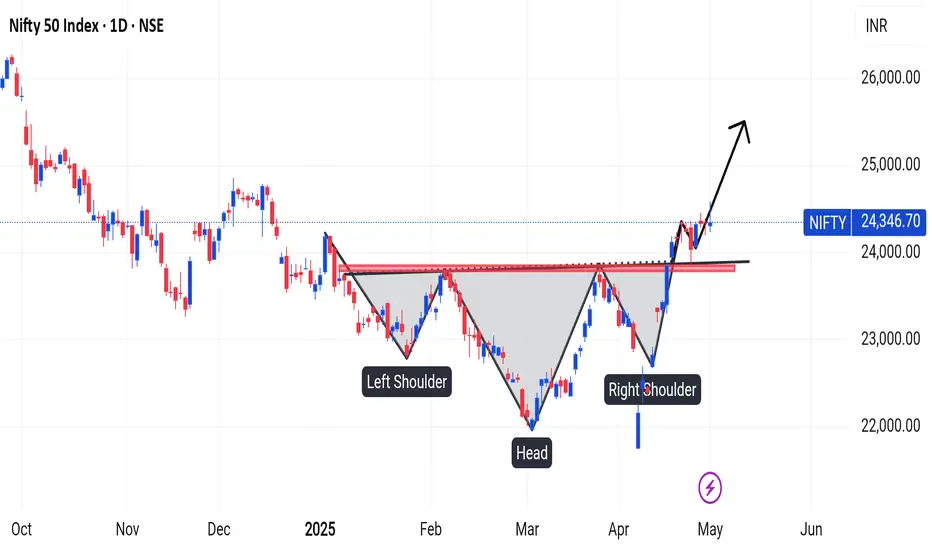
Sustaining above the NECKLINE!! As we can see NIFTY is sustaining itself above the neckline of inverted head and shoulders pattern which make it in a very diabolical place as any closing below the neckline could lead to massive fall but continuous sustainment above the given neckline could show further upmove so plan your trades accordingly and keep watching everyone.
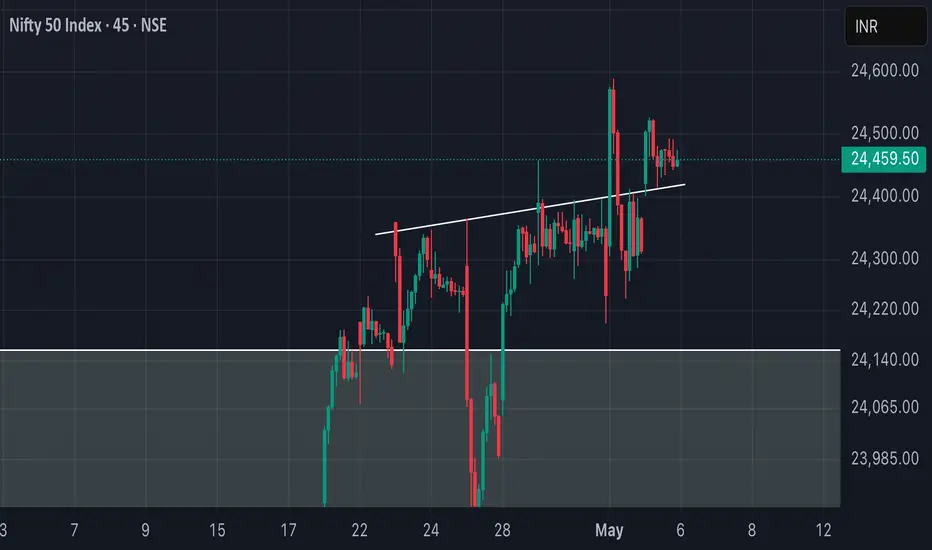
"Nifty 50 at a Crossroads: Rising Wedge Signals Breakout or Brea* A **rising wedge** pattern is clearly forming, marked by two upward sloping blue trendlines.
* Inside this wedge:
* Multiple **price swings** (higher highs and higher lows) are visible.
* Recent breakout attempts are marked with zig-zag arrows showing potential breakout direction
📈 **Bullish Signals:**
1. **Strong Uptrend:**
* A sustained rally from \~23,000 up to the current levels (\~24,500) indicates strong bullish momentum.
2. **Breakout Potential:**
* Price is attempting to break out above the rising wedge pattern.
* Immediate **bullish target zone** is around **24,596 to 24,754**, marked with a green "Target" label.
3. **Volume Surge:**
* Recent bullish candles are supported by increased volume, suggesting real interest in the breakout.
📉 **Bearish Risks:**
1. **Rising Wedge Risk:**
* Rising wedge patterns often lead to **bearish breakdowns**.
* If the support of the wedge is broken, the **first downside target** is marked at **24,369**, and **next support** at **24,291**.
2. **Volume Divergence:**
* Although there's some volume on bullish moves, the consistency is lacking compared to the strong rally before April 23.
**Key Price Levels:**
| 24,754.90 | Resistance | Upper range of rising wedge (target) |
| 24,596.40 | Resistance | First bullish target zone |
| 24,520.00 | Minor Resistance | Recent swing high |
| 24,369.45 | Support | First bearish target if wedge breaks |
| 24,291.25 | Key Support | Critical support, below wedge trendline |
| 23,786.80 | Strong Support | Previous consolidation breakout zone |
**Conclusion:**
* The Nifty is in a **tight rising wedge**, typically a **bearish** reversal pattern. However, if bulls can push past **24,520–24,596**, it may invalidate the pattern and open further upside.
* Until a confirmed breakout or breakdown occurs, traders should remain cautious and wait for **volume-backed confirmation**.

Nifty levels - May 06, 2025Nifty support and resistance levels are valuable tools for making informed trading decisions, specifically when combined with the analysis of 5-minute timeframe candlesticks and VWAP. By closely monitoring these levels and observing the price movements within this timeframe, traders can enhance the accuracy of their entry and exit points. It is important to bear in mind that support and resistance levels are not fixed, and they can change over time as market conditions evolve.
The dashed lines on the chart indicate the reaction levels, serving as additional points of significance to consider. Furthermore, take note of the response at the levels of the High, Low, and Close values from the day prior.
We hope you find this information beneficial in your trading endeavors.
* If you found the idea appealing, kindly tap the Boost icon located below the chart. We encourage you to share your thoughts and comments regarding it.
Wishing you success in your trading activities!

#NIFTY Intraday Support and Resistance Levels - 05/05/2025Gap up opening in nifty. Expected opening near 24450 level. After opening if nifty starts trading and sustain above 24500 level then possible strong upside rally in index upto 24750+ level in today's session. Downside 24250 level will act as a strong support for today session. Any major downside only expected below this support level.

Nifty 50 If you find this helpful and want more FREE forecasts in TradingView, Hit the 'BOOST' button
Drop some feedback in the comments below! (e.g., What did you find most useful?
How can we improve?)
Your support is appreciated!
Now, it's your turn!
Be sure to leave a comment; let us know how you see this opportunity and forecast.
Have a successful week
DISCLAIMER: I am NOT a SEBI registered advisor or a financial adviser. All the views are for educational purpose only
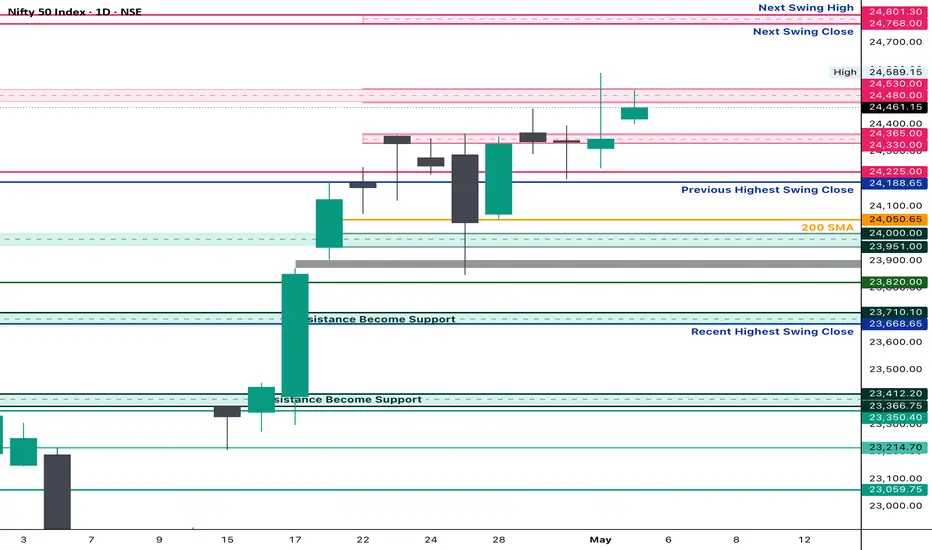
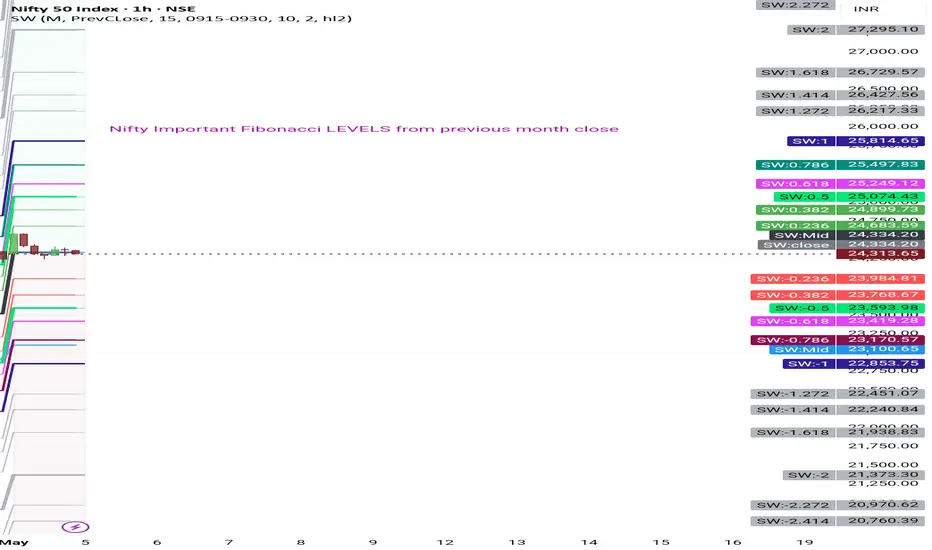
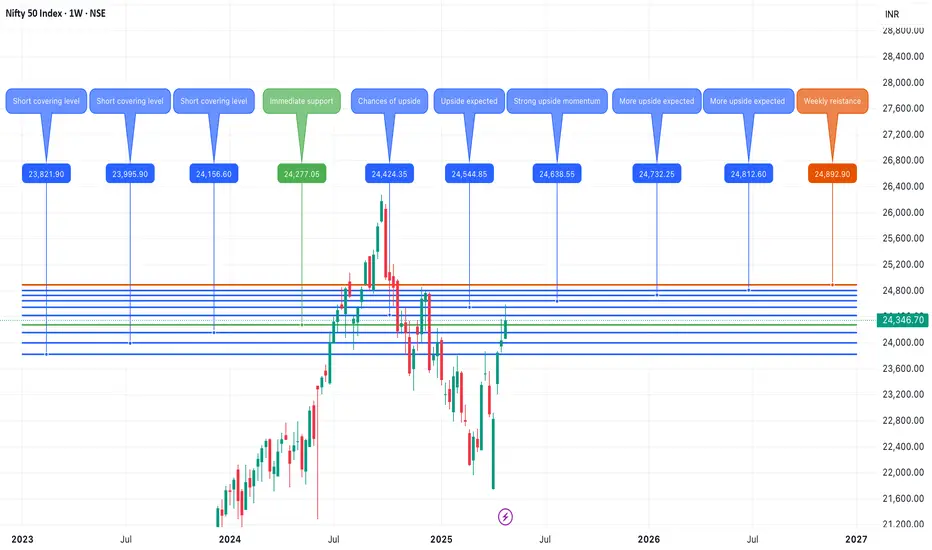
Nifty Important Fibonacci levels from previous month closeNifty Important levels for May 2025 from previous Month close price

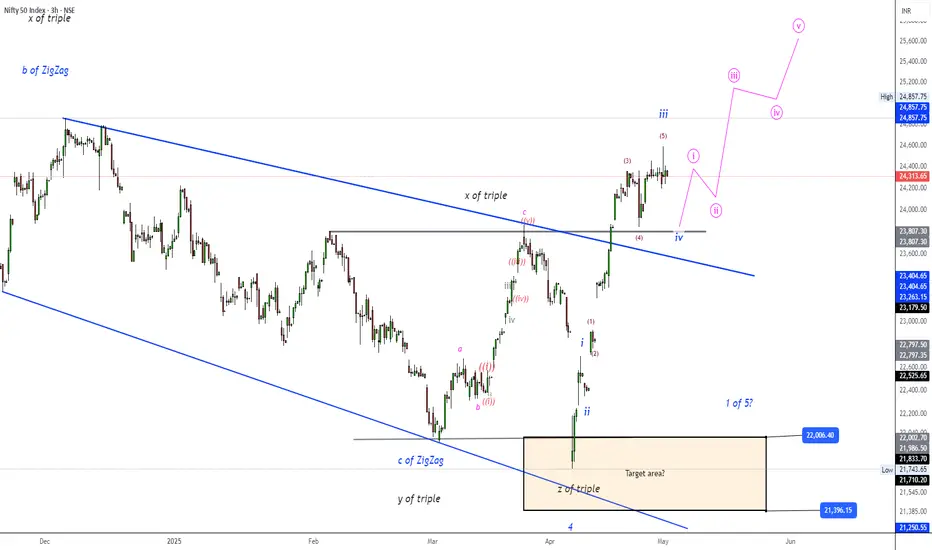
NIFTY50.....Buying panic all around!
Hello Traders,
the NIFTY50 has extended my cited price area to ~24620 range. It was exactly @ 24589.15 points!
Here, a wave iii (blue) ended!
Chart analysis:
If this was all of waves (5) of iii (blue), the next move could be a wave iv (blue) to around the range of 23709 to 23845.15 zone! This one should morph into an a-b-c correction, or a triangle. While triangles are the most often failed chart patterns during a wave iv of any degree is, we will focus on the a-b-c correction!
So, one higher high is still missing, but I guess the next high will be just a wave ((i)) of v (blue) with more highs to come!
As I am in a hurry, only a short update today. I'll try to publish another update by Wednesday.
Have a great Sunday.....
Ruebennase
Please ask or comment as appropriate.
Trade on this analysis at your own risk.
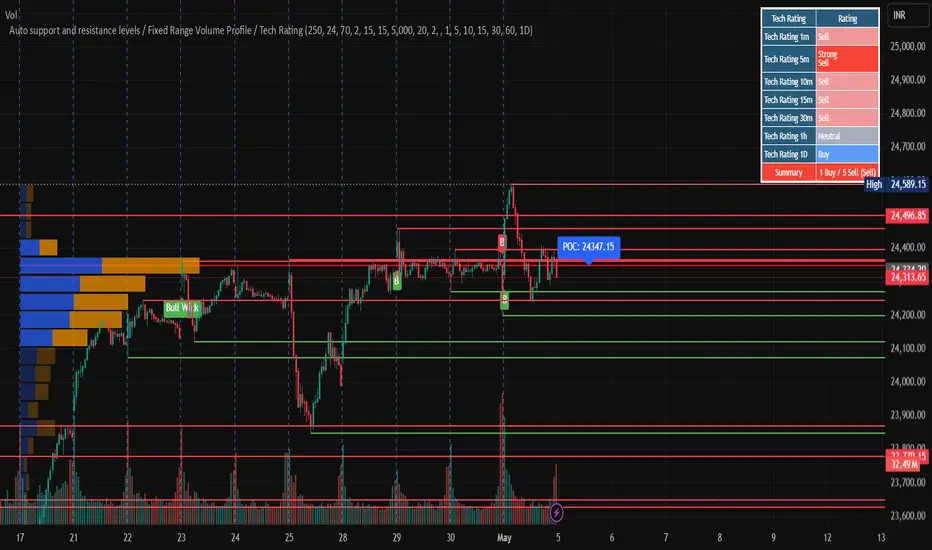
"Auto Support & Resistance + Fixed Range Volume Profile + Techni"Auto S&R + Volume Profile + Tech Ratings combines multi-timeframe technical signals with automatically plotted support and resistance levels. It features:
Dynamic volume-based breakout detection
Fixed Range Volume Profile with Point of Control
Pivot-based auto support/resistance levels
Multi-timeframe technical rating summary
Ideal for intraday and positional traders looking for strong confluence zones and trend confirmation."
Caution time in niftyFrom few days market is going sideways in direction while number of declining stocks in market have surpassed the number of advancing stocks which shows us the underlying selling in stocks. This shows underlying weakness in stock market. This may change in future but currently need to be cautious in market. Tighten your stoplosses or trade with low position size.

Weekly Market Wrap Nifty, Mid & Small Caps, and S&P 500 OutlookNifty ended the week on a strong bullish note, closing at 24,346, up by 307 points from the previous week. The index traded within a tight range, hitting a high of 24,589 and a low of 24,054, aligning perfectly with my projected range of 24,650–23,400.
📌 Key Technical Levels to Watch:
Nifty closed just below a crucial Fibonacci resistance at 24,414.
A daily close above 24,414 next week could open the door for a sharp move towards the next major resistance at 24,770.
While my system suggests a broader range of 24,900–23,800, I personally hope for a healthy consolidation to cool off some momentum—paving the way for a stronger, faster rally in the coming weeks.
Caution Zone:
A break below 23,800 might signal the return of bears, potentially dragging the index down to test critical support at 23,200/23,100.
Midcap & Smallcap Watch:
I’ve received a lot of queries about Midcap and Smallcap indices, and here’s the honest truth—they remain in a 'no-trade' zone. Despite Nifty's strength, the rally hasn’t lifted most Mid & Small Cap stocks.
👉 Investors holding quality, fundamentally strong stocks in these segments should stay calm, but avoid high PE or overvalued stocks until we get a clear monthly buy signal on the charts.
🌍 Global Markets – S&P 500 Analysis:
The S&P 500 closed the week at 5,686, just above the strong Fibonacci level of 5,637. Sustaining above this level could lead to a rally toward 5,770/5,821. However, a failure to hold this support might trigger a 2–3% pullback, which could ripple across global markets, including India.
📣 Bottom Line:
Nifty bulls need a close above 24,414 to push higher.
Mid & Small Cap space remains tricky—stay selective.
Watch global cues, especially from the US, for broader market direction.
Stay nimble, stay informed. ✅

NIFTY Analysis for 5th MayIn M15 chart we can see market is bullish as recently candles have created BOS (Break Of Structure). So, we have to find buying opportunity. Now how can we get the long entry? For that we have to wait for a while to make the proper structure of candles.
If the price sweep the IDM (X) (Inducement) level 24197 and form any rejection candle, we can take the entry here or else we have to wait until the market hit the demand zone.
In conclusion, Demand zone entry is much safer than the previous entry.

Nifty May 1st Week AnalysisNifty is looking positive for the upcoming week, and we can expect highs of 23850-900+ if Nifty manages to close above 24550 on a daily basis. Downside risk will become more prominent if Nifty closes before 24250 on a daily candle. All levels are marked in the chart posted.
How I traded Nifty and Bank Nifty on 2-05-2025This is meaningful and descriptive analysis of how I trade indices Based on the concepts of Swings , LH and HL The backbone of this trading strategy is trend following Hope you guys learnt something out of this Ping me if you need more help with strategy
