#Nifty directions and levels for July 23rd:Good morning, friends! 🌞
Here are the market directions and levels for July 23rd:
The global market shows no major changes and continues to maintain a moderately bearish sentiment.
Meanwhile, the local market is exhibiting a moderately bullish tone. Today, Gift Nifty indicates a gap-up opening of around 60 points.
What can we expect today?
In the previous session, both Nifty and Bank Nifty couldn't sustain the gap-up start. Structurally, we are still in an unclear zone.
However, my expectation is that today’s market may take some consolidation after the gap-up start.
Looking at the chart, the current view suggests:
* If the market sustains the gap-up and breaks the immediate resistance, we can expect the pullback to continue with a moderately bullish tone.
Alternate view:
* If the gap-up doesn’t sustain and the market declines initially, it may reach the immediate support level.
* If a pullback happens from there, we can expect a range-bound market.
* Conversely, if the support breaks, the correction is likely to continue.
NIFTY trade ideas
Monday Gap down ProbabilityAs market sentiments are negative where smallcap and midcap tumbles possible gap down after weekend , positive bias after breaking 25062 level till then market showing bearish movement
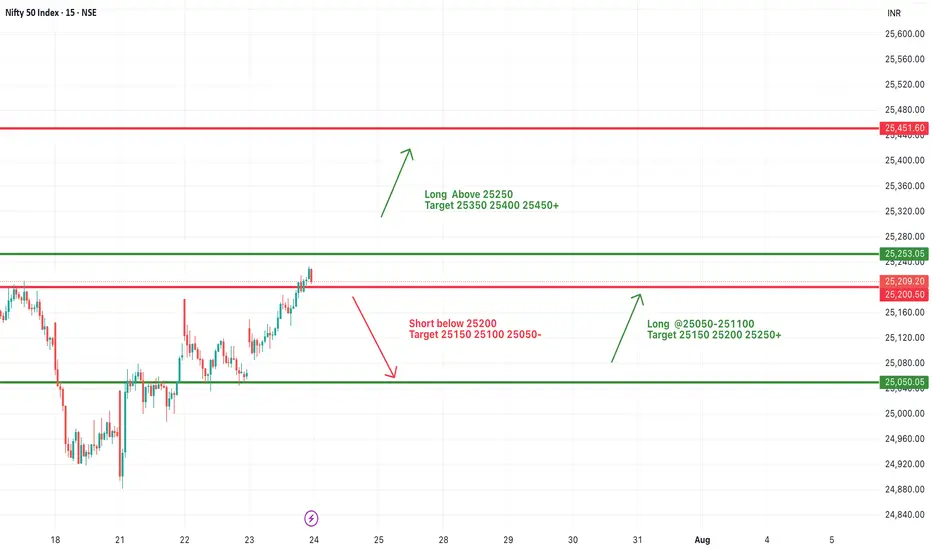
#NIFTY Intraday Support and Resistance Levels - 24/07/2025Nifty is expected to open with a bullish gap-up today, breaching the 25,250 resistance zone. This level has been acting as a consolidation ceiling in recent sessions, and today’s opening above it indicates strong buying momentum in the market.
If Nifty sustains above 25,250, we may witness a fresh upside rally towards the immediate targets of 25,350, 25,400, and 25,450+. A decisive breakout above this zone would mark the continuation of the upward trend and may attract aggressive long-side participation.
On the downside, if Nifty slips and sustains below 25,200–25,250, weakness could resume. A break below 25,200 may lead to a correction toward 25,150, 25,100, and possibly even 25,050-, which will now act as a crucial support zone.
Overall, today's session may remain bullish above 25,250 with momentum trades favored on the long side.
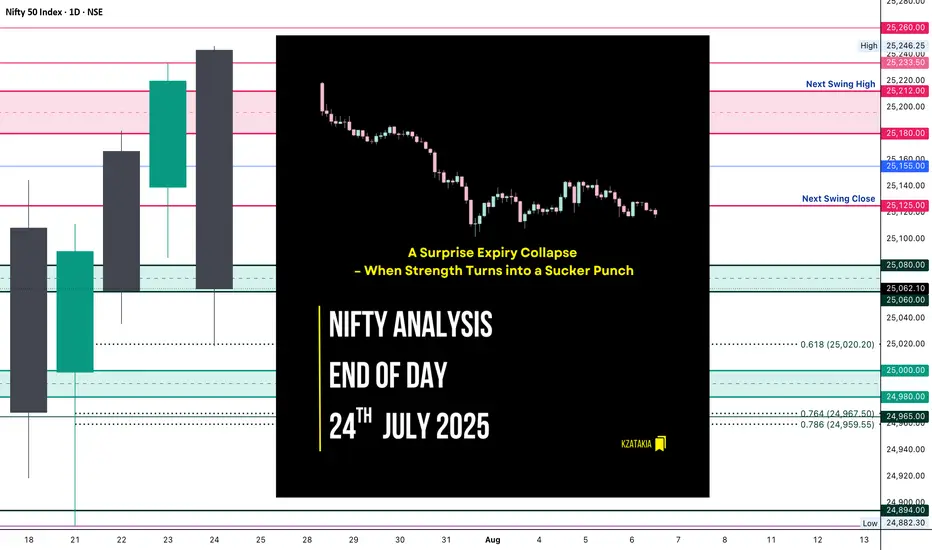
Nifty Analysis EOD – July 24, 2025 – Thursday 🟢 Nifty Analysis EOD – July 24, 2025 – Thursday 🔴
📉 A Surprise Expiry Collapse – When Strength Turns into a Sucker Punch
Today’s session was an unexpected twist.
Nifty opened above the previous day’s high, giving early hope to the bulls—but within the first hour, it slipped to 25,155 and formed its IB. What followed was a sharp 136-point fall, breaking not just yesterday’s low, but also the July 22nd low. This sudden bearish momentum was completely news-driven, and expiry-day long unwinding only added fuel to the fire.
Despite a strong close yesterday, today’s fall erased all of July 23rd’s gains and brought us right back to July 22nd’s close—neutralizing the recent upward effort.
The day closed at 25,062, marginally above key support. Technically, today’s low respected the 0.618 Fib retracement level drawn from July 21st’s low to July 23rd’s high—so a dead cat bounce is possible if no further bad news hits. But if we open below 25,050 tomorrow, expect more downside pressure toward 24,960–24,890 zones.
🕯 5 Min Time Frame Chart with Intraday Levels
🕯 Daily Time Frame Chart with Intraday Levels
🕯 Daily Candle Breakdown
Open: 25,243.30
High: 25,246.25
Low: 25,018.70
Close: 25,062.10
Change: −157.80 (−0.63%)
Candle Structure Analysis:
🔴 Body: Large red body (181.2 pts) shows strong intraday selling.
☁️ Upper Wick: Tiny (2.95 pts) → sellers dominated from the start.
🌊 Lower Wick: Moderate (43.4 pts) → small recovery near close.
Candle Type:
Almost a bearish Marubozu — clear domination by sellers with barely any upper shadow, signaling intense sell pressure.
Key Insight:
Bulls lost control after open.
Bears took charge below 25,155.
Close near support, but bias cautious.
Bulls must reclaim 25,150+ for recovery, else 25,000 may give way.
🛡 5 Min Intraday Chart
⚔️ Gladiator Strategy Update
ATR: 185.97
IB Range: 83.55 → Medium
Market Structure: Balanced
Trades Triggered:
⏰ 10:05 AM – Short Entry → SL Hit
⏰ 11:10 AM – Short Entry → Target Hit (1:3.6 Risk:Reward)
📊 Support & Resistance Levels
Resistance Zones:
25,125
25,155
25,180 ~ 25,212
25,233
Support Zones:
25,080 ~ 25,060
25,020
25,000 ~ 24,980
24,967 ~ 24,959
24,882
🔮 What’s Next?
A gap-up or stable open may trigger a dead cat bounce toward 25,150–25,180.
A gap-down below 25,050 confirms bearish continuation → next targets: 24,960 / 24,890.
Watch price action around the 25,020–25,060 zone closely.
🧠 Final Thoughts
“Markets are never wrong – opinions often are.”
— Jesse Livermore
Today was a reminder of how expiry day surprises and news flows can flip the narrative. Stay flexible, and keep a bias—but not a blind one.
✏️ Disclaimer
This is just my personal viewpoint. Always consult your financial advisor before taking any action.
#Nifty directions and levels for July 22nd:Good morning, friends! 🌞
Here are the market directions and levels for July 22nd:
The global market shows no major changes and continues to maintain a moderately bearish sentiment.
Meanwhile, the local market is exhibiting a moderately bullish tone. Today, Gift Nifty indicates a gap-up opening of around 100 points.
What can we expect today?
In the previous session, both Nifty and Bank Nifty experienced a pullback and managed to sustain it. However, structurally, the trend remains bearish in the lower time frame. So, how should we interpret this sentiment?
1, Since there’s no clear direction, if the market faces rejection initially, we can expect minor consolidation within the 38% Fibonacci range.
2, On the other hand, if it sustains the gap-up and breaks the immediate resistance with a solid structure, we can follow the direction for further upside.
#Nifty directions and levels for July 21st:Good morning, friends! 🌞
Here are the market directions and levels for July 21st:
The global market shows no major changes and continues to maintain a moderately bearish sentiment.
Meanwhile, the local market is exhibiting a bearish tone. Today, Gift Nifty indicates a neutral to slightly gap-down start,
around 30 points negative.
What can we expect today?
In the previous session, both Nifty and Bank Nifty fell sharply. Structurally, the trend remains negative.
However, due to major firms' results, we might see some volatility in the first half, possibly leading to initial speculation.
That said, as per the structure my expectation is a continuation of the correction that's my current view
The alternate view is If the market takes an initial pullback, we could see a 23–38% retracement in the minor swing. Even in this scenario, the bias remains bearish unless the 38% Fibonacci level is broken.
A break above 38% could extend the pullback toward the 50–78% levels.
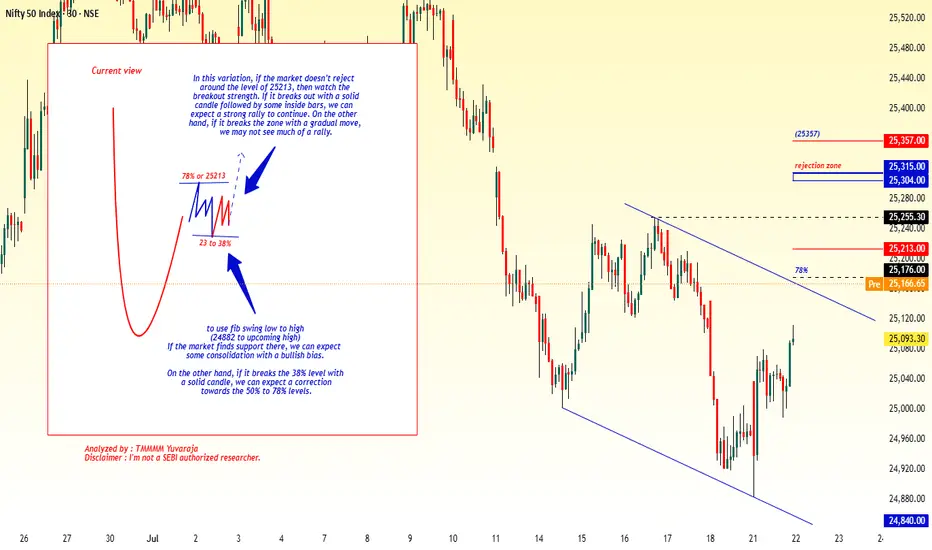
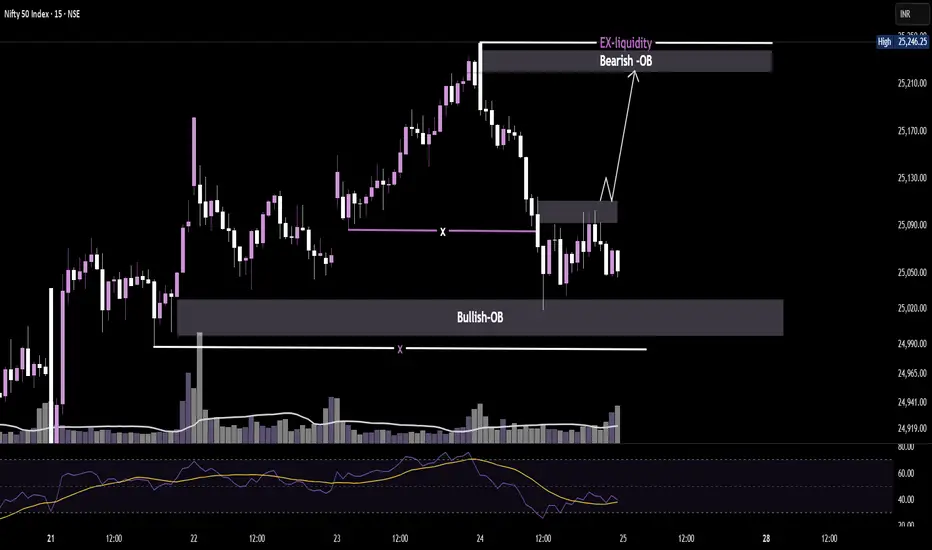
NIFTY 15MIN OB to OB play LoadingPrice tapped a bullish order block, reclaiming structure with volume backing.
Now aiming for the bearish OB + external liquidity above 25,240.
Clean transition zone — watching for rejection or continuation.
Nifty levels - July 25, 2025Nifty support and resistance levels are valuable tools for making informed trading decisions, specifically when combined with the analysis of 5-minute timeframe candlesticks and VWAP. By closely monitoring these levels and observing the price movements within this timeframe, traders can enhance the accuracy of their entry and exit points. It is important to bear in mind that support and resistance levels are not fixed, and they can change over time as market conditions evolve.
The dashed lines on the chart indicate the reaction levels, serving as additional points of significance to consider. Furthermore, take note of the response at the levels of the High, Low, and Close values from the day prior.
We hope you find this information beneficial in your trading endeavors.
* If you found the idea appealing, kindly tap the Boost icon located below the chart. We encourage you to share your thoughts and comments regarding it.
Wishing you success in your trading activities!

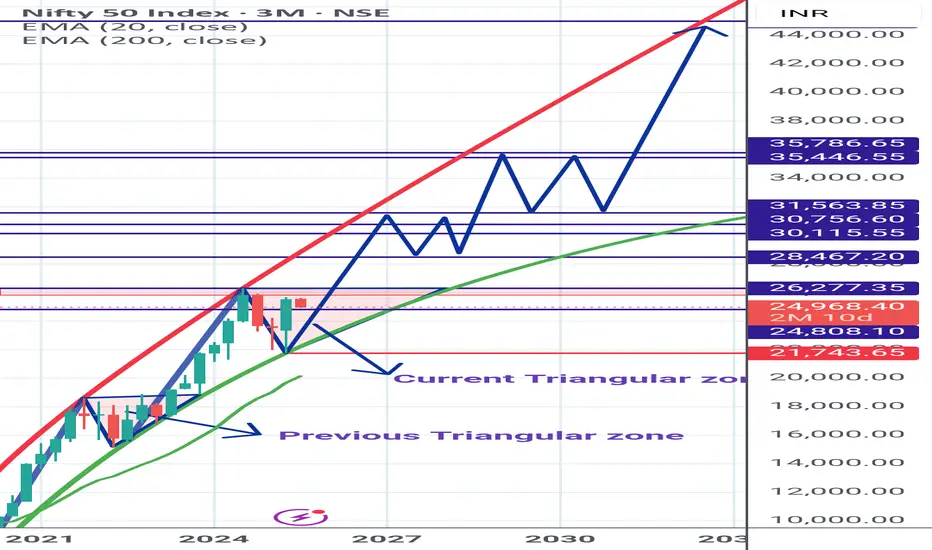
Nifty Spot Longterm View *Nifty Spot* Chart for members Reference.
Currently trading in Parabolic trend and inside Triangular zone.
On closing above the triangular zone, big rally to Begin.
Shared *My Study* based on chart pattern.
Kindly do your analysis from your side too.
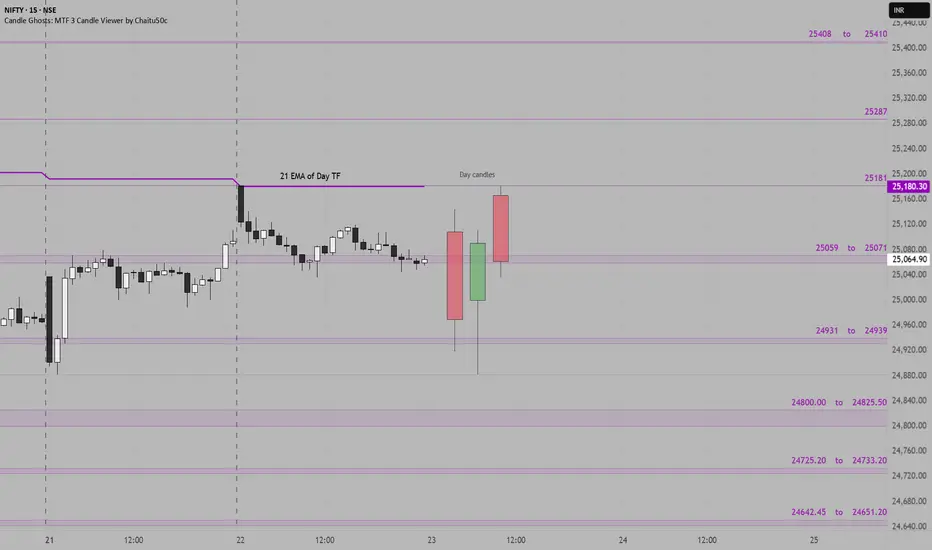
Nifty Support & Resistance Zones for 23rd July 2025The following support and resistance zones have been identified for Nifty based on recent price structure, candle reactions, and high-activity price clusters:
Resistance Zones:
25408 – 25410
25287
25181
25059 – 25071
Support Zones:
24931 – 24939
24800 – 24825.50
24725.20 – 24733.20
24642.45 – 24651.20
Yesterday Nifty formed a strong bullish day candle after testing support near 24800, showing signs of recovery. If the price holds above 25070, we may see a move toward 25181 and possibly 25287.
These levels act as potential zones of reaction and should be used with confirmation via price action or volume triggers during live market.
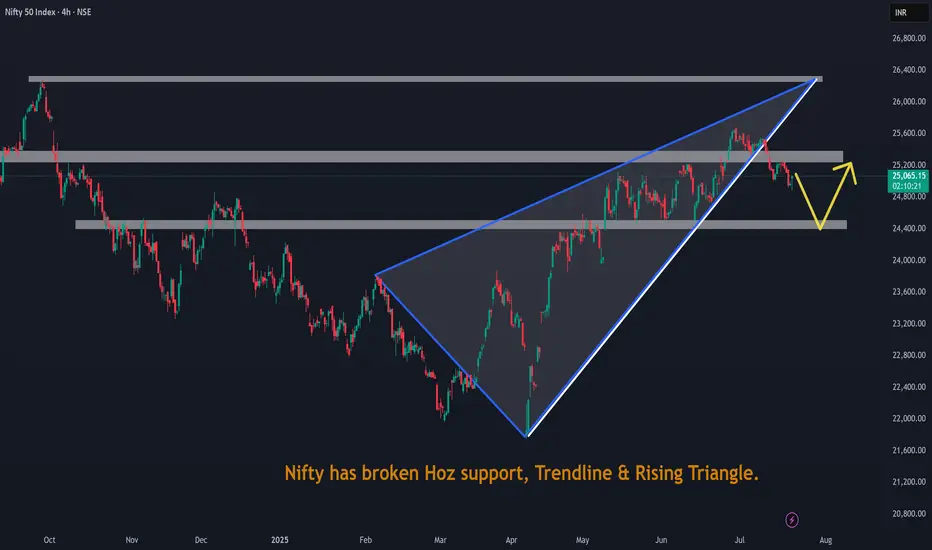
Nifty has broken Hoz support, Trendline & Rising Triangle.Nifty has broken Hoz support, Trendline & Rising Triangle.
NIFTY S/R for 24/7/25Support and Resistance Levels:
Support Levels: These are price points (green line/shade) where a downward trend may be halted due to a concentration of buying interest. Imagine them as a safety net where buyers step in, preventing further decline.
Resistance Levels: Conversely, resistance levels (red line/shade) are where upward trends might stall due to increased selling interest. They act like a ceiling where sellers come in to push prices down.
Breakouts:
Bullish Breakout: When the price moves above resistance, it often indicates strong buying interest and the potential for a continued uptrend. Traders may view this as a signal to buy or hold.
Bearish Breakout: When the price falls below support, it can signal strong selling interest and the potential for a continued downtrend. Traders might see this as a cue to sell or avoid buying.
MA Ribbon (EMA 20, EMA 50, EMA 100, EMA 200) :
Above EMA: If the stock price is above the EMA, it suggests a potential uptrend or bullish momentum.
Below EMA: If the stock price is below the EMA, it indicates a potential downtrend or bearish momentum.
Trendline: A trendline is a straight line drawn on a chart to represent the general direction of a data point set.
Uptrend Line: Drawn by connecting the lows in an upward trend. Indicates that the price is moving higher over time. Acts as a support level, where prices tend to bounce upward.
Downtrend Line: Drawn by connecting the highs in a downward trend. Indicates that the price is moving lower over time. It acts as a resistance level, where prices tend to drop.
Disclaimer:
I am not a SEBI registered. The information provided here is for learning purposes only and should not be interpreted as financial advice. Consider the broader market context and consult with a qualified financial advisor before making investment decisions.

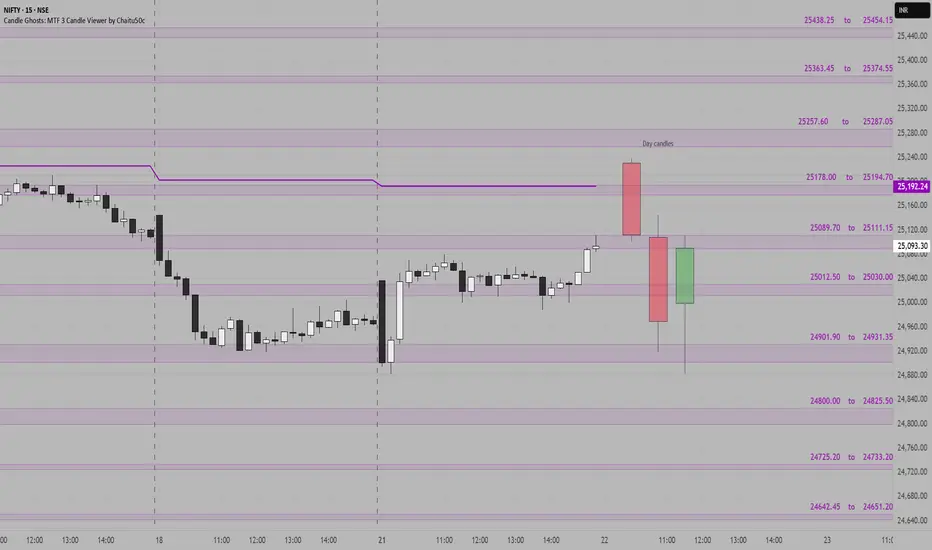
NIFTY SUPPORT & RESISTANCE ZONES FOR 22-07-2025Nifty Support & Resistance Zones for Tomorrow 22-07-2025
Based on price cluster analysis and recent market structure, the following key support and resistance levels have been identified for the upcoming session:
Resistance Zones:
25438.25 – 25454.15
25363.45 – 25374.55
25257.60 – 25287.05
25178.00 – 25194.70
25089.70 – 25111.15
Support Zones:
25012.50 – 25030.00
24901.90 – 24931.35
24800.00 – 24825.50
24725.20 – 24733.20
24642.45 – 24651.20
These levels are derived from high-probability zones where price has shown repeated interaction in the recent past. Watch how Nifty reacts at these zones for potential breakout, reversal, or pullback setups.
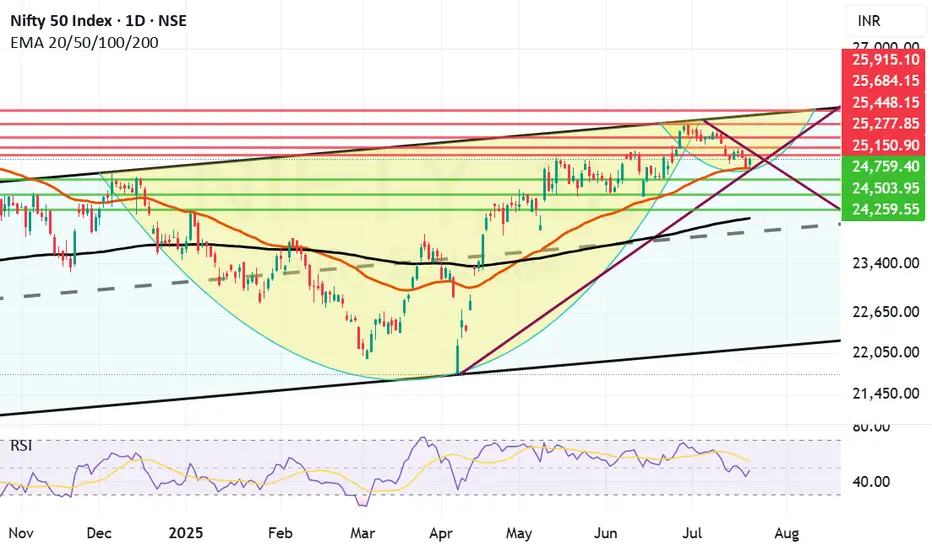
Nifty has taken support at Mother line as expected.Despite poor showing by Reliance post result and TCS continuing to fall Nifty staged a remarkable comeback on the back of Pvt Sector banking which did well. Bank Nifty came back strongly posting 1.19% gains today which enabled Nifty to rise 122 points or 0.49%. Capital Goods, Finance and Metals indices also gained more than 1% each.
Resistances for Nifty now remain at: 25150, 25277 (Trend line resistance), 25448, 25684 and finally channel top resistance at 25915.
Supports for Nifty remain at: 24938 (Mother Line Support of Daily Chart), 24759, 24503, 24259 and finally 24116 (Father Line support of Daily chart).
Shadow of the candle right now is neutral to positive and RSI is 47.63 with median RSI resistance at 54.09.
Disclaimer: The above information is provided for educational purpose, analysis and paper trading only. Please don't treat this as a buy or sell recommendation for the stock or index. The Techno-Funda analysis is based on data that is more than 3 months old. Supports and Resistances are determined by historic past peaks and Valley in the chart. Many other indicators and patterns like EMA, RSI, MACD, Volumes, Fibonacci, parallel channel etc. use historic data which is 3 months or older cyclical points. There is no guarantee they will work in future as markets are highly volatile and swings in prices are also due to macro and micro factors based on actions taken by the company as well as region and global events. Equity investment is subject to risks. I or my clients or family members might have positions in the stocks that we mention in our educational posts. We will not be responsible for any Profit or loss that may occur due to any financial decision taken based on any data provided in this message. Do consult your investment advisor before taking any financial decisions. Stop losses should be an important part of any investment in equity.
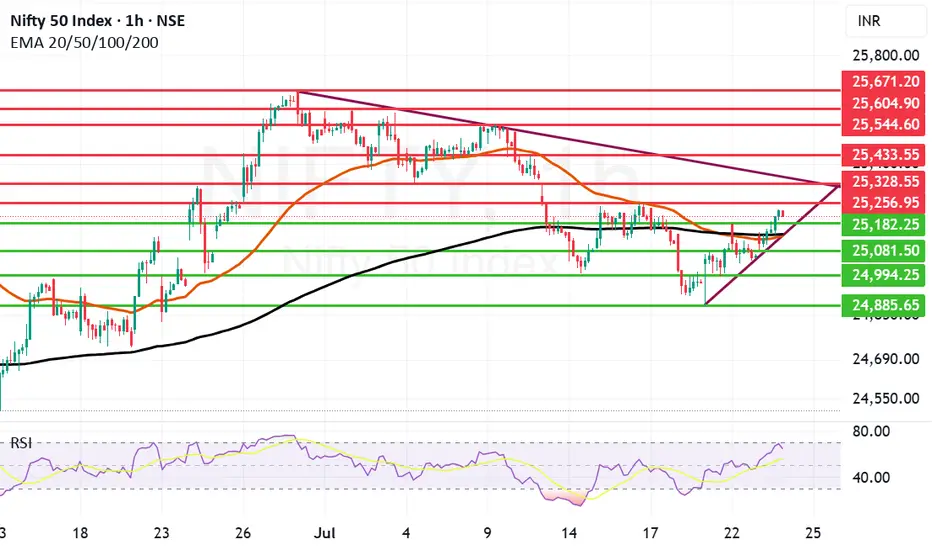
Strong Comeback by Nifty few Resistances ahead.Nifty made a remarkable comeback today ending 159 points up closing at 25219. Infosys has posted better than expected result and as of now the Infosys ADR is up by 1.26%. So if there is a turnaround in the IT sector we can see Nifty fly upwards.
The next resistance ahead of Nifty is at 25256 if we get a closing above this the next will be at 25328. These 2 will be critical resistances to cross. Once we get a closing above 25328 Nifty can target 25433 and 25544. Above 25544 Nifty becomes very strong. In case Nifty is not able to cross 25256 or 25328 levels the supports for Nifty are at 25182. After this zone there is a dual support of Mother and Father line of Hourly chart at 25136 and 25142.
These are very strong supports. (Thus the zone between 25182 to 25136 is full of supports). We hope that these supports are held. In case we get a closing below 25136 Nifty will again fall into bearish territory and can plunge towards 25081, 24994 or even 24885.
The shadow of the candles right now is positive but 2 very important resistances mentioned earlier are yet to crossed so game is in balance but only slightly in favour of Bulls.
Disclaimer: The above information is provided for educational purpose, analysis and paper trading only. Please don't treat this as a buy or sell recommendation for the stock or index. The Techno-Funda analysis is based on data that is more than 3 months old. Supports and Resistances are determined by historic past peaks and Valley in the chart. Many other indicators and patterns like EMA, RSI, MACD, Volumes, Fibonacci, parallel channel etc. use historic data which is 3 months or older cyclical points. There is no guarantee they will work in future as markets are highly volatile and swings in prices are also due to macro and micro factors based on actions taken by the company as well as region and global events. Equity investment is subject to risks. I or my clients or family members might have positions in the stocks that we mention in our educational posts. We will not be responsible for any Profit or loss that may occur due to any financial decision taken based on any data provided in this message. Do consult your investment advisor before taking any financial decisions. Stop losses should be an important part of any investment in equity.
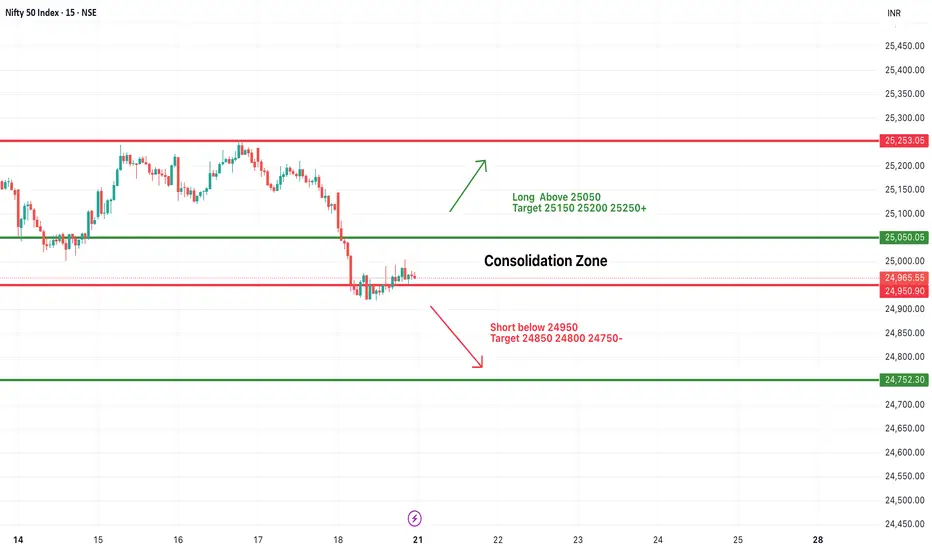
#NIFTY Intraday Support and Resistance Levels - 21/07/2025Nifty is likely to start the day with a flat opening, as current price action is indicating a consolidation phase near the lower range. The zone between 24,950–25,050 is acting as a key area of indecision, where prices are stuck in a tight range, showing a lack of clear momentum. This consolidation could lead to a breakout or breakdown depending on how the index reacts at key levels.
If Nifty sustains above 25,050, it may trigger a short-term upward move, breaking the consolidation phase. In such a scenario, an upside rally towards 25,150, 25,200, and 25,250+ levels can be expected, making it a favorable long setup for intraday traders.
On the contrary, if the index slips below 24,950, the selling pressure may increase, and downside momentum can accelerate. A breakdown here could pull the index towards support levels of 24,850, 24,800, and even 24,750-, which would confirm bearish strength.
Traders are advised to avoid aggressive positions within the consolidation zone and wait for a breakout or breakdown for directional trades. Quick entries with partial profit booking at every level and strict stop-losses are recommended to manage risk efficiently in today’s range-bound environment.
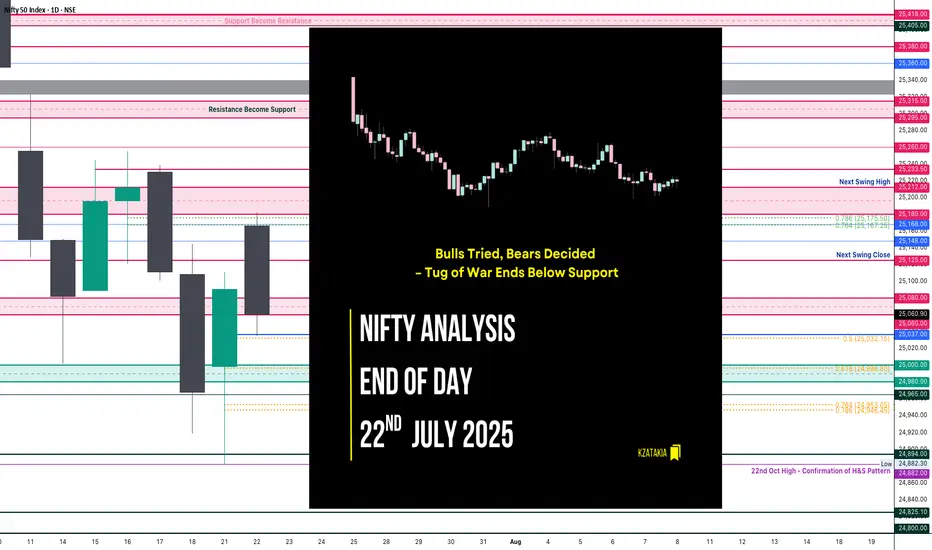
Nifty Analysis EOD – July 22, 2025 – Tuesday🟢 Nifty Analysis EOD – July 22, 2025 – Tuesday 🔴
"Bulls Tried, Bears Decided – Tug of War Ends Below Support"
Nifty opened with an 88-point gap-up, continuing the bullish sentiment, right at the resistance zone of 25,180 ~ 25,212. However, the market opened at the high (OH) and quickly slipped around 100 points to form the Initial Balance (IB). After a brief bounce back to the mean, it faced resistance, leading to a breakdown of IB and further losses of 77 points.
A supportive bounce emerged near 25,060 ~ 25,080, but the price was pushed down again by PDH + VWAP + R1. The day closed below PDC and under the support zone at 25,065, showing bearish dominance despite a volatile tug-of-war between bulls and bears.
Today’s low tested the 0.5 Fibonacci retracement level (from yesterday’s low to today’s high). If this is truly a retracement, 25K must hold in upcoming sessions, and bulls will need to reclaim 25,200 to regain their grip.
🕯 5 Min Time Frame Chart with Intraday Levels
🕯 Daily Time Frame Chart with Intraday Levels
📊 Daily Candle Breakdown
Open: 25,166.65
High: 25,182.00
Low: 25,035.55
Close: 25,060.90
Change: −29.80 (−0.12%)
Candle Structure:
Real Body: Red (−105.75 pts) → Decent bearish body
Upper Wick: 15.35 pts → Small
Lower Wick: 25.35 pts → Moderate
Interpretation:
Price opened strong but faced selling near 25,180, leading to a steady drop throughout the session. The lower wick shows some buying attempt near 25,035, but the close below open signals bears dominated.
Candle Type:
Bearish candle with moderate lower wick – resembles a Bearish Engulfing setup after a green candle, suggesting profit-booking or fresh selling.
Key Insight:
Sellers defending 25,180–25,200 firmly
Holding above 25,030–25,050 is critical; breaking this could retest 24,950–25,000
Bulls must reclaim 25,120–25,150 for momentum revival
🛡 5 Min Intraday Chart
⚔️ Gladiator Strategy Update
ATR: 182.32
IB Range: 92.6 → Medium
Market Structure: Balanced
Trades Triggered:
10:45 AM – Short Trade → Trailing SL Hit (1:0.8)
12:45 PM – Long Trade → SL Hit
📌 Support & Resistance Levels
Resistance:
25,080 ~ 25,060
25,125
25,168
25,180 ~ 25,212
Support:
25,037
25,000 ~ 24,980
24,965
24,894 ~ 24,882
24,825
24,800 ~ 24,768
🧠 Final Thoughts:
"Markets often dance between zones of power — where bulls flex and bears press. It's not chaos, it's the choreography of sentiment."
The 25,000–25,212 zone continues to be the battlefield. Let’s see who seizes the upper hand tomorrow.
✏️ Disclaimer:
This is just my personal viewpoint. Always consult your financial advisor before taking any action.
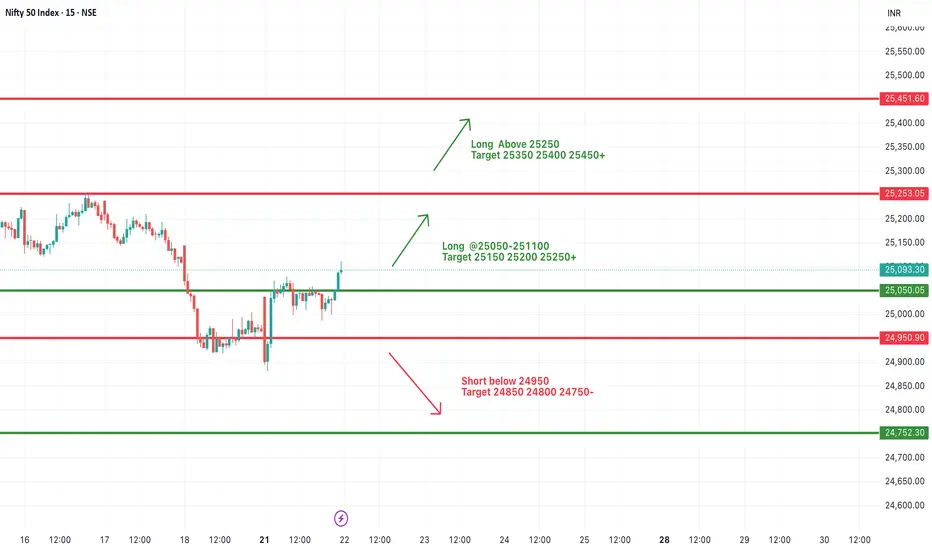
#NIFTY Intraday Support and Resistance Levels - 22/07/2025Today, Nifty is expected to open slightly gap-up, indicating positive early sentiment. After breaking out from the previous day’s consolidation zone, the index has shown strength around the 25,050 level, which will now act as an important intraday support. If this level is held during the early session, we can expect further upside continuation.
A move above the 25,050–25,100 zone can trigger upward momentum with potential targets at 25,150, 25,200, and 25,250+. Sustained strength above 25,250 will open the door for further bullish moves toward 25,350, 25,400, and 25,450+, making it a favorable long scenario for trending market conditions.
However, if the index fails to hold above the 25,050 level and starts trading back below 24,950, it may again enter a bearish territory. In such a case, downside targets of 24,850, 24,800, and 24,750- are possible, indicating weakness and reversal from resistance.
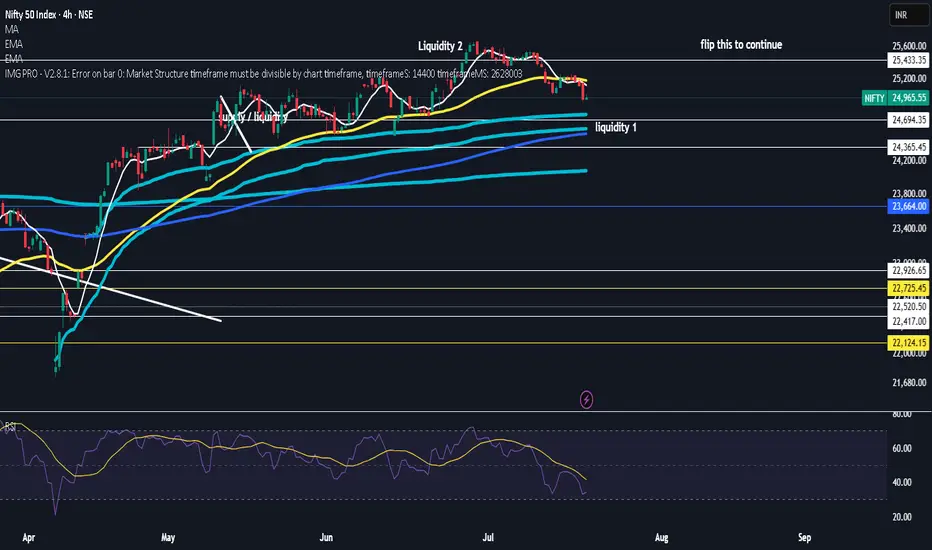
$nifty50took first liquidity and deviated back
now we take liquidty under vwap or not but good spot to reverse here
ATH incoming
rsi looks nice and reset
wont be suprized if we range here for a bit before blasting through
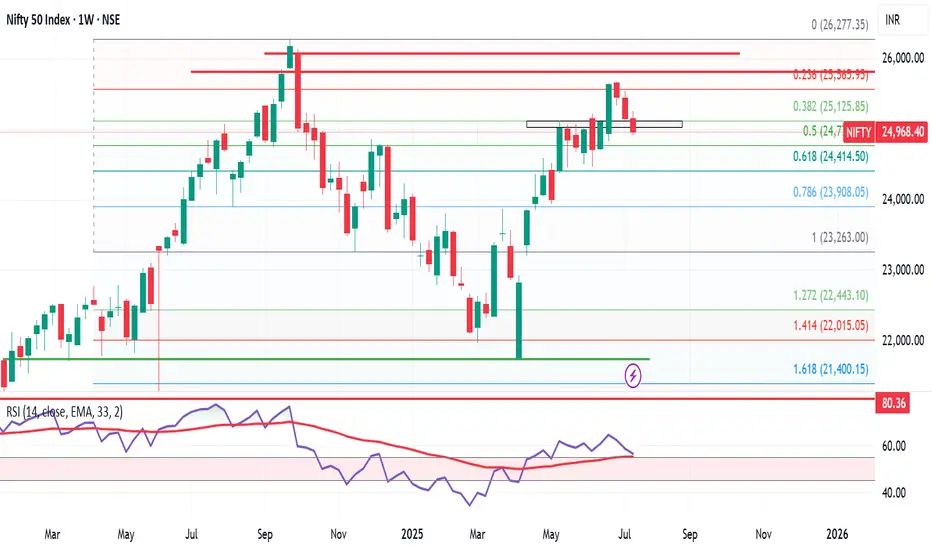
Wkly Market Wrap: Nifty Under Pressure, S&P 500 Hits Record HighThe Nifty 50 closed the week at 24,968, down 180 points from the previous week's close. It traded within a tight range, posting a high of 25,255 and a low of 24,918—perfectly aligning with the range I’ve been tracking between 25,600 and 24,700.
As I’ve been highlighting over the past few weeks, the monthly chart continues to show weakness, and now even the weekly chart is starting to reflect bearish signals. This growing weakness is a notable concern.
What to Watch for Next Week:
If Nifty sustains above 25,100, we could see a potential rebound toward the 25,400–25,450 resistance zone.
However, a breakdown below this week's low of 24,918 opens the door to a retest of key support near 24,500.
What’s interesting is that, despite Nifty’s indecision, the number of bullish stocks on the monthly time frame has increased significantly. Last week, there were 18 such stocks on my radar; now that number has jumped to 26, even after excluding about 10 others that showed bullish patterns but had high volatility.
This divergence—index showing weakness while quality stocks turn bullish—could indicate a possible bear trap being set by institutional players. If true, we might see a sharp short-covering rally after a final shakeout.
Nifty Outlook:
For the upcoming week, I expect Nifty to remain range-bound between 25,400 and 24,500. A decisive breakout or breakdown from this range could lead to sharp directional movement, so traders should stay alert.
Global Markets: S&P 500 Soars to New Highs
The S&P 500 closed at a record high of 6,296, with a weekly high of 6,315 and low of 6,201. The index remains in strong uptrend mode.
A breakout above 6,315 could see it testing 6,376, 6,454, and potentially 6,500 in the coming sessions.
My next major Fibonacci target is 6,568.
As long as 6,149 holds on a weekly closing basis, I continue to view every dip as a buying opportunity.
Final Thoughts:
The Indian markets are sending mixed signals, with the broader index showing caution while individual stock strength is quietly building. This divergence warrants a tactical approach—stay nimble, respect levels, and be ready for sharp reversals or breakouts.
Next week could be crucial. Stay focused, stay disciplined.
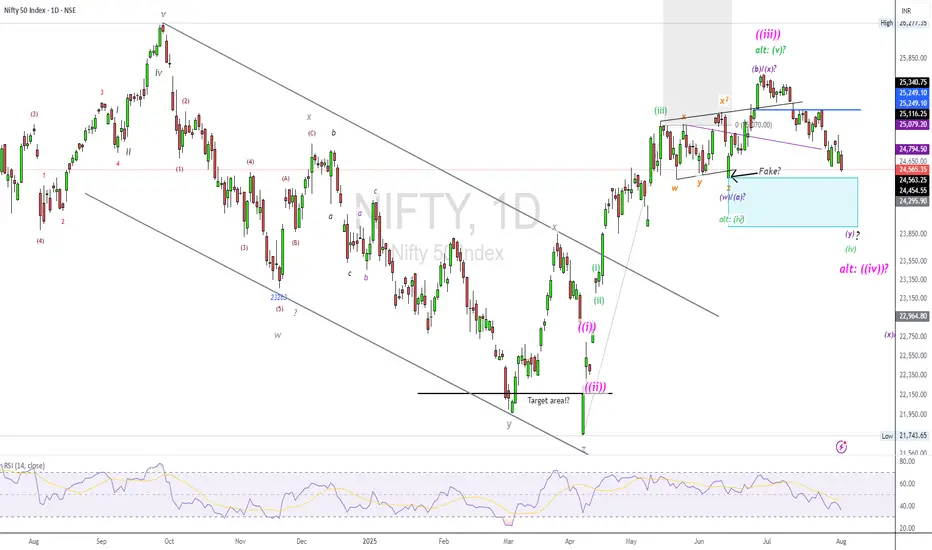
NIFTY50.....Miss a final sell-off! Part IIHello Traders,
the NIFTY50 is on track with my forecast! It declined over the course of the week to a level of 24565 points - a loss of almost 271 points, (nearly 1.09%).
The question is, if N50 is declining lower in the coming week. The question is, to what degree will it decline ?
Chart analysis:
Today, I'd like to show you another idea of the count. Here, at the level of 25669, a wave (v), green, has been established, and the following correction is a wave (iv), pink, to the level I have mark with the sky blue rectangle. This rectangle ranges from 24473 to 23934.90. If we reach these levels, wave (iv), whether of wave ((iv)) or wave (iv), should end!
In either case, there is more downside potential and has more room to go, and is not finished yet.
The first sign, that something went wrong would be at the point, when the high @ 23368, wave (i), green, were to be touched! This is because it is not permitted for a wave (iv) to touch the high of any degree of wave (i).
The indicators, too, have much room to decline for the rest of the week.
So, it will be exiting to watch how the market will makes its decision.
Have a great weekend.....
Ruebennase
Please ask or comment as appropriate.
Trade on this analysis at your own risk.
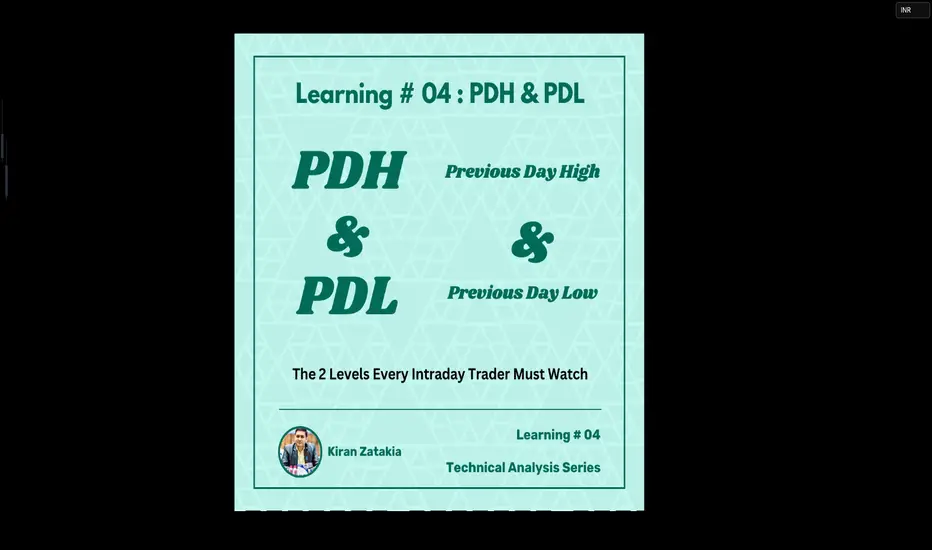
Learning#04 : PDH & PDL🎯 Learning#04 : PDH & PDL
- The 2 Levels Every Intraday Trader Must Watch
Turn Yesterday’s Levels into Today’s Profits – PDH/PDL Playbook
In intraday trading, simplicity often beats complexity.
You don’t always need fancy indicators, dozens of lines, or complicated systems. Sometimes, two levels are all it takes to stay in sync with the market:
👉 Previous Day’s High (PDH)
👉 Previous Day’s Low (PDL)
These levels may look basic, but they carry psychological weight and often mark where real action — and opportunity — unfolds.
Let’s break it down into a practical strategy you can start using as early as tomorrow morning 👇
🧠 What Are PDH and PDL?
PDH = The highest price the market reached yesterday
PDL = The lowest price the market reached yesterday
That’s it. No calculations. No indicators. Just two simple levels from the previous session.
But here’s why they matter:
They’re visible to everyone — retail traders, institutional desks, even algo systems. These are “memory zones” where the market often reacts — bouncing, breaking, or trapping traders in fakeouts.
Think of them as psychological boundaries.
When price approaches these levels, traders ask:
“Will it break or bounce?”
That hesitation — that moment of decision — is your opportunity.
⚡ Why These Levels Work So Well
✅ They’re objective — no subjectivity involved. Anyone can mark them.
✅ They’re reaction zones — price often stalls, breaks, or rejects here.
✅ They reflect sentiment — how price behaves around them reveals market strength or weakness.
PDH and PDL often act like turning points — or springboards for continuation. The key is in reading how price behaves when it gets there.
📊 3 Smart Ways to Trade Around PDH/PDL
Let’s look at three powerful setups based on how price behaves near these levels:
1️⃣ Rejection at PDH or PDL (Classic Reversal)
This is the simplest setup — and one of the most effective.
When price tests PDH or PDL but fails to break, it often leaves signs:
Long upper/lower wicks
Rejection candles (like pin bars or inside bars)
Sudden volume drop
💡 Example:
Nifty rallies to PDH at 22,180, prints a long upper wick, then forms a red candle closing below. That’s a reversal clue.
You could enter short below the rejection candle, with a stop just above the high and a target near VWAP or mid-range.
🎯 Why this setup works: Tight risk. Logical context. High clarity.
2️⃣ Breakout and Retest (Trend Continuation)
If price breaks through PDH/PDL with strength, don’t chase it.
Wait for price to pull back and retest the level.
If PDH was broken, wait for a bullish retest — former resistance becomes support.
If PDL was broken, wait for a bearish retest — former support becomes resistance.
💡 Example:
BankNifty breaks PDH, pulls back, then prints a bullish engulfing candle right at the level — confirmation to go long.
📌 This setup works best on trending days and offers cleaner entries than chasing breakouts.
3️⃣ The Failed Breakout (Trap Setup)
One of the most high-probability setups — and one that traps many.
Here’s how it plays out:
Price breaks PDH/PDL
But immediately snaps back inside the range
Traders who chased the breakout are now trapped
💡 Signal to watch:
A candle closes above PDH, followed by a candle that closes back below — that’s your short signal. Reverse for long setups around PDL.
🚨 Even more effective when the breakout happens on low volume — no real conviction behind the move.
🔧 Tools That Amplify These Setups
These setups work great with a clean chart — but a few tools can boost your edge:
VWAP: Check if price is extended or supported near PDH/PDL. When VWAP aligns with these levels — confluence zone!
Candlestick patterns: Look for pin bars, inside bars, or engulfing patterns at the level.
Opening range: If price breaks PDH/PDL early in the day,
especially within the first 30 minutes, it signals directional intent.
Volume: Strong breakouts need volume. Weak volume = likely fakeout.
🔑 Remember: You don’t trade the level — you trade the reaction at the level.
✅ Why This Simple Strategy Works
Don’t underestimate the power of PDH and PDL. These levels:
Show where emotions exist — greed and fear often play out here.
Create natural reaction zones — ideal spots for clean entries and exits.
Let you trade with structure, not guesswork.
Instead of chasing price all day, do this:
Mark PDH and PDL
Wait for price to approach the zone
Watch how it behaves
React with a plan — not emotion
✨ Simple, repeatable, and highly effective — if you stay patient and disciplined.
✍️ Final Thoughts
In a world full of overcomplicated strategies, PDH/PDL trading is a refreshing reminder that clarity often comes from simplicity.
These levels won’t give you 10 trades a day — but they will give you high-quality, context-driven opportunities that align with how real price and volume work.
See you in the next one — and until then:
Keep it simple. Trade with structure. Trust the levels.
— Kiran Zatakia