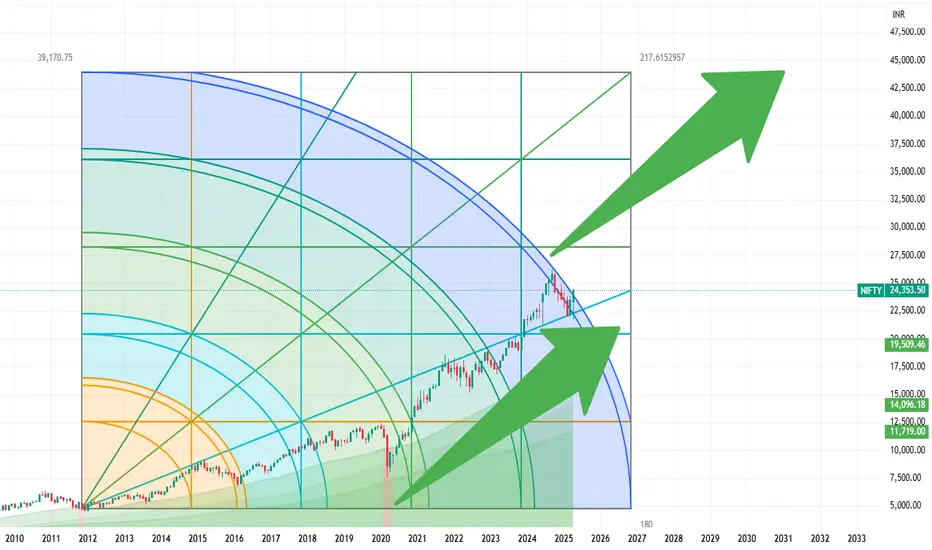
Nifty Momentum may lead it to 44000 levelNifty monthly chart is showing a rapid growth since last 5 years, this momentum may lead it to these levels 28000, 36000 and 44000 levels.
NIFTY trade ideas
#Nifty 30th April levels checkout is levels #Nifty 30th April levels checkout special my levels
100 percent working levels and giving weekly levels also
check and tell everyone
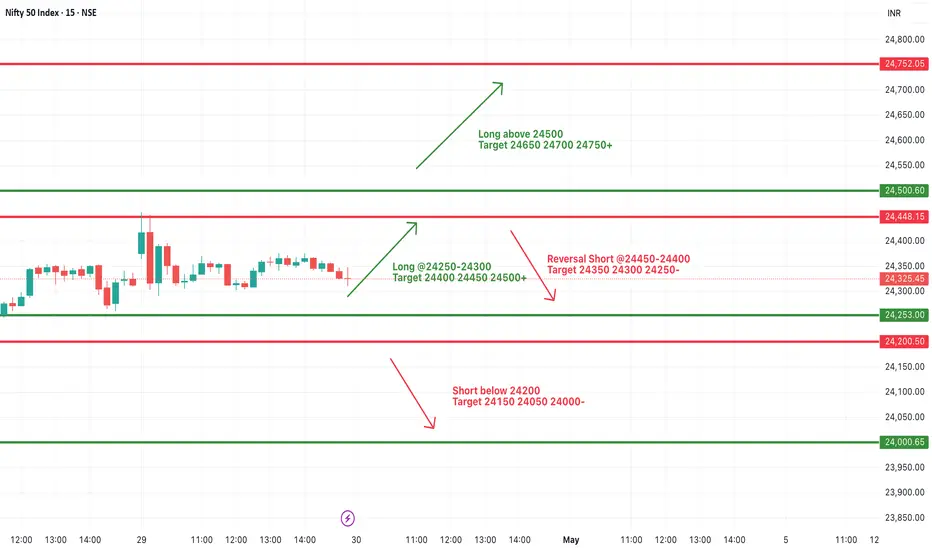
#NIFTY Intraday Support and Resistance Levels - 30/04/2025Gap up opening expected in nifty near 24450 level. Currently nifty consolidating in the range of 24250-24500 level. After opening if nifty starts trading and sustain above 24500 level then possible strong upside rally towards the 24750+ level in today's session. 24250 level will act as a strong support for today's session. Any major downside only expected if nifty starts trading below 24200 level. This downside can goes upto 24000 level.
Nifty Trend directtionNifty 24335 has DAY resistance at 24560 and Support at 24070.
Intraday Resistance at 23449.
As Nifty has closed below the resistance we expect Nifty to go down by 200 points
Gap up entry ruined the structure! What’s next!?As we can see the strong opening ruined the head and shoulders structure and couldn’t continue its uptrend and fell unidirectionally and later continuing sideways. Now we can expect NIFTY to again test the neckline before finally breaking out for unidirectional move so plan your trades accordingly and keep watching

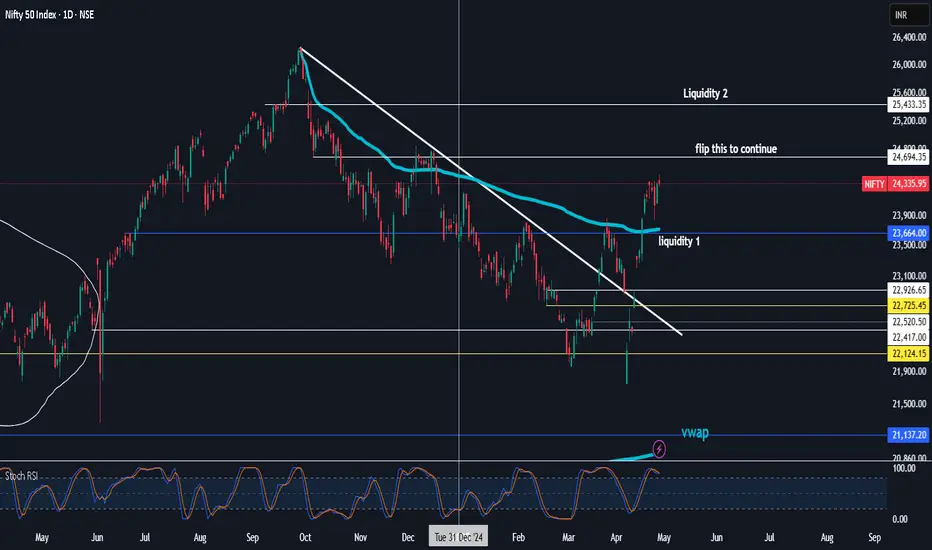
$NIFTY50back to reality and as expected nifty has bounced nicely
was thinking we go take liquidity1 below vwap first then go for the equal highs
looks like it wants 24694 liquidity first
plan is to risk off around liquidty 2 level since have been 90% in equity so would ike to free up some cash/ammo
acceptance below blue line then we likely go for vwap below
Nifty --->> downside towards 24,250 and 24,000 levels ??Today, Nifty marked an intraday high of 24,570 during the morning session and did not retest or offer any significant retracement thereafter.
The index has breached the white support trendline, indicating the potential for further downside towards 24,250 and 24,000 levels. With the market closed on May 1st, Nifty may remain range-bound with a negative bias in the coming session.

Nifty Analysis EOD - April 29, 2025🟢 Nifty Analysis EOD - April 29, 2025🔴
One more day passed under uncertainty... Indecision takes the driver’s seat.
📈 Market Summary
Nifty opened on a positive note at 24,370, gaining 42 points, and swiftly climbed to an intraday high of 24,457.65. But the enthusiasm didn’t last long — sellers stepped in and pushed it down, filling the opening gap. The index found support near 24,290, and attempted a bounce, but once again failed to clear the critical 24,330–24,360 resistance zone.
📌 Intraday 5 Min Time FrameChart
The rest of the session saw price action trapped within a narrow 70-point range — a frustrating day for breakout traders or option buyers.
🔹 Impatient option buyers may have been trapped, stuck in hopes of a breakout.
🔹 Patient traders probably stayed away.
🔹 Scalpers and option sellers — this was your playground today.
📌 75 Min Time FrameChart
On the 75-minute chart, once again, rejection is clearly visible from the 24,330 ~ 24,360 zone. Until we see a decisive close above 24,365, this zone will continue to command respect in our trade plans.
📌 Daily Time Frame Chart
🕯 Daily Candle Structure
Candle Type: Spinning Top — a classic indecision candle
OHLC:
Open: 24,370.70
High: 24,457.65
Low: 24,290.75
Close: 24,335.95
Change: +7.45 points (+0.03%)
🔍 Candle Breakdown:
Real Body:
Small red body of -34.75 pts (close < open) → Indicates lack of strong directional move.
Upper Wick: 86.95 pts
Lower Wick: 79.95 pts
This candlestick reflects market hesitation, especially significant after a strong uptrend. Bulls and bears fought for control, but neither side won convincingly.
🧠 What the Spinning Top Tells Us:
Appears after a strong move → Suggests loss of momentum or possible pause
Small body + long wicks = Indecision
Needs confirmation in the next session
🔮 What Next?
Today’s spinning top doesn’t give a clear directional cue. However, context matters:
A close above CPR and previous session tilts the bias slightly bullish.
Bullish scenario: A breakout above 24,460 may resume the upward trend.
Bearish scenario: A breakdown below 24,040 could open the door for a pullback.
As always — trade with preparation, not prediction.
⚔️ Gladiator Strategy Update
ATR: 326.39
IB Range: 166.9 (Medium IB)
Market Structure: Imbalanced
Trade Highlights:
Positional Trade: Long Triggered Yesterday 15:20 – 1:2 Target Achieved
Intraday: No trade triggered during the session
📈 Index Performance Snapshot
Nifty 50: +7 Points (+0.03%)
Bank Nifty: -42 Points (-0.07%)
Nifty 500: +11 Points (+0.05%)
Midcap: +148 Points (+0.27%)
Smallcap: +62 Points (+0.37%)
🔍 Key Levels to Watch
🛑 Resistance Zones:
24,330 ~ 24,360 (Immediate hurdle)
24,457 (Today’s High)
24,480 ~ 24,540 (24,500 psychological level inside this zone)
24,800
🛡 Support Zones:
24,290 (Today’s Low)
24,190 ~ 24,225 (Immediate support)
24,120
24,050
24,000 ~ 23,950
23,820
23,710 ~ 23,660
23,500
23,410 ~ 23,370
23,215
💭 Final Thoughts
Another day where the market teased both bulls and bears alike. But remember — uncertainty is not your enemy; it’s your signal to slow down. When the candle speaks in spinning tops, the trader listens in silence. Discipline and patience are still your best tools, especially when the market isn't shouting direction clearly.
Tomorrow is the Weekly expiry — so prepare for volatility and don’t let noise disrupt your clarity. Your trade setup is your edge — trust it.
✏️ Disclaimer:
This is just my personal viewpoint. Always consult your financial advisor before taking any action.

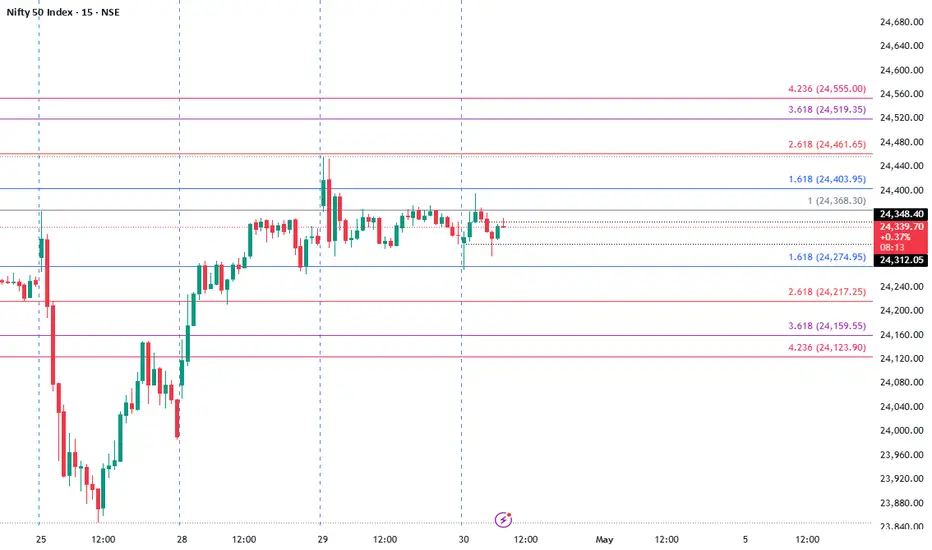
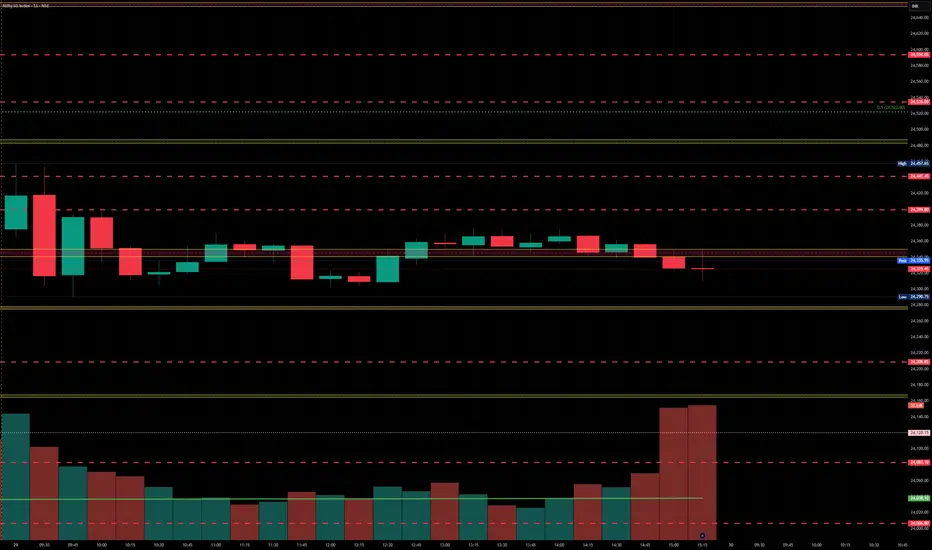
Nifty levels - Apr 30, 2025Nifty support and resistance levels are valuable tools for making informed trading decisions, specifically when combined with the analysis of 5-minute timeframe candlesticks and VWAP. By closely monitoring these levels and observing the price movements within this timeframe, traders can enhance the accuracy of their entry and exit points. It is important to bear in mind that support and resistance levels are not fixed, and they can change over time as market conditions evolve.
The dashed lines on the chart indicate the reaction levels, serving as additional points of significance to consider. Furthermore, take note of the response at the levels of the High, Low, and Close values from the day prior.
We hope you find this information beneficial in your trading endeavors.
* If you found the idea appealing, kindly tap the Boost icon located below the chart. We encourage you to share your thoughts and comments regarding it.
Wishing you success in your trading activities!
Nifty 50 Option Traders carefulAll Nifty 50 Option trader be very very careful while getting into Trade. Nifty 50 is making bigger moves but Gift nifty is not moving equivalent to the movement of Nifty 50, so when you enter trade looking at nifty 50 high chances of you are entering the Option Strike at wrong price. Option moves based on Gift Nifty and not Nifty 50 chart.

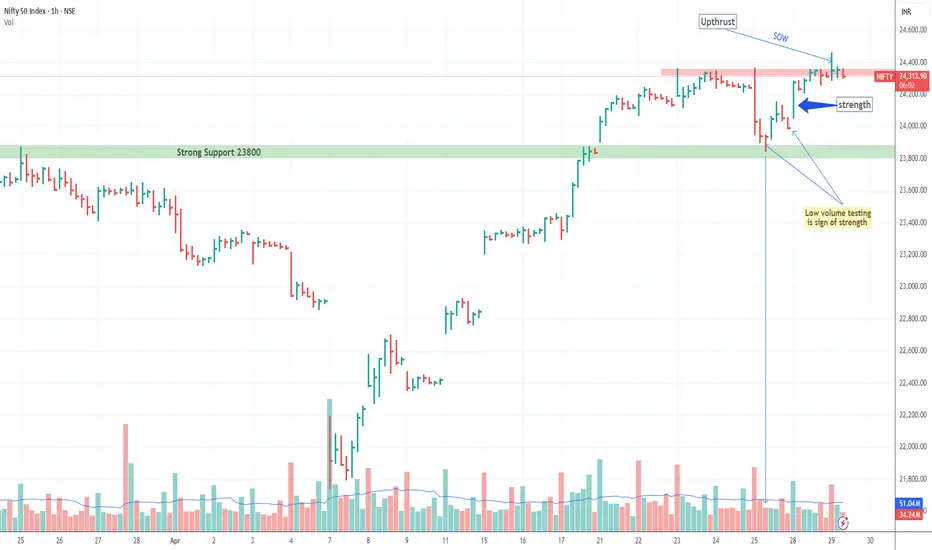
is selling being absorbing near 23350 level ?yesterday 27 April I mentioned that nifty must have to break & sustained 23350 level it happened today but long upper wick on hourly time with high volume been noticed showing selling pressure in market of course market bullish momentum still intact it respected the near 23800 level trading above 20 EMA but we need to wait more multiple testing for confirmation to continue upside journey so consolidation may happen in 2-3 days.
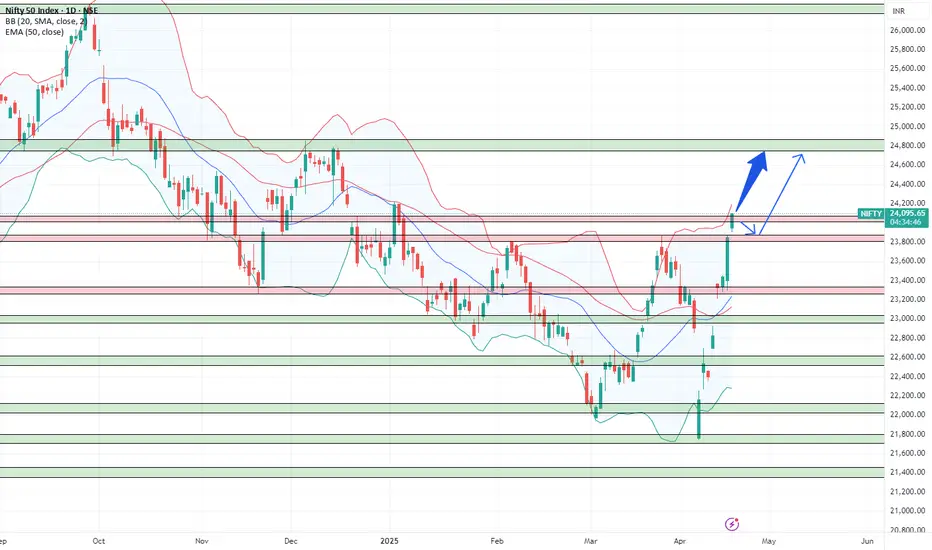
Nifty movement this weekThe arrow in the image points to a potential upward movement of the NIFTY index after it bounced off a support level. To provide detailed resistance and support levels specifically for this indicated movement, we need to analyze the chart around that area.
Based on the provided chart:
Support:
The most immediate support that facilitated the bounce is around the 23,800 level. This is where the price found buying interest and reversed its downward trend.
A further significant support level can be seen near 23,600. This level acted as resistance previously and now could act as support.
Resistance:
The immediate resistance that the price might encounter as it moves upwards is around the 24,200 level. This level aligns with a previous swing high and could present a hurdle for further upward movement.
A more significant resistance zone appears to be around the 24,500 - 24,600 area. This zone has acted as a strong resistance in the past, as indicated by the horizontal lines on the chart.
Therefore, for the upward movement indicated by the arrow:
Immediate Support: ₹23,800
Next Support: ₹23,600
Immediate Resistance: ₹24,200
Stronger Resistance Zone: ₹24,500 - ₹24,600
It's important to remember that these levels are based on the information visible in this specific chart and market conditions can change.
#NIFTY Intraday Support and Resistance Levels - 29/04/2025Gap up opening expected in nifty near 24450 level. After opening if nifty starts trading and sustain above 24500 level then possible strong upside rally towards the 24750+ level in today's session. Any downside or reversal expected near 24450 level. Downside 24250 level will act as a strong support for today's session.

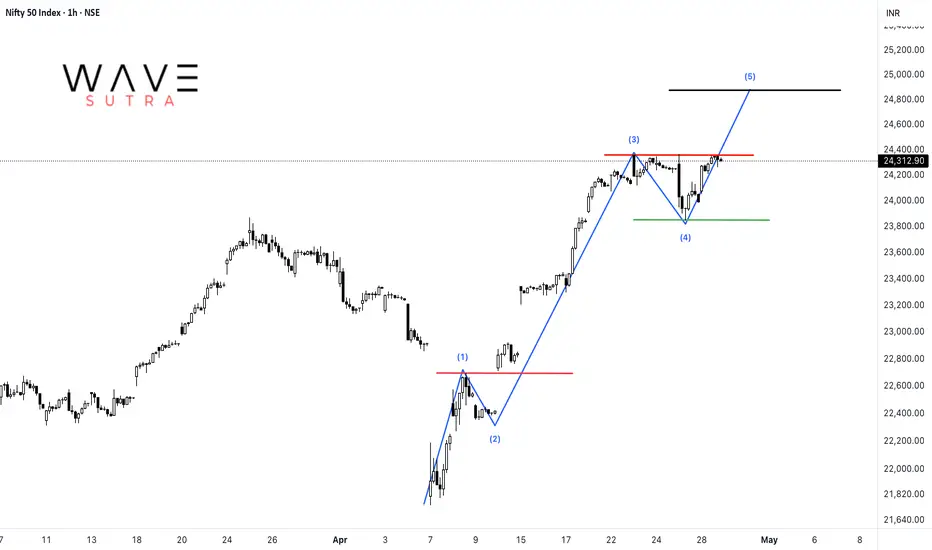
NIFTY: Impulse formationNifty is rising in an impulsive manner of which 4th wave is already concluded at 23847 zone and currently trading under wave-5. This shall take the index towards 24875 zone where wave-5 becomes equal to wave-1.
Forming INVERTED H&S pattern in smaller time frame! As we can see NIFTY recovered strongly influenced by RIL result but we are still weak below the supply zone hence unless the high is broken every rise can be sold unless the high the broken then a strong uptrend can se been in NIFTY as it can be seen forming an inverted head and shoulders pattern and its neckline has been tested multiple times now hence any closing above the given structure could show unidirectional rally so plan your trades accordingly and keep watching.
Nifty Elliott wave update for 29april Tuesday onwardsIn this Video I have explained Elliott wave analysis of Nifty on 3hour, 15 min chart and 5min chart in detail to conclude what are the possible scenarios possible in Nifty index from 29april Tuesday onwards.... Kindly watch full video for detail understanding. It will help you to understand how to use Elliott wave theory practically on charts.
Thank you for watching....

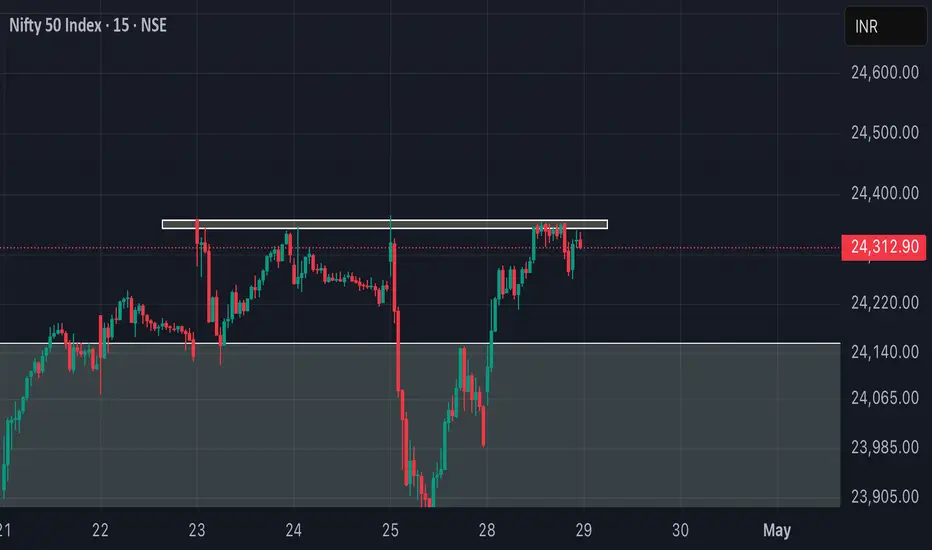
Nifty break 24210 or @ brekout Many traders were expecting a market fall — a small correction in Nifty — but as usual, it moved towards Friday’s high.
On the chart, strong support is seen around 24,210.
If 24,210 breaks, a good retracement can be expected.
If today’s high is broken, the next level could be around 24,600.
Nifty on the verge of Trendline Breakout. There is a major possibility of a Trendline Breakout amidst the rumblings on conflict with enemy nations. The main reason for Market rally today was Superb results posted by Reliance and a rally in PSU, Capital goods and defense related stocks. A lot of stocks that were oversold in the knee-jerk reaction on Friday also tried to catch-up. As the situation on the border remains tense we can have a sudden major decline as a reaction to the Geo-Political proceedings. Thus investors are asked to remains cautious and not to carry heavy derivative positions overnight. Even in the eventuality of a war actually happening one think of remaining invested in companies that can bounce back faster once the situation de-escalates.
Major Supports for Nifty on daily chart now remain at: 23988, 23708, 23415 (Major Father line support), 23325 (Major Mother Line Support) in case of Mother and Father line failing Bears can drag Nifty further down to 22875, 22142 and 21844.
Major Resistances For Nifty remain at: 24359 (Major Trend line resistance), 24538, 24816 (Is another major resistance on Fibonacci scale), If we get a closing above 24816 Nifty can easily flow towards 25183, 25399 and 25603.
Disclaimer: The above information is provided for educational purpose, analysis and paper trading only. Please don't treat this as a buy or sell recommendation for the stock or index. The Techno-Funda analysis is based on data that is more than 3 months old. Supports and Resistances are determined by historic past peaks and Valley in the chart. Many other indicators and patterns like EMA, RSI, MACD, Volumes, Fibonacci, parallel channel etc. use historic data which is 3 months or older cyclical points. There is no guarantee they will work in future as markets are highly volatile and swings in prices are also due to macro and micro factors based on actions taken by the company as well as region and global events. Equity investment is subject to risks. I or my clients or family members might have positions in the stocks that we mention in our educational posts. We will not be responsible for any Profit or loss that may occur due to any financial decision taken based on any data provided in this message. Do consult your investment advisor before taking any financial decisions. Stop losses should be an important part of any investment in equity.

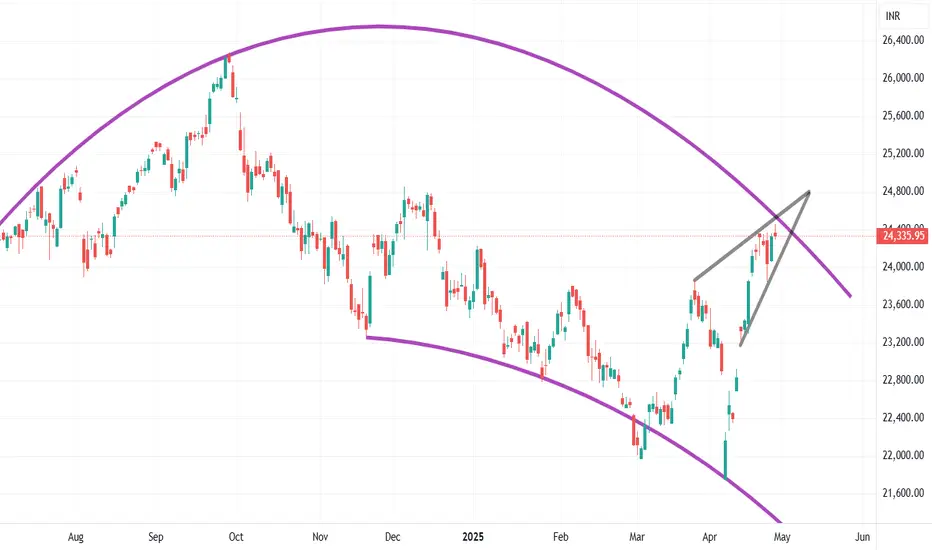
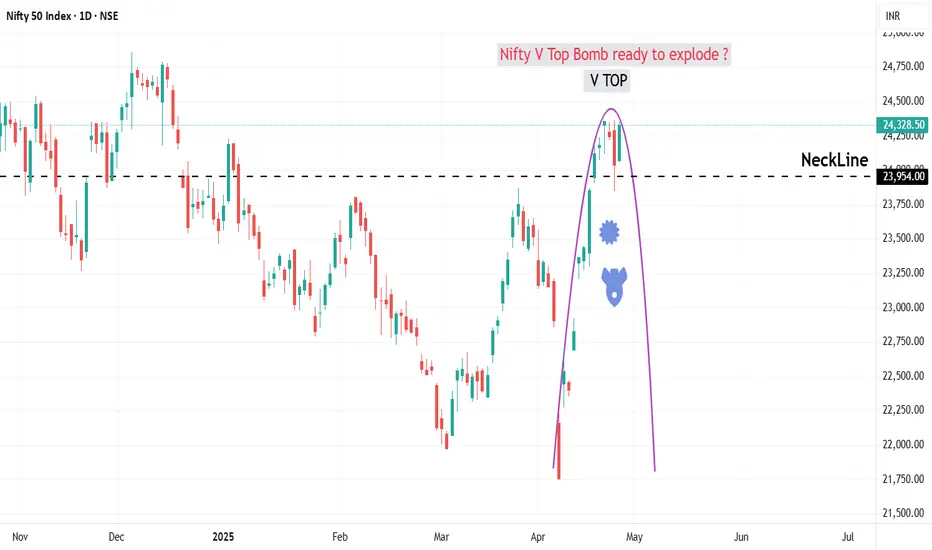
Nifty V Top ready to explode ?Nifty 24328 has given a V Top Pattern which is a reversal pattern. Neck Line is at 23960.
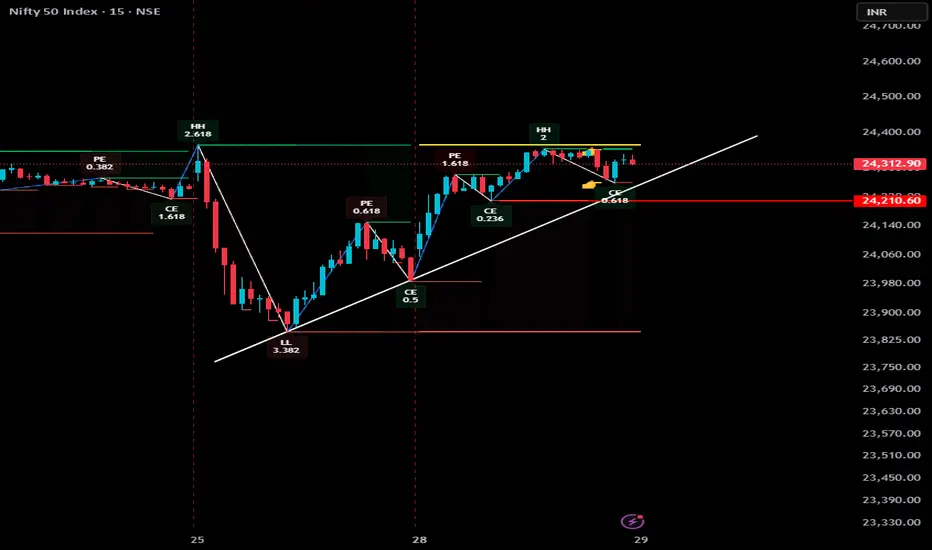
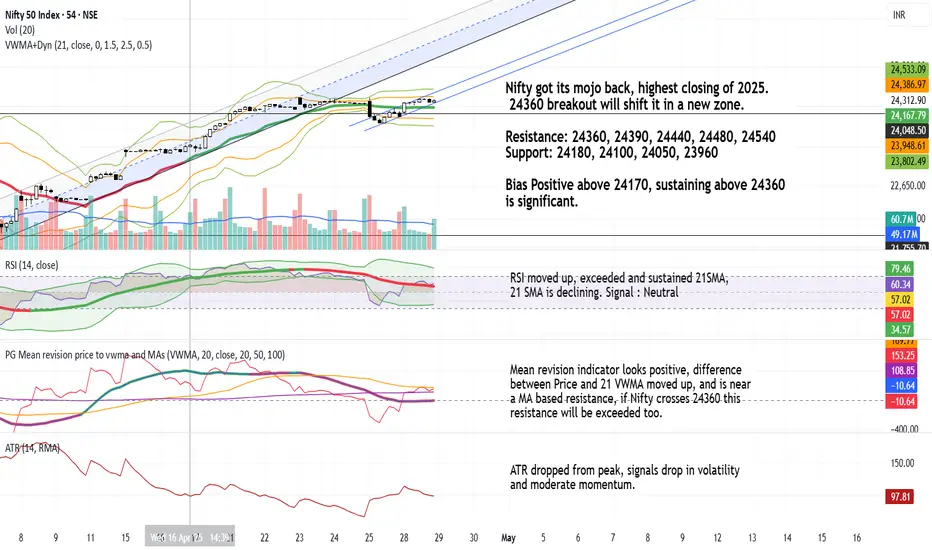
Nifty 24170-24360 range breakout to provide an directional move.Trend: Moderately bullish.
Trigger point: 24,360 breakout.
Above 24,360: Strong bullish breakout into a fresh zone.
Below 24,170: Caution advised — bias would weaken.
Volatility: Dropping — favoring smoother, more controlled moves rather than choppy swings.
Momentum: Building but needs further confirmation from RSI 21-SMA reversal.
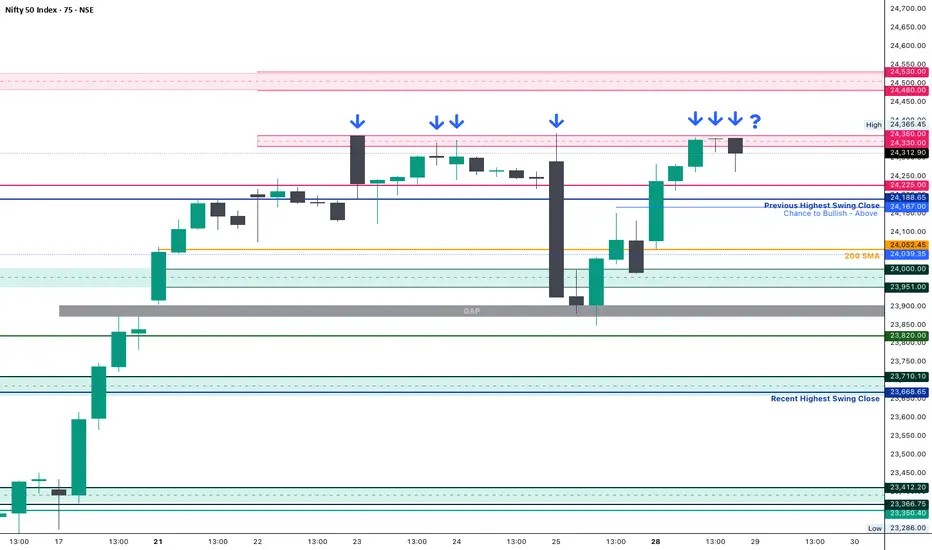
Nifty Analysis EOD - 28th April 2025🟢 Nifty Analysis EOD - 28th April 2025 🔴
Nifty almost retraced 25th April’s fall — Back to Square One... What Next?
📈 Market Summary
Nifty almost retraced 25th April’s fall — Back to Square One... What Next?
As highlighted in previous sessions, the 24,330 ~ 24,360 zone once again proved to be a crucial resistance. Today, along with the past three sessions, we observed Nifty struggling to breach this wall — a fact clearly visible on the 75-minute time frame chart.
Now the big question:
➡️ Tomorrow, can Nifty decisively breach 24,365 and sprint towards 24,500?
Well, time will answer, but we must stay prepared for moves on either side.
Intraday Walk:
Nifty opened with a gap-up above the psychological 24,000 level at 24,070.
With a slow yet steady bullish pace, it hit a high of 24,355.
After touching this critical resistance, it spent almost 2 hours consolidating in the same zone.
Finally, it closed at 24,312, defending most of its intraday gains — a strong show of resilience by the bulls.
🕯 Daily Candle Structure
Today's Candle:
🟢 Strong Bullish Candle (Almost a Marubozu)
Open: 24,070.25
High: 24,355.10
Low: 24,054.05
Close: 24,328.50
Change: +289.15 points (+1.20%)
Key Observations:
The session opened slightly above yesterday’s close and dipped just marginally.
Buyers took charge from the very beginning, consistently pushing the index higher.
Close near the day's high signals robust bullish momentum.
The candle has a tiny lower shadow and minimal upper shadow, indicating persistent buying throughout the day.
What It Implies:
Clear bull dominance.
Willingness among buyers to step up even at higher levels.
If external cues remain supportive, momentum could continue into the next session.
🛡 Gladiator Strategy Update
ATR: 344.11
IB Range: 182.1 (Medium IB)
Market Structure: Balanced
Trade Highlights:
1st Trade: Long Entry triggered at 10:05 AM — SL Hit
2nd Trade: Long Entry triggered at 11:25 AM — 1:2 Target Achieved
Additional Trade (Discretionary Contra): Short Entry at 14:15 PM — 1:1.4 Target Achieved
🧾 Index Performance Snapshot
Nifty 50: +289 Points (+1.20%)
Bank Nifty: +768 Points (+1.41%)
Nifty 500: +254 Points (+1.16%)
Midcap: +870 Points (+1.62%)
Smallcap: +130 Points (+0.78%)
📍 Key Levels to Watch
Resistance Zones:
🔹 24,330 ~ 24,360 (Immediate hurdle)
🔹 24,480 ~ 24,540 (24,500 psychological level inside this zone)
🔹 24,800
Support Zones:
🔹 24,190 ~ 24,225 (Immediate support)
🔹 24,120
🔹 24,050
🔹 24,000 ~ 23,950
🔹 23,820
🔹 23,710 ~ 23,660
🔹 23,500
🔹 23,410 ~ 23,370
🔹 23,215
🎯 Final Thoughts
"Structure is key. When levels work, respect them. When they break, adapt."
The current structure indicates bulls have made a strong comeback, but remember — 24,330 ~ 24,360 remains the battleground. Only a decisive breakout above can ignite a rally towards 24,500+. Otherwise, we stay watchful for possible reversals.
Stay sharp, stay prepared!
✏️ Disclaimer ✏️
This is just my personal viewpoint. Always consult your financial advisor before taking any action.
NIFTY 50 - Short-Term AnalysisChart Structure Overview:
Pattern Formation:
NIFTY has completed an Expanding Triangle pattern at the top.
Before starting the Expanding Triangle, a Final Exhaustion Gap was created — typically a strong signal of trend reversal.
Volume Behavior:
During the Expanding Triangle, volume gradually decreased, indicating loss of momentum.
Volume pattern confirms the weakening of the uptrend.
GAP Analysis:
Past continuation gaps have driven the uptrend.
Now, the final gap behaves as an Exhaustion Gap — signaling potential trend reversal.
Expectation: Another confirmation gap to open on the downside to validate the reversal.
Price Expectations:
Target Level Comments
Target 1 23,300 First major support zone
Target 2 22,800 Stronger support zone aligning with previous Fibonacci projections
Immediate downside move expected after a minor bounce/confirmation setup near the current zone (~24,300–24,400).
Technical Key Points:
Expanding Triangle Completed: Market structure topped out.
Exhaustion Gap Formed: Clear early sign of exhaustion.
Volume Decreasing: Confirming distribution phase.
Past GAP Analysis:
Continuation Gaps drove the trend up.
Final GAP now signals a possible major trend change.
Summary:
NIFTY appears to have completed its up-move after forming a final exhaustion gap.
The loss of momentum inside the expanding triangle pattern, coupled with the exhaustion gap at the top, signals that a short-term bearish reversal is highly probable.
In the coming days, once the market confirms the downward structure (especially if a downside gap occurs), a sharp fall toward 23,300 and then 22,800 can be expected.
Short-term trend: 🔻 Bearish below 24,600.
Disclaimer:
This analysis is for educational and information purposes only. Not investment advice. Always trade with strict risk management.

Nifty levels - Apr 29, 2025Nifty support and resistance levels are valuable tools for making informed trading decisions, specifically when combined with the analysis of 5-minute timeframe candlesticks and VWAP. By closely monitoring these levels and observing the price movements within this timeframe, traders can enhance the accuracy of their entry and exit points. It is important to bear in mind that support and resistance levels are not fixed, and they can change over time as market conditions evolve.
The dashed lines on the chart indicate the reaction levels, serving as additional points of significance to consider. Furthermore, take note of the response at the levels of the High, Low, and Close values from the day prior.
We hope you find this information beneficial in your trading endeavors.
* If you found the idea appealing, kindly tap the Boost icon located below the chart. We encourage you to share your thoughts and comments regarding it.
Wishing you success in your trading activities!
