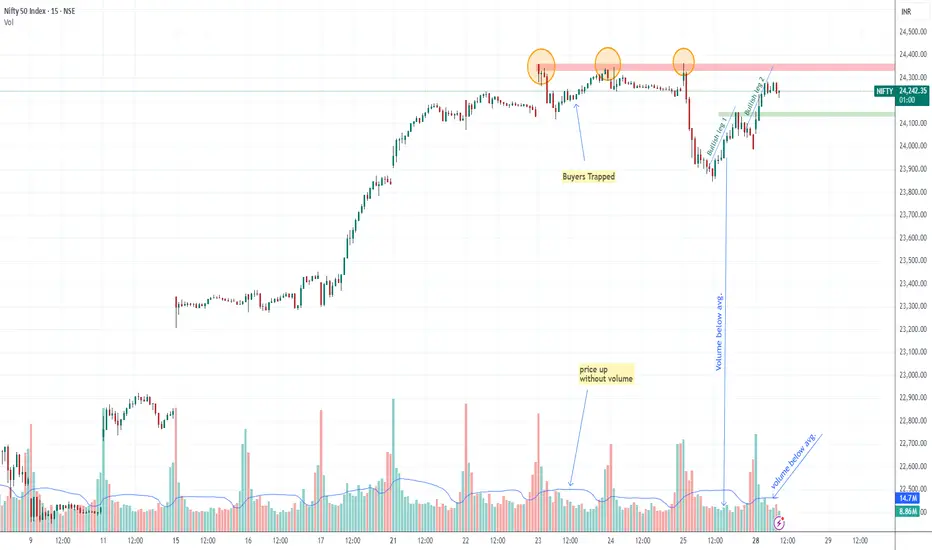
let it be cross & sustained above 24350 leveltoday 28 April market showing strengths after little correction on Friday, yeah ofc market mode is still bullish but see BULLISH LEG 1 mention on chart below avg. traded volume not supporting price same Today BULLISH LEG 2 also have below avg. volume noticed, same you can noticed on 23 April when market was going up below avg. volume before falling , so if nifty really bullish pls let it be cross and sustained above 24350 level
NIFTY trade ideas
#NIFTY Intraday Support and Resistance Levels - 28/04/2025Nifty will open gap up in today's session. Expected opening near 24200 level. After opening if 24150-24250 zone will act as a consolidation for today's session. Any strong upside rally only expected if nifty starts trading and sustain above 24250 level. Downside movement expected if nifty starts trading below 24150 level. Below this level downside move expected upto 23850 support level in today's session.

NIFTY 50 NIFTY
Nifty chart look bearish go for down side only till 23666 if look for bullish trade then go with small risk.
You may trade your instinct but experience also hold some value so plan your trade smartly.
Weekly candle close is here! Bearishness to start!!?As we can see NIFTY has formed signs of indecisiveness in bigger time frame as we had been waiting for weekly candle close in the structure making it look weak. Now our view just shifts from buying on dips to selling on rise till it closes above the previous high and hence keeping small stop losses we can make new fresh selling positions here for bigger targets so plan your trades accordingly and keep watching everyone.
Nifty Trend directionNifty 24039 has hit the resistsance and shown reversing signals. A drop to 22600 is imminent. If taregt1 unable to hold target 2 would be 21400.

How India's Market performed during war like situtation ?espite facing wars, cross-border tensions, and unexpected shocks, the Indian stock market has consistently demonstrated remarkable resilience.
🔹 Kargil War (May–July 1999)
Index declined 9.3% from 1,084 to 916 but rebounded sharply — hitting 1,201 the next month, and soaring 40%+ by war's end.
🔹 Surgical Strikes (September 2016)
Short-term 1–2% dip, with a deeper 12.9% correction by November 2016. But markets recovered strongly, rallying 22%+ over the next 3 months.
🔹 Cross-border Tensions (February 2019)
Small dip of 1–2%, with Nifty swiftly rebounding from 10,500 levels in February to above 12,100 by June.
📊 The message is clear:
Short-term volatility happens.
Long-term resilience wins.
Stay invested. Stay informed.
Trust the process.

NIFTYNIFTY
MTF Analysis Proximal TradeZone
NIFTYYearly Demand 18887 BUY
NIFTY 6 Month Demand 21801 BUY
NIFTYQtrly Demand BUFL 22526 BUY
NIFTYMonthly Demand 23110 BUY
NIFTYWeekly Demand -DMIP 22180 BUY
NIFTYWeekly SOE 23049 BUY
NIFTYDaily Demand DMIP LHS 22261 BUY
GANN Analysis Average TradeZone
NIFTY LONG & Trail Above 23585 Stay Long
NIFTY SHORT & Trail Below 23300 Stay Short
Currently in Weekly Supply Zone 24720 24450 Short
NIFTY SHORT-Entry 1 24,450
SL 24,720
RISK -270
REWARD -658
Target as per Entry 23,792
Last Demand 23,049
Last Low 22,720
NIFTY LONG Trade Plan
NIFTY LONG-Entry 1 23,049
SL 22,720
RISK 329
REWARD 7,114
Target as per Entry 30,163
Last High 26,277
Last Low 22,720

Nifty 50 Elliot Wave Analysisnifty 50 elliot wave analysis daily time frame chart . price move upside correction Wave A,B or C . Wave A,B or C almost complete and price come down

Nifty50 View .....TechnicallyNifty50 Daily Outlook
After a sharp recovery, Nifty50 is showing signs of exhaustion. A sell opportunity may arise near 24000 levels.
Trade Plan:
Sell Entry: Around 24000
Target: 23380
Stoploss: 24220
If Nifty sustains below 24000, a pullback toward 23380 looks likely. Maintain strict stoploss and manage risk carefully!!

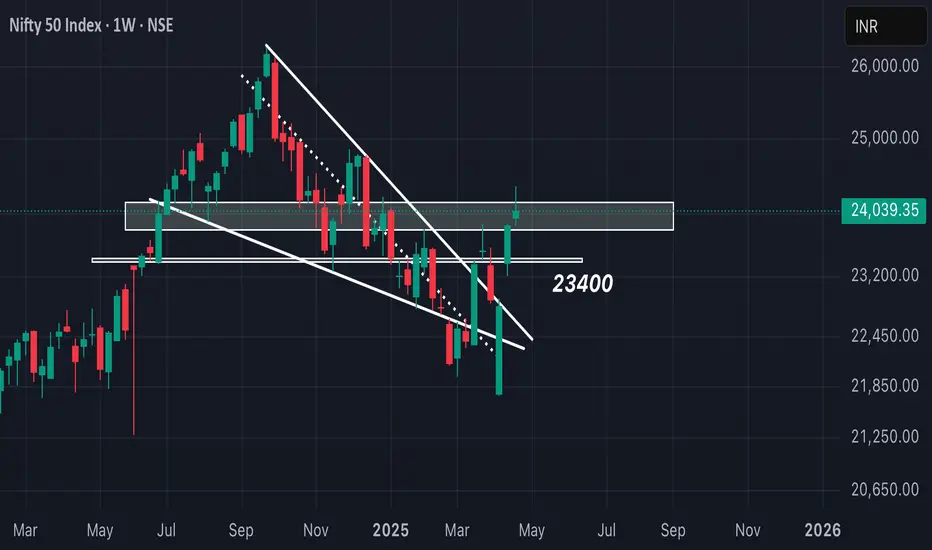
Nifty Wkly Market Outlook: Bulls Regain Momentum Amid key brkoutThe Indian benchmark index Nifty 50 ended the week on a strong note, closing at 24,039, marking a robust gain of nearly 200 points from last week's close. During the week, Nifty made a high of 24,365 and a low of 23,847, trading perfectly within the anticipated range of 24,414 – 23,200, as projected in our previous analysis.
Importantly, the index managed to secure a weekly close above the psychological resistance level of 24,000, signaling a possible continuation of bullish momentum. As we head into the next trading week, the bulls are expected to have the upper hand, provided Nifty stays above 23,700. A daily close below 23,700, however, could shift sentiment in favor of the bears, exposing key support zones at 23,400 and 23,200.
Looking ahead, traders and investors should watch for price action within the broader range of 24,650 to 23,400. If the bulls manage to break and sustain above the critical Fibonacci resistance level of 24,414, we could see an upside move toward 24,650 and even 24,770.
On the global front, the S&P 500 index also delivered a strong performance, closing at 5,525, up a significant 250 points from the previous week. As highlighted earlier, the bullish W pattern on the charts has played out well, driving momentum higher.
If the S&P 500 sustains above the key breakout level of 5,551, it could potentially rally further to test resistance at 5,638, 5,670, and 5,715. However, a break below 5,391 may invite selling pressure, dragging the index down to test supports at 5,368, 5,327, or even 5,246, which could trigger a negative ripple effect across global markets.
Key Takeaways:
Nifty bullish above 24,000; watch 24,414 for breakout confirmation.
S&P 500 bullish continuation above 5,551; potential to test 5,715.
Bearish reversal levels to monitor: 23,700 for Nifty and 5,391 for S&P 500.

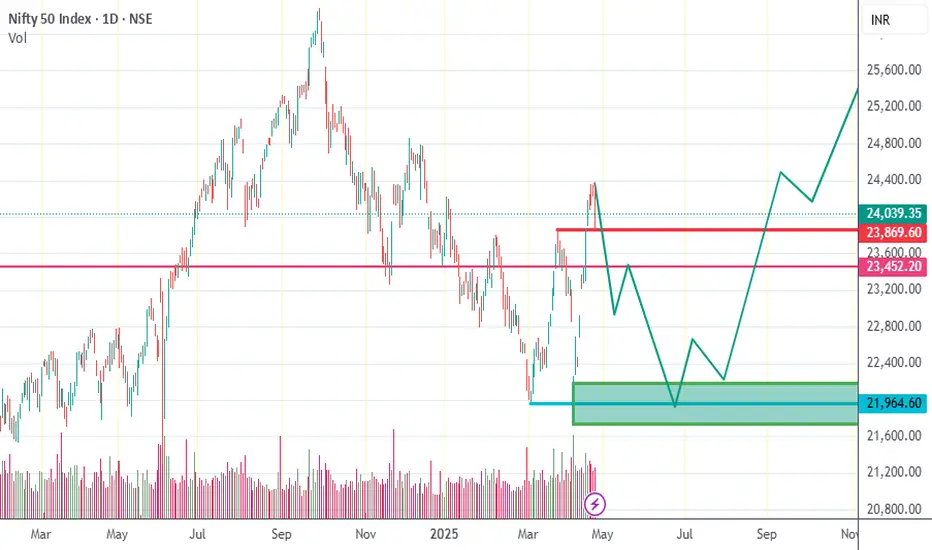
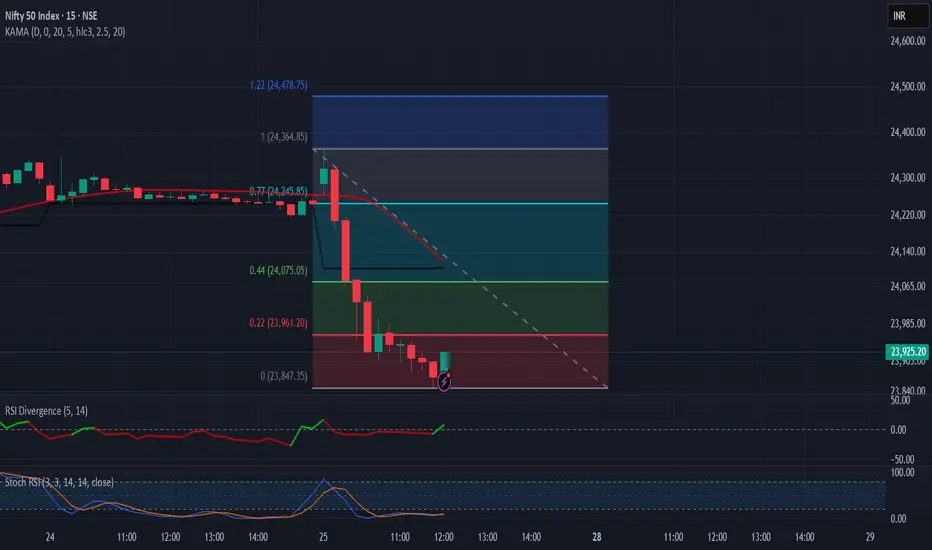
Nifty towards new ATH or correction mode.Nifty towards new ATH or correction mode.
Nifty Now, what’s next?
If the low of Friday, 25th April is breached, we may witness a deeper correction as indicated on the charts.
Traders should stay cautious and closely monitor the price action around key support levels.
A sustained break below the recent low could trigger further downside, while holding above it might invite fresh buying interest.

NIFTY MAY SERIES ( 1ST WEEK ANALYSIS )Nifty is looking uncertain, and closing isn't giving much confidence for the upside. But if somehow Nifty crosses and sustains above 24188, then we can expect the upside to continue upto 24650+ . A big boost for the upside would be 24400. On the downside, if Nifty breaches 23850, then we can expect further retracement upto 23600-420.

NIFTY50.....Wave iii complete! Corrective move ahead?Hello Traders,
the NIFTY50 reached on Friday the level of 24365 and fell to a close @ 24039.35!
This level (@24365) can be a wave iii! The next move would be a wave iv, that can retrace to 23585.
The next opportunity could be a wave c that is done or close to be done.
Chart analysis:
If the wave iii would be done, the next move should be to the cited target range @ 23585 or some points below. From here, a wave v should start with targets around 24620. Higher price are still possible, while not expected!
Several scenarios are thinkable, but it's too early to announce them.
Another possible idea could be a "double waves 1-2". In this case, N50 should run to new ATH's in the coming weeks ahead!
A sell-signal would occur if price touch below the level of 23847.85 points.
If price extend the gains above 24365.45, the sell-signal would be eliminated!
Ok, the following 2-3 day's will be interesting to watch, and a new update is at hand!
Have a great weekend.....
Ruebennase
Please ask or comment as appropriate.
Trade on this analysis at your own risk.
I'm very happy about a like!

Nifty has broken Channal resistance and now in uptrendNifty has broken Channal resistance and now in uptrend. It has retraced from 24500 level due to recent incident in Pahalgam.

Despite Geo-Political tensions, Nifty closes above Mother line. It was quite remarkable for Nifty to close above the Mother line (50 Hours EMA) despite the Geo-Political tensions and brewing storm of escalations at border. This shows the character of not only Indian market but the resilience of India as a nation. In yesterday's post itself we had mentioned that strong technical resistance has been reached. Add the tension and intent of India to fight against terrorism so it was a perfect recipe for a major fall. Which may happen if things escalate further next week but recovering from 23847 and to close above 24K at 24039 shows that when things will be back to normal the indices will bounce back. Resistance for Nifty now remain at 24096, 24335 and 24504. Supports for Nifty remain at 23914 (Major Mother line support) of 50 Hours EMA, 23800, 23530 and finally 23363.
While Long term players, FII, HNI and DII look at such opportunities to invest for Retail trader it becomes very difficult to control their emotions in such an environment of Geo-political pressure and then we saw a huge fall in the market. The opportunity was seized by both DII and FII with both hands as both turned net buyers for Rs.6492+ Crores. So traders / investors should always avoid knee jerk reactions. Who knows what happens during the weekend the support and resistance levels to watch out for are already mentioned in the message.
Disclaimer: The above information is provided for educational purpose, analysis and paper trading only. Please don't treat this as a buy or sell recommendation for the stock or index. The Techno-Funda analysis is based on data that is more than 3 months old. Supports and Resistances are determined by historic past peaks and Valley in the chart. Many other indicators and patterns like EMA, RSI, MACD, Volumes, Fibonacci, parallel channel etc. use historic data which is 3 months or older cyclical points. There is no guarantee they will work in future as markets are highly volatile and swings in prices are also due to macro and micro factors based on actions taken by the company as well as region and global events. Equity investment is subject to risks. I or my clients or family members might have positions in the stocks that we mention in our educational posts. We will not be responsible for any Profit or loss that may occur due to any financial decision taken based on any data provided in this message. Do consult your investment advisor before taking any financial decisions. Stop losses should be an important part of any investment in equity.

Trading Tutorial Video for 25-04-2025Trading Tutorial for today on Index Nifty How one could have traded Nifty by following the process If someone is interested in trading stocks, pl leave the name of the stock in Comments section I will cover it in the video

NIFTY Nifty is looking good to buy around 21700 to 22100 after reversal confirmation, so wait for the chance ,
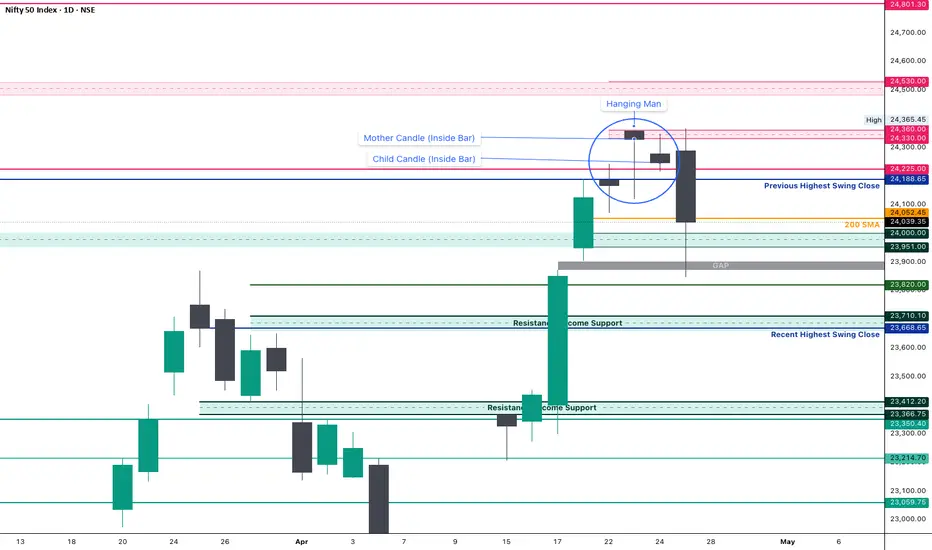
Nifty Analysis EOD - April 25, 2025🟢 Nifty Analysis EOD - April 25, 2025 🔴
"Inside Bar Alert — Calm Before the Storm"… And Then the Storm Hit!
📊 Market Recap: A Walk? No. A Sprint Downhill!
As we noted in yesterday’s report, the Inside Bar setup was hinting at a possible breakout—today, it delivered that breakout with thunder and lightning. And if you blinked, you probably missed it.
Nifty opened at 24,289, looked like it might test bullish waters by attempting PDH twice within the first 15 minutes, but the sellers were just getting warmed up. What followed was a merciless 400-point drop in just 30 minutes, slicing through level after level like a knife through butter.
Zone after zone fell like dominoes:
CDO
CPR Zone
PDH
S1, S2, S3, S4
24,225, 24,188
200 SMA at 24,052
24,000 ~ 23,951 Zone
Virgin Zone 23,905 ~ 23,872
Absolutely brutal sell-off. No mercy. No pause. Just raw momentum to the downside.
🕯️ Daily Candle Structure: Long-Legged Bearish
Today’s daily candle adds a strong bearish tone to the chart:
Open: Flat to Mild Gap-Up
High: 24,365.45
Low: 23,847.85
Close: Deep in red
Despite a small attempt at recovery near the lows, buyers couldn’t even regain the opening level. What’s left is a long-legged bearish candle, indicating volatility, intraday recovery attempt, and bear dominance.
📌 This type of candle often signals distribution or exhaustion, especially when it appears after a long rally. If the next session continues the bearish move, this might be the start of a short-term correction. If we get a bullish bounce, then today’s low may act as a temporary support.
🔍 Recalling the Setup:
We previously observed a Hanging Man on April 23, signaling a possible reversal. Then, the Inside Bar formed on April 24—a classic setup for a breakout.
✔️ Our expectation: 1x Mother Bar Range as a move
✔️ Bias: Slightly Bearish due to the Hanging Man and overall overextended rally
❌ Expectation: Didn’t expect this much bloodshed this fast!
📌 Gladiator Strategy Update
ATR: 347.27
IB Range: 405.4 (Extra Large IB)
Market Structure: Balanced
🎯 Trade Highlights:
No System Trade: Setup didn’t align with risk management rules
Additional Trade (Discretionary Contra):
Long Entry Triggered at 12:35 PM
✅ Target Achieved: 1:3.7 Risk-Reward
📉 Index Performance Snapshot:
Nifty 50: -207 Points (-0.86%)
Bank Nifty: -537 Points (-0.97%)
Nifty 500: -332 Points (-1.5%)
Midcap: -1399 Points (-2.5%)
Smallcap: -416 Points (-2.45%)
Midcaps and smallcaps took the biggest hit, showing broad-based weakness across the market.
📌 Key Levels to Watch
📍 Resistance Zones:
24,050
24,120
24,190 ~ 24,225
24,330 ~ 24,360
24,480 ~ 24,540
24,800
📍 Support Zones:
24,000 ~ 23,950 (Immediate)
23,820
23,710 ~ 23,660
23,500
23,410 ~ 23,370
23,215
🧭 Final Thoughts:
"The storm doesn't announce itself with thunder—it begins with silence. Yesterday was silent. Today was the thunder."
The Inside Bar setup has played out, but now eyes are on whether we get follow-through selling or a relief bounce. The next session’s first 30–45 mins might give a clue.
✏️ Disclaimer ✏️
This is just my personal viewpoint. Always consult your financial advisor before taking any action.
NIFTY NEW LOW 23500NIFTY NEW LOW 23500
The Nifty 50 index has seen a sharp decline today, dropping 338 points to an intraday low of 23,908. This downturn was driven by a broad selloff across sectors, with financial stocks leading the losses. Axis Bank, Adani Ports, Bajaj Finance, and Tata Motors were among the major laggard

Nifty levels - Apr 28, 2025Nifty support and resistance levels are valuable tools for making informed trading decisions, specifically when combined with the analysis of 5-minute timeframe candlesticks and VWAP. By closely monitoring these levels and observing the price movements within this timeframe, traders can enhance the accuracy of their entry and exit points. It is important to bear in mind that support and resistance levels are not fixed, and they can change over time as market conditions evolve.
The dashed lines on the chart indicate the reaction levels, serving as additional points of significance to consider. Furthermore, take note of the response at the levels of the High, Low, and Close values from the day prior.
We hope you find this information beneficial in your trading endeavors.
* If you found the idea appealing, kindly tap the Boost icon located below the chart. We encourage you to share your thoughts and comments regarding it.
Wishing you success in your trading activities!
Nifty Intraday Setup Buy Nifty only above 23962 (a 5m candle close above 23962)
Targets 24075, 24245 & 24364
Sl 23847
NIFTY S/R for 25/4/25Support and Resistance Levels:
Support Levels: These are price points (green line/shade) where a downward trend may be halted due to a concentration of buying interest. Imagine them as a safety net where buyers step in, preventing further decline.
Resistance Levels: Conversely, resistance levels (red line/shade) are where upward trends might stall due to increased selling interest. They act like a ceiling where sellers come in to push prices down.
Breakouts:
Bullish Breakout: When the price moves above resistance, it often indicates strong buying interest and the potential for a continued uptrend. Traders may view this as a signal to buy or hold.
Bearish Breakout: When the price falls below support, it can signal strong selling interest and the potential for a continued downtrend. Traders might see this as a cue to sell or avoid buying.
MA Ribbon (EMA 20, EMA 50, EMA 100, EMA 200) :
Above EMA: If the stock price is above the EMA, it suggests a potential uptrend or bullish momentum.
Below EMA: If the stock price is below the EMA, it indicates a potential downtrend or bearish momentum.
Trendline: A trendline is a straight line drawn on a chart to represent the general direction of a data point set.
Uptrend Line: Drawn by connecting the lows in an upward trend. Indicates that the price is moving higher over time. Acts as a support level, where prices tend to bounce upward.
Downtrend Line: Drawn by connecting the highs in a downward trend. Indicates that the price is moving lower over time. It acts as a resistance level, where prices tend to drop.
Disclaimer:
I am not a SEBI registered. The information provided here is for learning purposes only and should not be interpreted as financial advice. Consider the broader market context and consult with a qualified financial advisor before making investment decisions.

