NIFTY taking a breather before finally confirming the trend ! As we can see NIFTY remained sideways throughout the day and is yet to decide its upcoming trend as the weekly candles close above our supply zone is yet to be made hence one should trade cautiously as few coming days could be further negative to sideways so plan your trades accordingly and keep watching everyone
NIFTY trade ideas

Nifty Spot Daily Trend Analysis from April 25, 2025Technical Outlook:
Nifty Spot is approaching a potential resistance near the Gann 720° level at 24,539. A minor correction appears likely, and we are currently awaiting short signal confirmation from one of our proprietary indicators. Should a decline occur, the index may find support around the Sine Wave level of 23,398. A break below this level could suggest a continuation of the bearish momentum.
At present, most indicators are still trending upwards. However, the bar formations on the chart hint at a possible reversal. Once the MastersSignal confirms a short setup, we will reassess confluence around the Gann 720° value to strengthen conviction.
Disclaimer: This is my personal technical view. Traders should conduct their own analysis and implement strict risk management before initiating any trades.

NIFTY 50 KEY LEVELS FOR 25/04/2025// The core idea behind this indicator was sparked by a simple but powerful clue:
// 👉 "If you get one level, you get all levels."
// From that point onward, everything—the logic, calculation method, and application—has been developed independently through my own analysis and experience.
// I am not a seller, and no one taught me this system. This method is a result of my own effort and refinement.
///////////////////// Explanation /////////////////////
// This trading system is designed to eliminate blind trades by offering confirmation-based entry and exit points.
///////////////////// Entry/Exit Strategy /////////////////////
// - Use the BLACK line for long trades, and the RED line for short trades, in line with confirmation from your trading plan.
// - Stop Loss:
// - For long trades: below the RED line.
// - For short trades: above the BLACK line.
// - Take Profit:
// - For long trades: target the next RED line above.
// - For short trades: target the next BLACK line below.
///////////////////// Recommended Timeframe /////////////////////
// Use on a 15-minute chart for best results.
///////////////////// Disclaimer /////////////////////
// This setup is shared purely for educational purposes.
// I am not responsible for any gains or losses that may result from its use.
// Always use your own judgment and risk management.
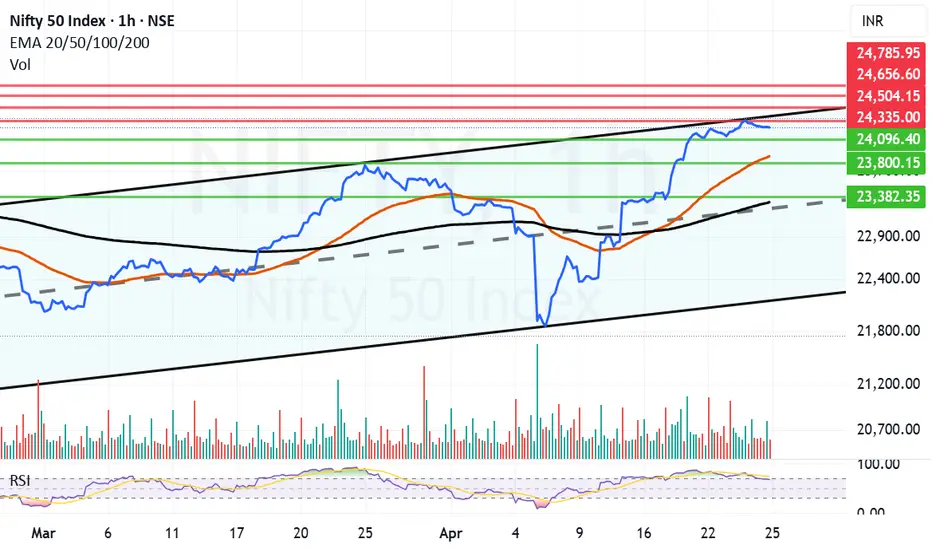
Nifty has hit a channel top with geopolitical events unravellingNifty was swiftly recovering after the Tariff war induced fall. On technical front Nifty has hit a channel top In the hourly line chart. Chanel tops are not easy to conquer and we saw Nifty retrieving today from there. Adding pressure to the rally is the Geo-Political situation after the Dastardly Pahalgam Terrorist Attack. If there is any action by India like Balakot (Swift and fast) any way it will be denied by Pakistan so nothing much will happen to Index. If there is only Political/Geopolitical long term steps taken again it will have less effect on the market. Market may decline drastically only if there is a full blown war between the 2 countries or more than 2 countries. (Possibility of that happening is less but we never know). Not much is in our hand if such a scenario arises. FIIs were seen buying big today so that is something to watchout in the coming days.
Technical Supports for Nifty remain at: 24096, 23882 (Mother Line Support), 23800 and 23316 (Father Line Support). (Mid channel support is also around 23300) so this zone presents a strong support zone.
Technical Resistances Remain at: 24335 (Major Channel Top Resistance), 24504, 24656 and 24785.
Disclaimer: The above information is provided for educational purpose, analysis and paper trading only. Please don't treat this as a buy or sell recommendation for the stock or index. The Techno-Funda analysis is based on data that is more than 3 months old. Supports and Resistances are determined by historic past peaks and Valley in the chart. Many other indicators and patterns like EMA, RSI, MACD, Volumes, Fibonacci, parallel channel etc. use historic data which is 3 months or older cyclical points. There is no guarantee they will work in future as markets are highly volatile and swings in prices are also due to macro and micro factors based on actions taken by the company as well as region and global events. Equity investment is subject to risks. I or my clients or family members might have positions in the stocks that we mention in our educational posts. We will not be responsible for any Profit or loss that may occur due to any financial decision taken based on any data provided in this message. Do consult your investment advisor before taking any financial decisions. Stop losses should be an important part of any investment in equity.
Nifty trend directionNifty 24246 has hold on support 22240. As long as it holds the support on daily close basis could move towards 24572 on daily close basis

Nifty Analysis EOD - April 24, 2025🟢 Nifty Analysis EOD - April 24, 2025 🔴
Inside Bar Alert—Calm Before the Storm?
📊 Market Recap:
Nifty opened at 24,284, marking a Gap Down of 51 points (-0.21%) from the previous close. The day began on a surprisingly calm note, but that didn’t last long. Within just 15 minutes, Nifty spiked over 100 points, rushing toward PDH (Previous Day’s High)—only to reverse sharply in the next 15 minutes and create a new intraday low.
📉 This wild back-and-forth action in the first hour was nothing short of a nightmare for intraday traders—especially those trying to catch a trend early. If anything, scalpers might’ve had the best time, capitalizing on the swift movements in both directions.
For the remainder of the session, Nifty oscillated within the CPR zone, with a few false breakout candles that quickly retraced. The structure remained range-bound, indecisive, and tricky to navigate.
📅 Expiry Day Check: Deja Vu, Minus the Volatility
If we set aside the unusually directional move of April 17th expiry, today looked like a textbook expiry day, much like the past 10 before it:
Movement hugging VWAP
Small false breakouts on either side
No follow-through
Today’s range: 132 points
Avg range of last 10 expiries: 192 points
This time, however, the volatility was muted, despite early session fireworks.
🕯 Daily Candle Structure: Inside Bar + Shooting Star
On the Daily chart, today’s price action has formed a bearish Shooting Star–like candle, but here’s the kicker—it’s also an Inside Bar setup.
📌 What’s an Inside Bar?
An Inside Bar pattern occurs when today’s high and low are completely within yesterday’s range (the “mother bar”). This signals consolidation or indecision, and often precedes a strong breakout.
📖 How to trade it?
Wait for a decisive breakout above the mother bar high or below the mother bar low. Add confirmation with volume surge to gauge the strength of the breakout.
👉 Remember: The Inside Bar doesn’t predict direction—it just tells you a move is brewing.
📌 Gladiator Strategy Update
ATR: 328.34
IB Range: 108.40 (Small IB)
Market Structure: Balanced
🎯 Trade Highlights:
No Trade Opportunity Presented — The structure didn’t offer any valid setups within strategy rules.
🧠 Index Performance Snapshot:
Nifty 50: -82 Points (-0.34%)
Bank Nifty: -168.65 Points (-0.30%)
Nifty 500: -57 Points (-0.26%)
Midcap: -71 Points (-0.13%)
Smallcap: -6 Points (-0.04%)
📌 Key Levels to Watch
📍 Resistance Zones:
24,330 ~ 24,360
24,480 ~ 24,540
24,800
📍 Support Zones:
24,190 ~ 24,225
23,950 ~ 24,000 (Immediate)
23,820
23,660 ~ 23,710
23,500
23,400 ~ 23,430
23,200 ~ 23,190
🧭 Final Thoughts:
"Inside Bars are like market whispers—subtle, quiet, but worth listening to. The next breakout might just surprise you."
✏️ Disclaimer ✏️
This is just my personal viewpoint. Always consult your financial advisor before taking any action.
Trading Tutorial for 24-04-2025Trading update for today on Index Nifty and Bank Nifty How one could have traded Nifty and Bank Nifty by following the process If someone is interested in trading stocks, pl leave the name of the stock in Comments section I will cover it in the video

Nifty Analysis & Trade Plan for Friday, 25th AprilNifty Analysis & Trade Plan for Friday, 25th April

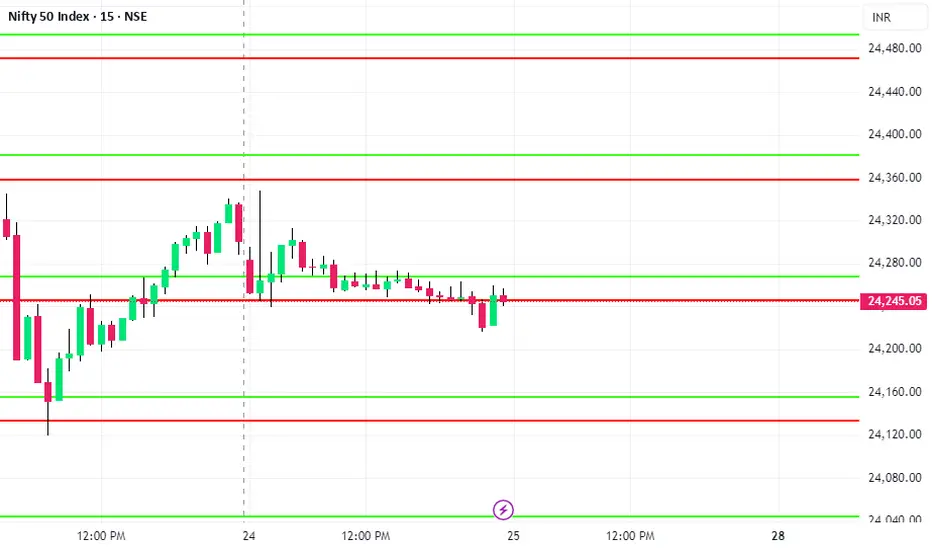
Nifty levels - Apr 25, 2025Nifty support and resistance levels are valuable tools for making informed trading decisions, specifically when combined with the analysis of 5-minute timeframe candlesticks and VWAP. By closely monitoring these levels and observing the price movements within this timeframe, traders can enhance the accuracy of their entry and exit points. It is important to bear in mind that support and resistance levels are not fixed, and they can change over time as market conditions evolve.
The dashed lines on the chart indicate the reaction levels, serving as additional points of significance to consider. Furthermore, take note of the response at the levels of the High, Low, and Close values from the day prior.
We hope you find this information beneficial in your trading endeavors.
* If you found the idea appealing, kindly tap the Boost icon located below the chart. We encourage you to share your thoughts and comments regarding it.
Wishing you success in your trading activities!

Nifty--Demand Zone and Liquidity @23400 Nifty index is broken the strong resistance at 23800 levels and taken the liquidity at 24220 levels...
now price action is sideways or trading in a range bound market.
expecting some pullback for further continuation....
wait for buyers exhaustion before short...
we have a clear demand zone at 23400 levels...
when price confirms the bullishness here, after the liquidity grab below the demand will observe a strong up move again...
there are bullish gaps @22800 levels...price has to give pullback for further upside move...
the above one is a clear buying plan for the targets of 24800 and 25200 liquidity.
--->>still we have no sign of bearishness is seen in Nifty.

Nifty : Red band disappeared Nifty : Red band disappeared
In a Buy trajectory
MACD is strong and positive
Holding itself just above 200 SMA
( Not a Buy / Sell Recommendation
Do your own due diligence ,Market is subject to risks, This is my own view and for learning only .)

NIFTY SHORT SETTING UPSimilar to my previous post on BN, Nifty is now setting up for a short trade.
Notice that the index is struggling to make fresh highs.
Notice the Lower Highs being formed.
In my analysis, if we get a negative candle closing below 24,250 it can lead to short covering and we can have a snap back to the mean.
This is again a Mean Reversion set up that I'm targeting similar to BN.

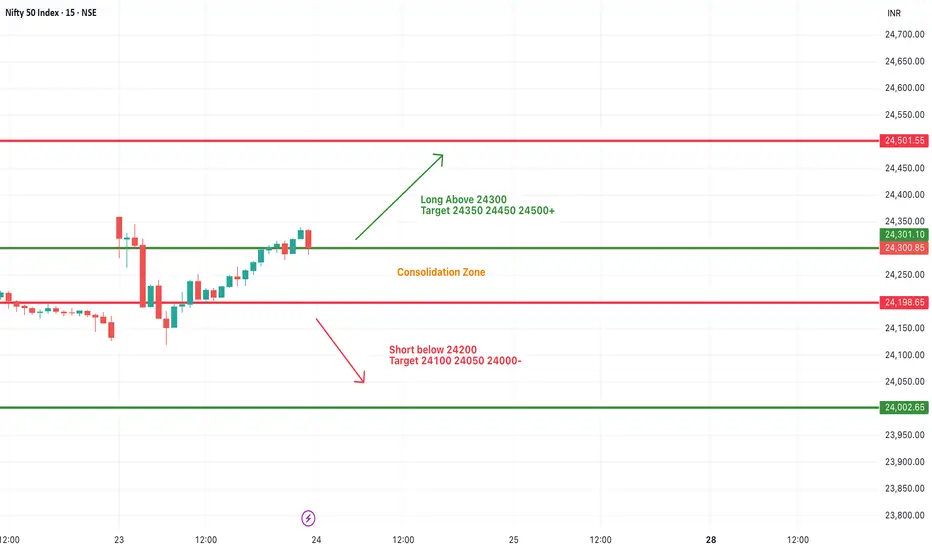
#NIFTY Intraday Support and Resistance Levels - 24/04/2025Gap down opening expected in nifty. Expected opening near 24200 level. 24200-24300 levels are the consolidation zone for the today's session. Strong upside rally expected if nifty starts trading and sustain above 24300 level. Any downside only expected below 24200 level. Downside 24000 level will act as a strong support for today's session.
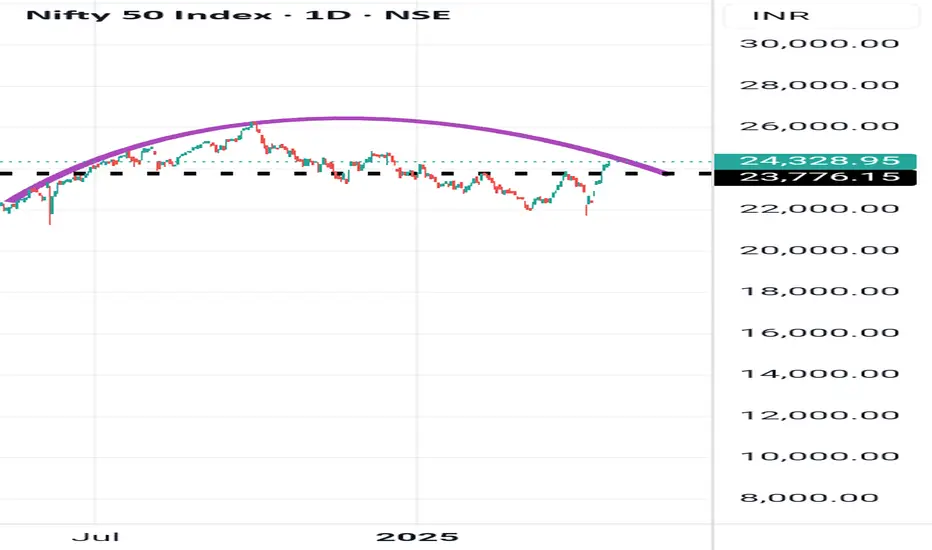
Nifty trend direction Nifty has given rounding top pattern which has 24780 as it's climax resistance on close basis.resistance wil decrease as days pass by.
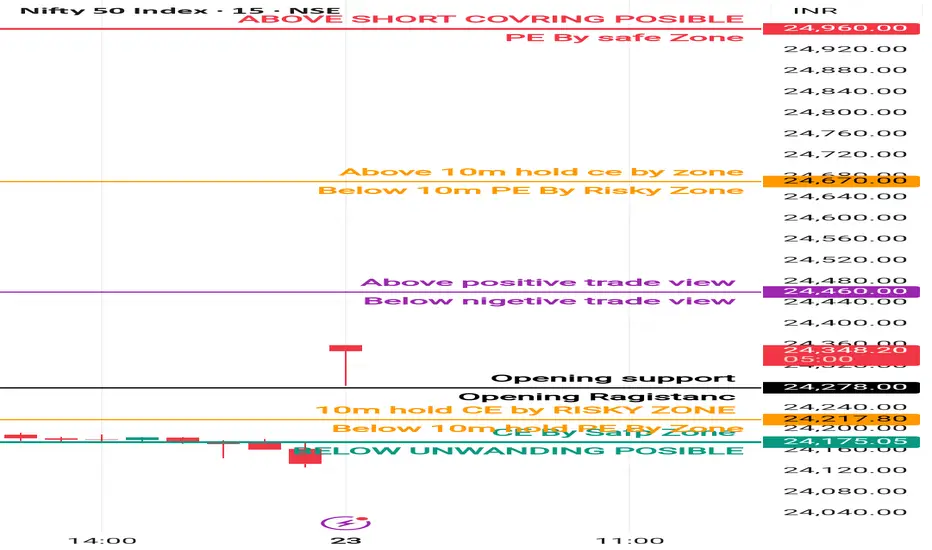
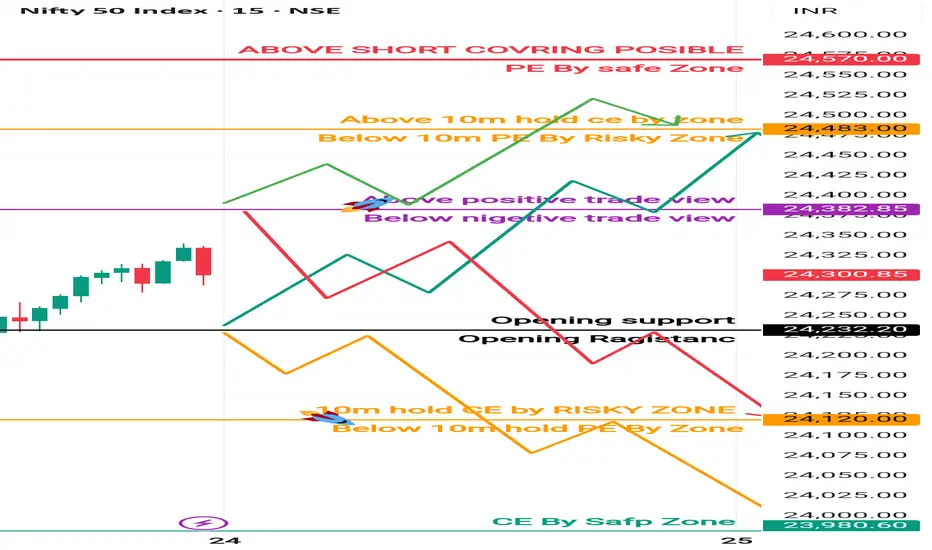
24 April Nifty50 trading zone prediction #Nifty50 #option trading
99% working trading plan
👉Gap up open 24382 above & 15m hold after positive trade target 24483, 24570
👉Gap up open 24382 below 15 m not break upside after nigetive trade target 24233, 24120
👉Gap down open 24233 above 15m hold after positive trade target 24382, 24480
👉Gap down open 24233 below 15 m not break upside after nigetive trade target 24120, 24000
💫big gapdown open 24120 above hold 1st positive trade view
💫big Gapup opening 24483 below nigetive trade view
Trade plan for education purpose I'm not responsible your trade
More education follow & support me
NEXT STOP 23800..??As we can see NIFTY has broken and sustained itself above all our supply zones confirming the bullish bias but yet to close its weekly candle above the given supply zone. If it closes then every dip can be bought for new ATH in NIFTY so plan your trades accordingly and keep watching everyone.

Trading Tutorial Video for 23-04-2025Trading update for today on Index Nifty and Bank Nifty How one could have traded Nifty and Bank Nifty by following the process If someone is interested in trading stocks, pl leave the name of the stock in Comments section I will cover it in the video

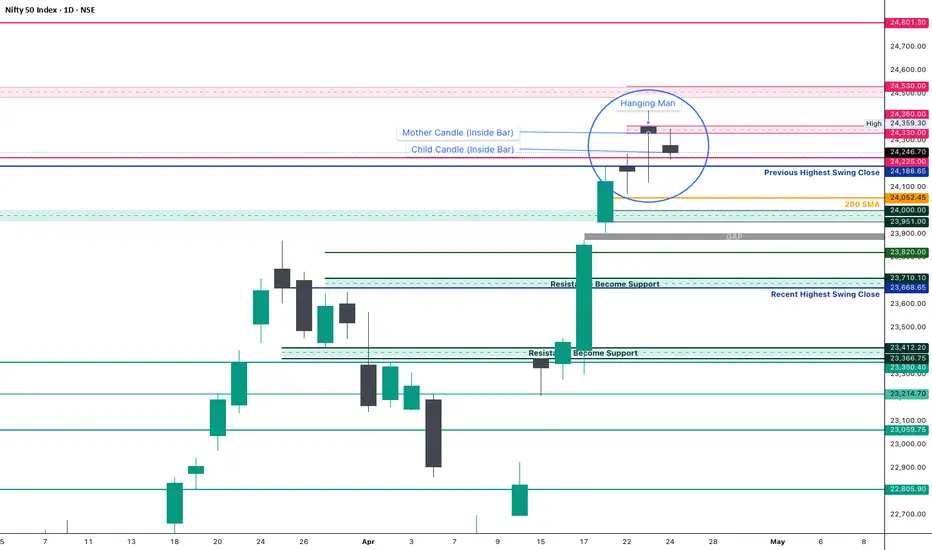
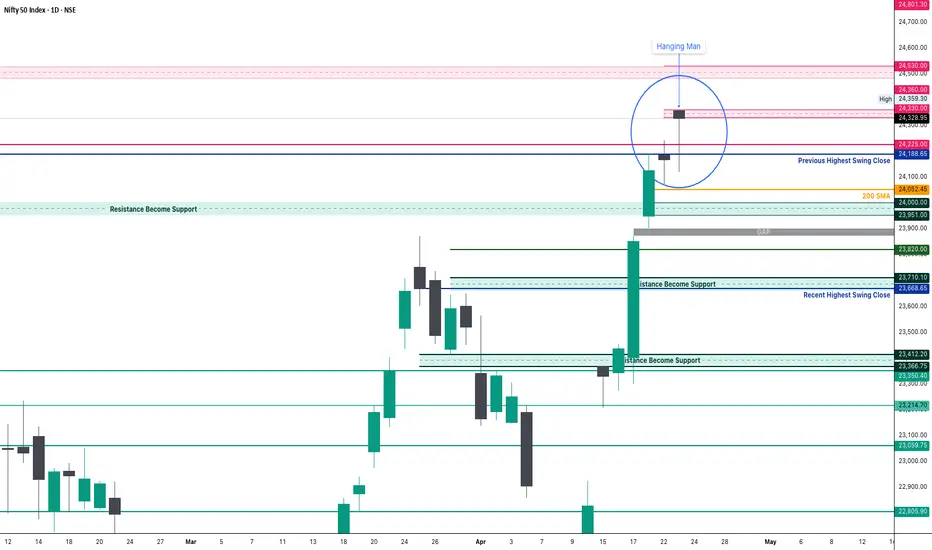
Nifty Analysis EOD - April 23, 2025🟢 Nifty Analysis EOD - April 23, 2025 🔴
"Hanging Man Candle on Bullish Trend—Pause or Plot Twist?"
📊 Market Recap:
As anticipated from the ongoing bullish structure, Nifty opened with a strong Gap-Up at 24,357, adding +192 Points (+0.79%) to the charts. However, what looked like a continuation day quickly turned cautious. The initial candle marked the day’s high (Open = High scenario, nearly exact) and started a gap-filling move, pushing prices back to CPR.
The market respected CPR as a support, then moved back towards its mean (VWAP) where the PDH + R1 zone resisted price action effectively until 1 PM. Post that, Nifty finally broke out, sustained above the zone, and closed at 24,300—still holding gains despite a red candle, which visually seems bearish but technically closes above VWAP + PDH. Hence, a hidden bullish undertone remains.
🕯 Daily Candle Check: Is It a Hanging Man?
A textbook Hanging Man candle appears to have formed on the Daily Chart—a bearish reversal pattern that shows potential weakness at the top of a rally.
📌 Candle Stats:
Body: 28 points
Lower Shadow: 209 points
Upper Shadow: 2 points
Shadow-to-body ratio: 209 / 28 = 7.4x
✅ Trend Context: Yes, uptrend present
✅ Candle Structure: Meets all parameters
👉 Verdict: Confirmed Hanging Man Candle
This hints that selling pressure is gradually creeping in while buying strength might be exhausting. But a Hanging Man alone isn't a trade trigger—confirmation is key. So we watch tomorrow’s session to decide whether it’s just a pause or a trend shift.
📈 Intraday Insight: Head & Shoulders Pattern
During the session’s consolidation and bounceback phase, a Head & Shoulders pattern played out intraday with its target being 24,300—achieved successfully by EOD.
🔍 Pattern Recap:
This bullish reversal structure shows three dips, with the central one (head) being the deepest and two shallower ones (shoulders). A break above the “neckline” confirmed bullishness—supporting the rebound above VWAP.
📌 Gladiator Strategy Update
ATR: 350.19
IB Range: 94.75 (Small IB)
Market Structure: Imbalanced
🎯 Trade Highlights:
First Trade: Short – Triggered at 10:05 AM — ✅ 1:1.5 Target Achieved
Second Trade: Long – Triggered at 13:40 PM — ✅ 1:1.5 Target Achieved
Additional Trade (H&S Pattern): Long – Triggered at 11:40 AM — ✅ Pattern Target Achieved
🧠 Index Performance Snapshot:
Nifty 50: +161 Points (+0.67%)
Bank Nifty: -277 Points (-0.5%), but a new ATH at 56,098
Nifty 500: +152 Points (+0.69%)
Midcap: +644 Points (+1.18%)
Smallcap: +74 Points (+0.44%)
📌 Key Levels to Watch
📍 Resistance Zones:
24,330 ~ 24,360
24,480 ~ 24,540
24,800
📍 Support Zones:
24,190 ~ 24,225
23,950 ~ 24,000 (Immediate)
23,820
23,660 ~ 23,710
23,500
23,400 ~ 23,430
23,200 ~ 23,190
🧭 Final Thoughts:
"Reversal or Reset? Structure is key. When levels work, respect them. When they break, adapt."
✏️ Disclaimer ✏️
This is just my personal viewpoint. Always consult your financial advisor before taking any action.
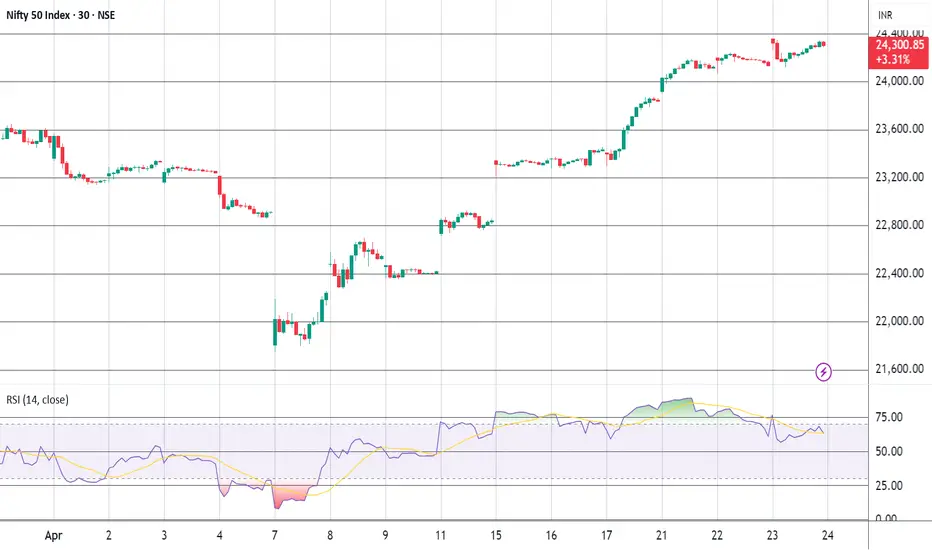
Bearish Divergence in Nifty – 30-Min Chart Signals CautionNifty’s been grinding higher on the 30-minute chart, printing fresh highs—but RSI isn’t buying it.
🟢 Price: Higher highs
🟣 Oscillator: Lower highs
That’s a classic bearish divergence—a potential red flag for an upcoming correction.
Momentum is fading even as price climbs. This usually hints that the trend’s running on fumes. A short-term pullback or pause in the rally could be just around the corner.
💡 Traders: Watch for confirmation, consider tightening stops, and don’t get caught chasing highs blindly.
Nifty Analysis & Trade Plan for tomorrow, Thursday, 24th AprilNifty Analysis & Trade Plan for tomorrow, Thursday, 24th April

Nifty levels - Apr 24, 2025Nifty support and resistance levels are valuable tools for making informed trading decisions, specifically when combined with the analysis of 5-minute timeframe candlesticks and VWAP. By closely monitoring these levels and observing the price movements within this timeframe, traders can enhance the accuracy of their entry and exit points. It is important to bear in mind that support and resistance levels are not fixed, and they can change over time as market conditions evolve.
The dashed lines on the chart indicate the reaction levels, serving as additional points of significance to consider. Furthermore, take note of the response at the levels of the High, Low, and Close values from the day prior.
We hope you find this information beneficial in your trading endeavors.
* If you found the idea appealing, kindly tap the Boost icon located below the chart. We encourage you to share your thoughts and comments regarding it.
Wishing you success in your trading activities!

1/A wave done on the upside. 2/B down underway?Too early to say but NSE:NIFTY seem to have completed wave 1/A and has potentially started wave 2/B down which should hit 23400-23300 zone at the minimum, which happens to be 38.6% retracement of the rise 1/A.

23 Nifty new update level New support 24278 strong
New ragistanc 24460
2nd ragistanc 24670
3rd ragistanc 24960