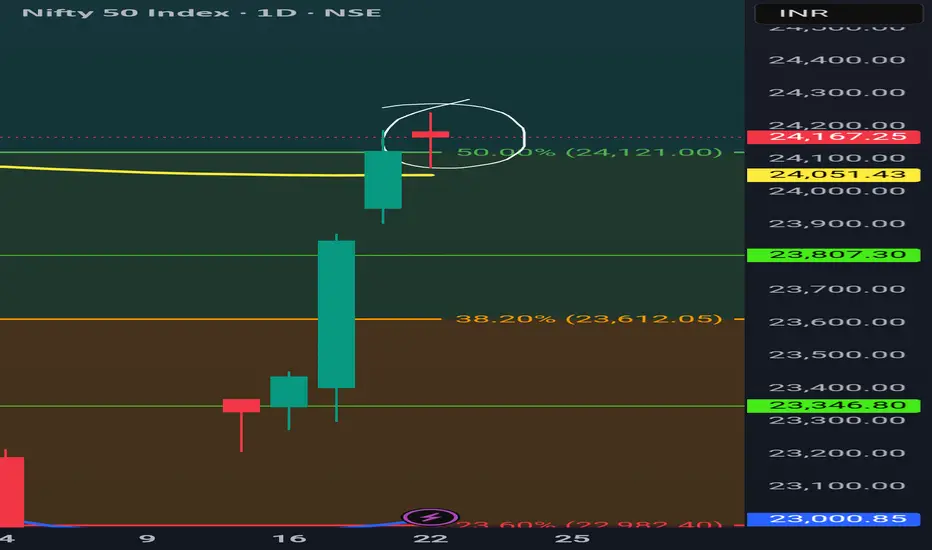
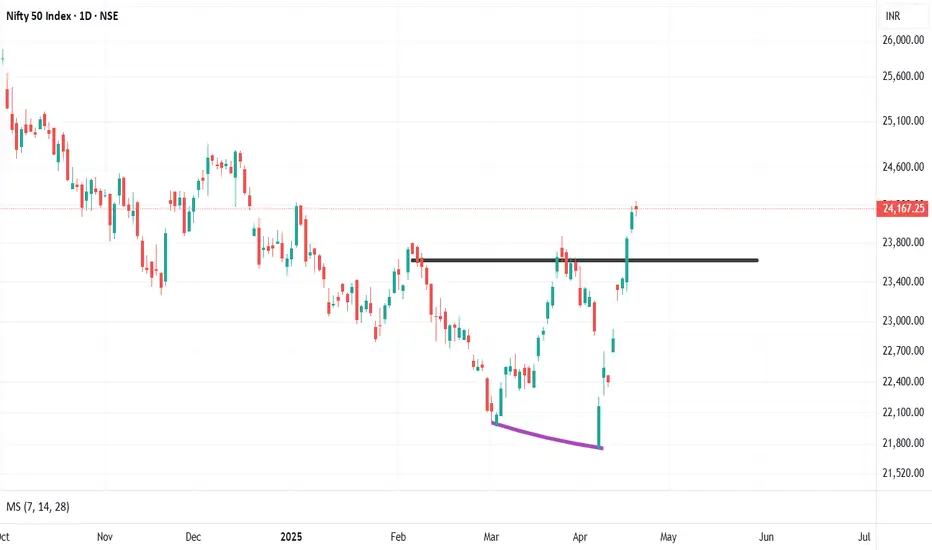
A doji at the top in Nifty. Reversal? 22nd April nifty daily candle formed a Doji at the top of the rally. It's a sign to be cautious. We can see a retracement of nifty back to 24121 (Spot) which is a fibo level. Once it touches that we can see what will happen next. Even a gapup today don't be bullish and be watchful of price action. With bad news coming through we can see a retracement happening.
NIFTY trade ideas
Nifty view 22 April 25Observing nifty50, seems like it has started changing the character and there is a turnaround possibility. Going to move up with a little pull back.

NIFTY facing rejection!?As we can see NIFTY is showing signs of rejection from our zone despite being strong forming a doji kinda candlestick. Now following the global cues, we can expect NIFTY to open stronger but hitting the even strong supply zone after filling the gap which can lead to further fall after strong opening so plan your trades accordingly and keep watching.
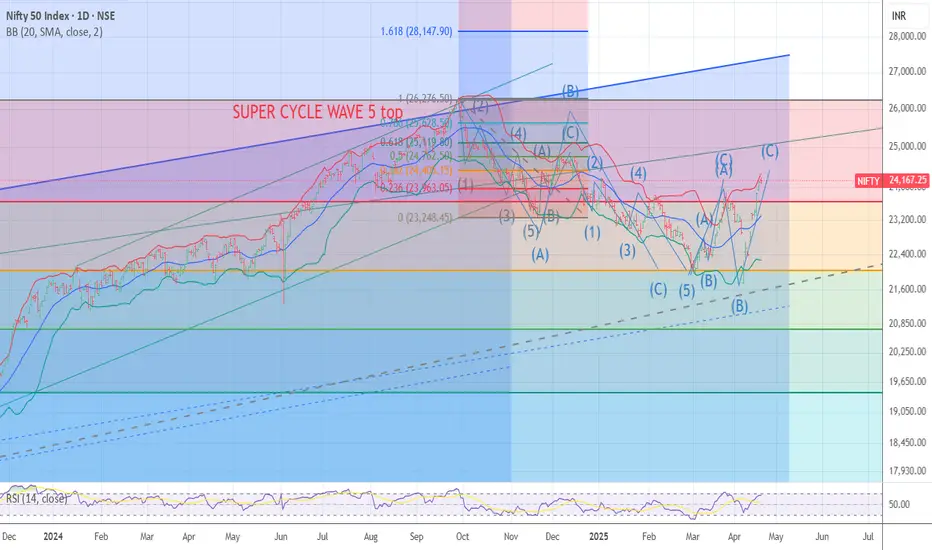
INDIA WAVE B OR 2 TOP EXIT NOW !!The Chart posted is the nifty 50 India market .I am now turning Bearish As we seem to be ending my alt Wave count for wave C up in the ABC rally . We are now at HIGH RISK if this turns Down . Best of Trades WAVETIMER
NIFTY 50 KEY LEVELS FOR 23/04/2025// All credit goes to Tony for the concept of this indicator. His Trading View link: tradingview.com/u/tony_fx_sm/
// Note: The calculation method in this indicator differs from Tony's, but the concept is derived from his work.
I want to make it clear that I am not a seller, and this method was not taught to me by anyone. The original creator only gave me one clue:
👉 "If you get one level, you get all levels."
Everything else—the way I nail it the method and applied it—is my own work. I respect the original idea, but my approach is independent.
Explanation:
This trading system helps you avoid blind trades by providing confirmation for better entries and exits.
Entry/Exit Points:
- Entry/Exit Lines: Use the BLACK line for long trades and the RED line for short trades, based on confirmation from your trading plan.
- Stop Loss: For long trades, set the stop loss at the RED line below. For short trades, set it at the BLACK line above.
- Take Profit: For long trades, target the next RED line above. For short trades, target the next BLACK line below.
Timeframe:
Use a 5 mins timeframe for trading.
Risk Disclaimer:
This setup is for educational purposes. I'm not responsible for your gains or losses. Check the chart for more details
Nifty 24167 Trend directionNifty 24167 has given possibly for an evening star pattern. Support is at 23628 and if tomorrow's trade was below 24164 it will confirm the evening star pattern and would open the bearish gate.
FII's have added Future contracts while winding up PUTS .
78 K Net contracts are yet to be closed by FII's
So we expect Nifty will be moved up to complete the further more PUTS windup
Nifty 50 Movement Update for 23/04/2025Support: The chart indicates a support level at ₹24250 for 23/04/25.
Resistance: The chart indicates a resistance level at ₹24500 for 23/04/25.
Gap Up: There is a gap up visible on the chart around the ₹24270 level for 23/04/25.
It's important to remember that these levels are based on the technical analysis presented in this specific chart. Market conditions can change, and these levels might be tested or broken on the actual trading day.

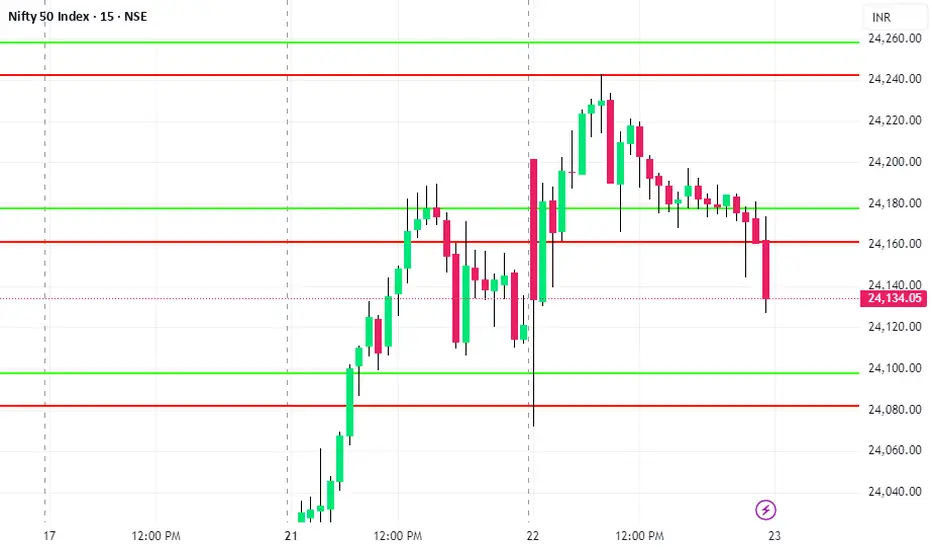
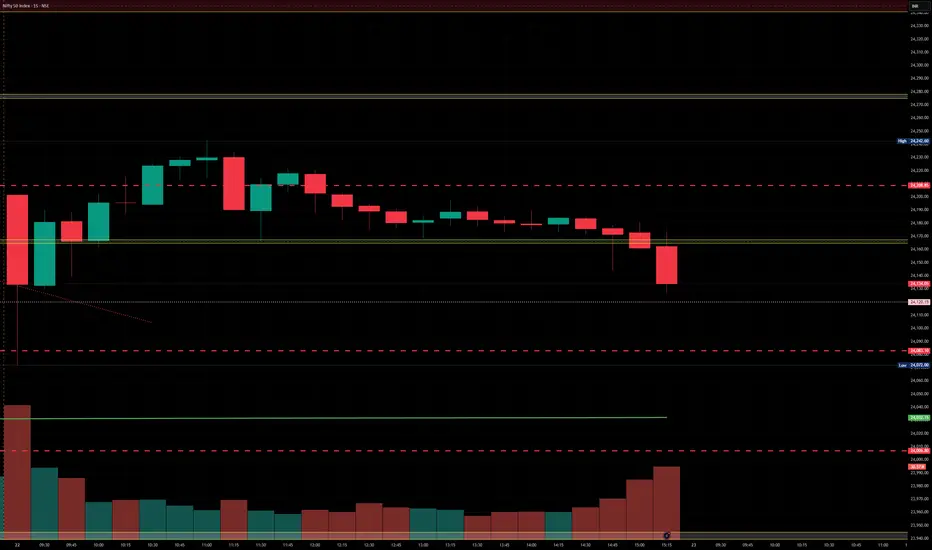
Nifty Analysis EOD - 22nd April 2025🟢 Nifty Analysis EOD - 22nd April 2025 🔴
🧠 Market Background:
As highlighted in the previous session analysis, we were expecting a range-bound or narrow-range trading day — and that’s exactly what played out.
Nifty opened at 24,185, right below the resistance zone where yesterday’s session had consolidated heavily. Early in the session, price fell below the Previous Day Close (PDC) and took support exactly at the Central Pivot Range (CPR) before staging a sharp move up — breaking both Current Day High (CDH) and Previous Day High (PDH).
However, the 24,225 resistance zone acted as a speed breaker, pushing prices back down toward VWAP, which then provided a solid support base. Until around 2:45 PM, Nifty kept forming higher lows, giving hopes for continuation — but then broke the previous swing low, forming a new lower low into the close.
📊 Price Action Insight:
Day closed above the CPR zone, which still favors the bullish structure
However, on the daily timeframe, a near-perfect Doji candle has formed, with just a 9-point body, indicating indecision or a pause in the trend
The intraday range was 170 points, noticeably lower than Nifty’s average range, hinting at contraction
In such a case, trading the Doji becomes simple — wait for either high or low to break, but also consider nearby support/resistance confluence for better edge
🎯 Strategic Outlook:
A retracement towards 23,660–23,710 or even 23,200 can’t be ruled out — although it's early to confirm
Broader sentiment stays bullish, but this Doji suggests a pause or potential reversal — so caution near upper zones is advised
Keep tracking key global cues and sector rotation — especially with Midcaps and Smallcaps showing strong resilience
📌 Gladiator Strategy Update
ATR: 362.5
IB Range: 129.65 (Medium IB)
Market Structure: Balanced
Long Trade Triggered at 10:30 AM — ✅ 1:1.5 Target Achieved
Second Long Entry at 11:40 AM — ❌ SL Hit
📈 Index Performance
Nifty: +42 Points (+0.17%)
Bank Nifty: 🔼 New All-Time High at 55,961, closing at 55,647 (+342 pts / +0.6%)
Nifty 500: +79 Points (+0.36%)
Midcap: +422 Points (+0.78%)
Smallcap: +122 Points (+0.73%)
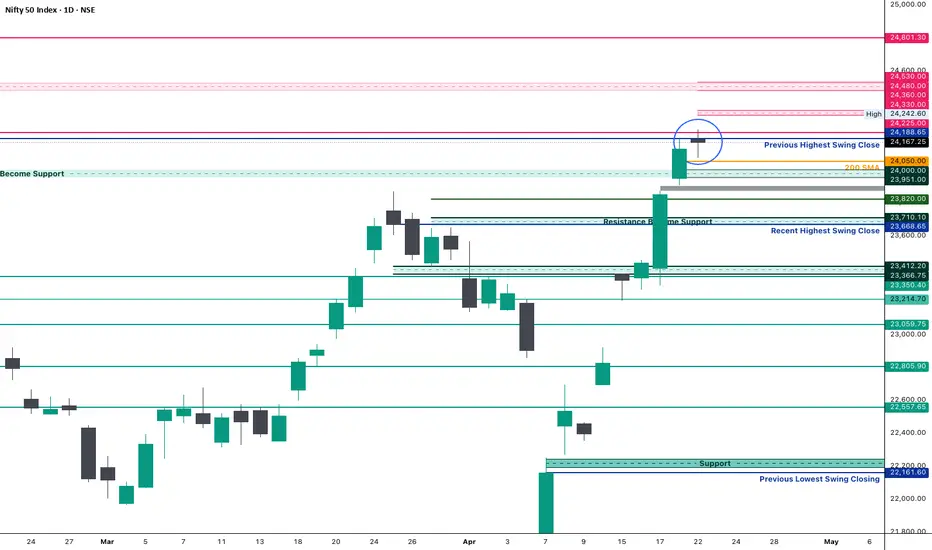
📌 Key Levels to Watch
🔺 Resistance Zones
• 24,190 ~ 24,225
• 24,330 ~ 24,360
• 24,480 ~ 24,540
🔻 Support Zones
• 23,950 ~ 24,000 (Immediate support)
• 23,820
• 23,660 ~ 23,710
• 23,500
• 23,400 ~ 23,430
• 23,200 ~ 23,190
🧘♂️ Final Thoughts
"Structure is key. When levels work, respect them. When they break, adapt."
Stay level-headed, stay prepared. Let the market show you the way.
✏️ Disclaimer ✏️
This is just my personal viewpoint. Always consult your financial advisor before taking any action.
Nfity levels - Apr 23, 2025Nifty support and resistance levels are valuable tools for making informed trading decisions, specifically when combined with the analysis of 5-minute timeframe candlesticks and VWAP. By closely monitoring these levels and observing the price movements within this timeframe, traders can enhance the accuracy of their entry and exit points. It is important to bear in mind that support and resistance levels are not fixed, and they can change over time as market conditions evolve.
The dashed lines on the chart indicate the reaction levels, serving as additional points of significance to consider. Furthermore, take note of the response at the levels of the High, Low, and Close values from the day prior.
We hope you find this information beneficial in your trading endeavors.
* If you found the idea appealing, kindly tap the Boost icon located below the chart. We encourage you to share your thoughts and comments regarding it.
Wishing you success in your trading activities!
Trading Tutorial for 22nd April 2025 Trading update for today on Index Nifty How one could have trades Nifty by following the process As a bonus, I have added and discussed banknifty also Enjoy the video

Nifty Analysis EOD – 21st April 2025 🟢 Nifty Analysis EOD – 21st April 2025 🔴
After the surprise expiry rally… comes the slowdown!
📌 Background
After the stunning 414-point move on the weekly expiry day, Friday’s holiday break created the perfect breather. The key question heading into Monday was:
“Will Nifty carry forward its momentum and breach 24,050? Or pause for breath?”
Turns out, the market chose both – initial enthusiasm, followed by exhaustion and consolidation.
📌 Today’s Price Action
Nifty opened at 23,949, right at the resistance zone of 23,950 ~ 24,000.
➤ The IB High was formed at 24,052, triggering a textbook IB Breakout just above the 200 SMA zone.➤ Price moved swiftly towards 24,188 – the Previous Highest Swing Close, and then... paused.
From there, a 50-minute tight consolidation followed – one of the narrowest ranges seen in recent sessions, signaling a temporary equilibrium between buyers and sellers.
Despite the bullish open and early breakout, Nifty closed at 24,133, just below the major resistance.
📊 Gladiator Strategy Parameters
ATR: 383.83
IB Range: 134.20
IB Type: Medium IB
IB Day: IB Breakout
Market Structure: Imbalanced
As per the Nifty Gladiator Strategy, the IB Breakout triggered around 10:45 AM, and the 1x IB target was achieved with clean follow-through.
📌 Technical Observations
📈 On the Daily Timeframe:
RSI stands at 65.53, now forming a potential RSI divergence.
Short RSI (3 of 3) is in the overbought zone.
Momentum remains intact, but the range is cooling off, cautioning intraday traders of potential traps ahead.
👉 A narrow range session or a false IB breakout is likely in the coming session.
📈 Index Performance
Nifty: +274 Points (+1.15%)
Bank Nifty: New All-Time High at 55,461, closing at 55,295 (+1.87% / +1,014 points)
Nifty 500: +324 Points (+1.5%)
Midcap: +1,316 Points (+2.5%)
Smallcap: +363 Points (+2.2%)
Broader market sentiment remained strong and outperformed Nifty.
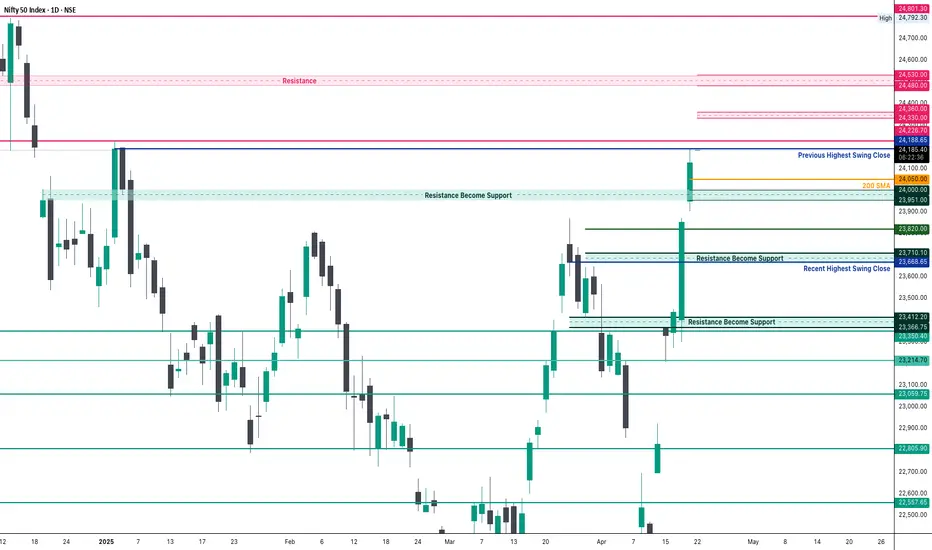
📌 Important Levels to Watch
🔼 Resistance Zones
➤ 24,190 ~ 24,225➤ 24,330 ~ 24,360➤ 24,480 ~ 24,540
🔽 Support Zones
➤ 23,950 ~ 24,000 (now immediate support)➤ 23,820➤ 23,660 ~ 23,710➤ 23,500➤ 23,400 ~ 23,430➤ 23,200 ~ 23,190
🧠 What’s the Trade Setup Now?
Don’t be overly bullish at highs – wait for follow-through or failed breakout confirmation.
If price holds above 24,190, then 24,330/24,480 becomes achievable.
Failure to sustain above 24,050 could trap late bulls.
Let Tuesday’s opening structure guide your bias.
🧘 Final Thought"Structure is key. When levels work, respect them. When they break, adapt."
Stay alert as we approach higher resistance zones—momentum remains but risk of whipsaws rises.
✏️ DisclaimerThis is just my personal viewpoint. Always consult your financial advisor before taking any action 🙏
Nifty at key Resistance - Pullback or Breakout !!!
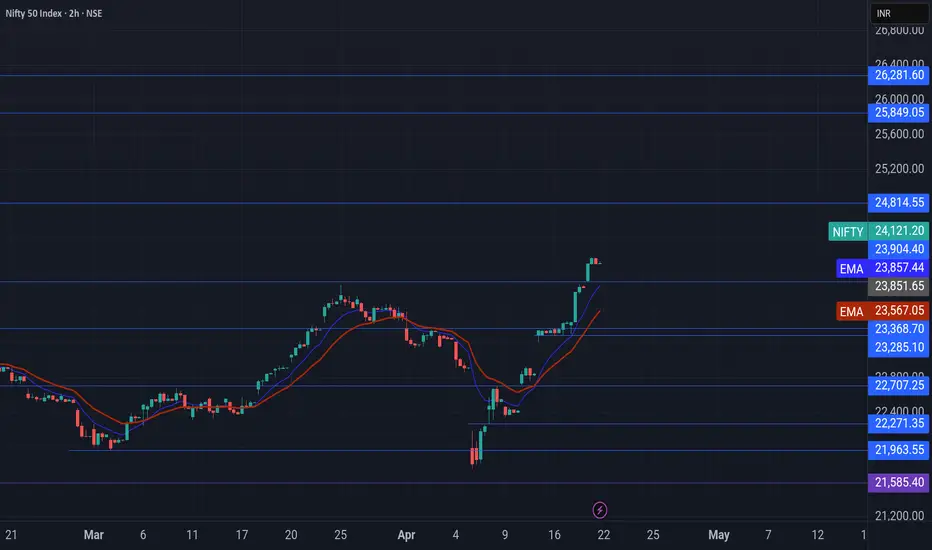
Nifty is currently trading around the important resistance zone of 24,250, which has acted as a supply level in the past. This zone is critical, and the market’s reaction here can guide the next leg of the move.
What to Watch:
Price is testing this resistance after a strong upmove.
If 24,250 holds, we may see a pullback or even a short-term reversal.
If the price breaks and sustains above 24,250, it would confirm bullish strength, and we can expect the next upside target near 24,750.
🔍 Key Levels:
Resistance: 24,250 (current test zone)
Support (pullback zone): 24,050 – 23,850
Next Bullish Target (if breakout holds): 24,750
What I'm Watching:
Price action and rejection patterns near 24,250
Volume confirmation on breakout
Candle structure for signs of exhaustion or momentum
Keep an eye on this level — the next few candles could give us important clues.

Nifty Probable Path for next 2 monthsNifty May spend some time till July August before beginning another 15% sell off.

#NIFTY Intraday Support and Resistance Levels - 22/04/2025Today slightly gap up opening expected in nifty. After opening if nifty starts trading above 24250 level then expected further bullish rally upto 24500+ level in today's session. 24000-24200 level will act as a consolidation zone for today's session. Any major downside only expected below 24000 level.

NIFTY BNF VALID TILL 3 WEEKS NIFTY AND BNF possible zone for nxt 3 weeks of MAY expiry expiry expected imp resistence and support zone

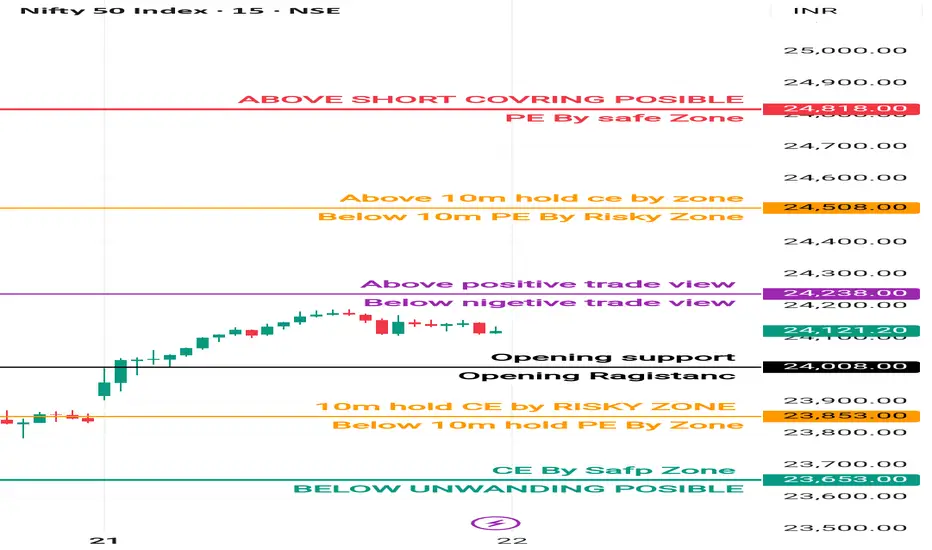
22 April important level trading zone #Nifty50 #option trading
99% working trading plan
👉Gap up open 24238 above & 15m hold after positive trade target 24508,
👉Gap up open 24008 below 15 m not break upside after nigetive trade target 24008, 23853
👉Gap down open 24008 above 15m hold after positive trade target 24238 , 24508
👉Gap down open 24008 below 15 m not break upside after nigetive trade target 23853, 23653
💫big gapdown open 23853 above hold 1st positive trade view
💫big Gapup opening 24508 below nigetive trade view
📌 Trade plan for education purpose I'm not responsible your trade
More education follow & support me
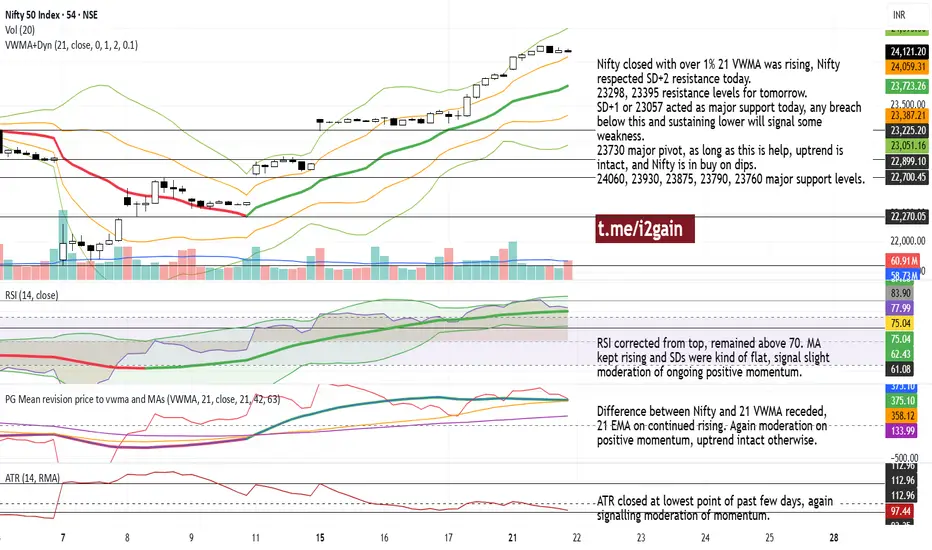
Nifty - moderation of +ve momentum seen on short period charts.Nifty closed with over 1% 21 VWMA was rising, Nifty respected SD+2 resistance today.
23298, 23395 resistance levels for tomorrow.
SD+1 or 23057 acted as major support today, any breach below this and sustaining lower will signal some weakness.
23730 major pivot, as long as this is help, uptrend is intact, and Nifty is in buy on dips.
24060, 23930, 23875, 23790, 23760 major support levels.
New AREA for better clarity!! As we can see after modifying our supply zone, it still seems to be in supply zone and a weekly candle needs to be closed above the given zone hence unless it sustains and gives a closing above given level it is risky to go long from here and make fresh positions so plan your trades accordingly and keep watching everyone

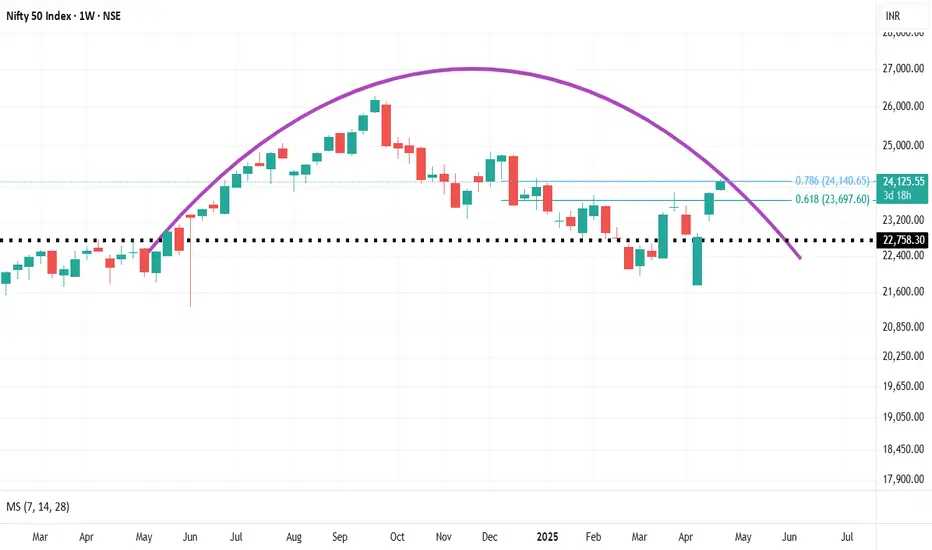
NIFTY TREND DIRECTIONNifty 24125 is on the verge of Fibonacci resistance 24134 coinciding with the rounding top pattern in weekly charts.
FII's have added Position in Nifty while they have windup their longs
We expect Nifty will drop to 0.618 fib support 23697 before gain strength.
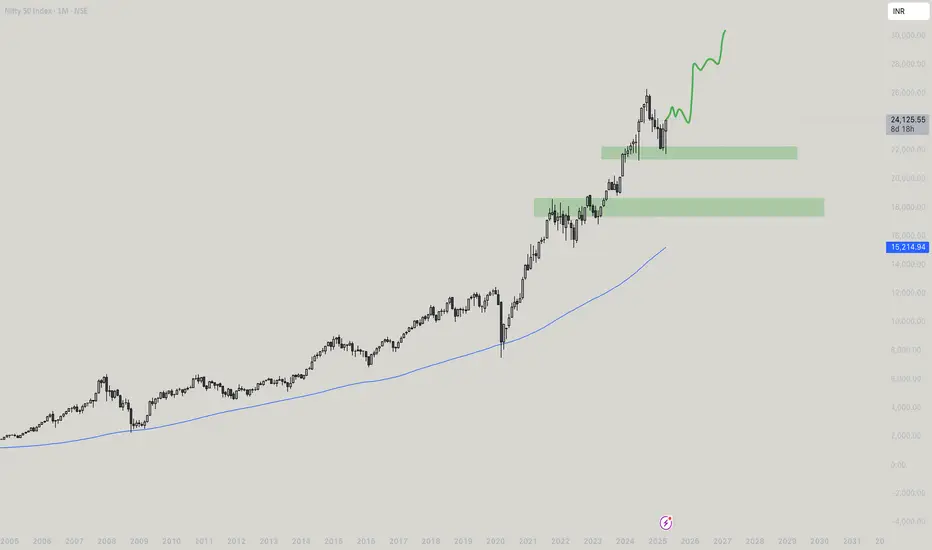
Nifty - Ready to ride to 30k?Alright guys, I’ve been getting this a lot — ‘What’s up with Nifty 50- Though am a pure crypto guy but onto the request i would analyse the index, and i feel its very bullish! And i searched some problem is there if someone analyse it - Its just a educational chart!! So the alleged doesnt disturb me lol.
This is a market profile
After a sharp correction earlier in April, the index formed a base with tightly packed POCs and balanced value areas between 22,400–23,400 levels. This region acted as a strong accumulation zone. Post that, a sharp breakout above the previous VAH (Value Area High) occurred, and price has now cleanly auctioned above 24,000. What’s impressive is the most recent structure: the POC, VAL, and VAH have all shifted higher in alignment, suggesting that acceptance at higher prices is taking place. The current POC at around 24,100 further validates that market participants are comfortable building volume at elevated levels. Unless we fall back below 23,800–23,900 (which is now a key demand zone), Nifty 50 is showing strength and could attempt the 24,400–24,600 range in the upcoming sessions.
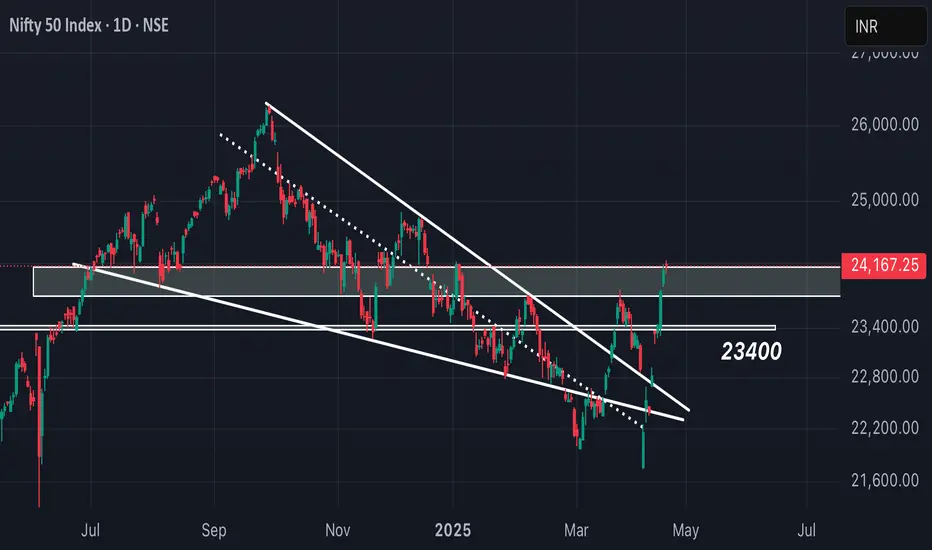
Another remarkable leap by Nifty. Channel top approaching. Nifty gained some serious ground again today closing 273.9 points up from previous close. The zone between 24202 and 24479 is the zone which stand between full blown Bull rally and some consolidation. The regressing parallel channel which started after Nifty made a high 26277 can be overcome if we get a closing above 24366. Immediate resistance is near 24202 before we reach there. Once we get a weekly closing above 24479 Bulls will take total control of the market. In such a scenario the Nifty can find resistance near 24830 before it can regain 25K levels.
If Nifty fails to conquer 24202, 24366 or 24479 then the supports will be near 23786. Bears can come back in picture if we get a closing above 23786. In such a scenario Mother and Father lines of hourly chart will play the supporting role at 23411 and 23101. Again near 23101 in addition to the Father line there is also Mid-Channel support thus this level should be considered a major support zone.
Since RSI of hourly chart is above 80 there is a chance of slight correction and consolidation which should also be looked at while taking fresh positions. RSI above 80 indicates that the positions might be just slightly be in the overbought zone.
Disclaimer: The above information is provided for educational purpose, analysis and paper trading only. Please don't treat this as a buy or sell recommendation for the stock or index. The Techno-Funda analysis is based on data that is more than 3 months old. Supports and Resistances are determined by historic past peaks and Valley in the chart. Many other indicators and patterns like EMA, RSI, MACD, Volumes, Fibonacci, parallel channel etc. use historic data which is 3 months or older cyclical points. There is no guarantee they will work in future as markets are highly volatile and swings in prices are also due to macro and micro factors based on actions taken by the company as well as region and global events. Equity investment is subject to risks. I or my clients or family members might have positions in the stocks that we mention in our educational posts. We will not be responsible for any Profit or loss that may occur due to any financial decision taken based on any data provided in this message. Do consult your investment advisor before taking any financial decisions. Stop losses should be an important part of any investment in equity.

Nifty Tutorial for 21-04-2024Trading update for today on Index Nifty How one could have trades Nifty by following the process
