NIFTY trade ideas
Nifty : In a buy trajectory ,Sitting at a major resistance Nifty : What a run from 21800.In a buy trajectory .Sitting at a major resistance
Nifty : What a run from 21800
In a Buy trajectory but sitting at a major resistance level as seen on the chart
Above 200 SMA ( If it ends the day like this )
MACD is looking Strong
( Not a Buy / Sell Recommendation
Do your own due diligence ,Market is subject to risks, This is my own view and for learning only .)

NIFTY S/R for 21/4/25Support and Resistance Levels:
Support Levels: These are price points (green line/shade) where a downward trend may be halted due to a concentration of buying interest. Imagine them as a safety net where buyers step in, preventing further decline.
Resistance Levels: Conversely, resistance levels (red line/shade) are where upward trends might stall due to increased selling interest. They act like a ceiling where sellers come in to push prices down.
Breakouts:
Bullish Breakout: When the price moves above resistance, it often indicates strong buying interest and the potential for a continued uptrend. Traders may view this as a signal to buy or hold.
Bearish Breakout: When the price falls below support, it can signal strong selling interest and the potential for a continued downtrend. Traders might see this as a cue to sell or avoid buying.
MA Ribbon (EMA 20, EMA 50, EMA 100, EMA 200) :
Above EMA: If the stock price is above the EMA, it suggests a potential uptrend or bullish momentum.
Below EMA: If the stock price is below the EMA, it indicates a potential downtrend or bearish momentum.
Trendline: A trendline is a straight line drawn on a chart to represent the general direction of a data point set.
Uptrend Line: Drawn by connecting the lows in an upward trend. Indicates that the price is moving higher over time. Acts as a support level, where prices tend to bounce upward.
Downtrend Line: Drawn by connecting the highs in a downward trend. Indicates that the price is moving lower over time. It acts as a resistance level, where prices tend to drop.
Disclaimer:
I am not a SEBI registered. The information provided here is for learning purposes only and should not be interpreted as financial advice. Consider the broader market context and consult with a qualified financial advisor before making investment decisions.

Nifty view for long termNifty view for upcoming days. This view is only for educational purpose only

#NIFTY Intraday Support and Resistance Levels - 21/04/2025Today will be flat opening expected in nifty. After opening 23850 will act as a resistance for today's session. If nifty starts trading below this resistance level then expected downside upto 23600 support level. Strong bullish rally expected in nifty if it's started trading above 23900 level. This upside bullish rally can goes upto 24200+ level in today's session.

Decoding NIFTYDear Traders,
I hope this message finds you well in your trading endeavours and personal pursuits. I am excited to share a compelling opportunity with you through a new NIFTY analysis that sheds light on the continuation of the market shift.
Preliminary Analysis Overview:
The downtrend from all-time highs has reached approximately 65% of its progression.
The recent upward surge is somewhat concerning due to concerns about a new trend or a correction within a correction in a larger degree (downtrend).
Let us discuss the key points to distinguish between these two scenarios:
The second leg of the downtrend is experiencing a correction, having completed approximately 89/90 days (which reinforces the interim trend’s completion).
The current correction is progressing rapidly, exhibiting limited sub-waves, which is typically not a characteristic of a motive wave (especially at the beginning of a trend).
The accompanying chart illustrates this point.
Let us elucidate the reasons behind this assertion:
Reason I:
As a staunch believer and ardent follower of Master WDG , the significance of time cannot be disregarded.
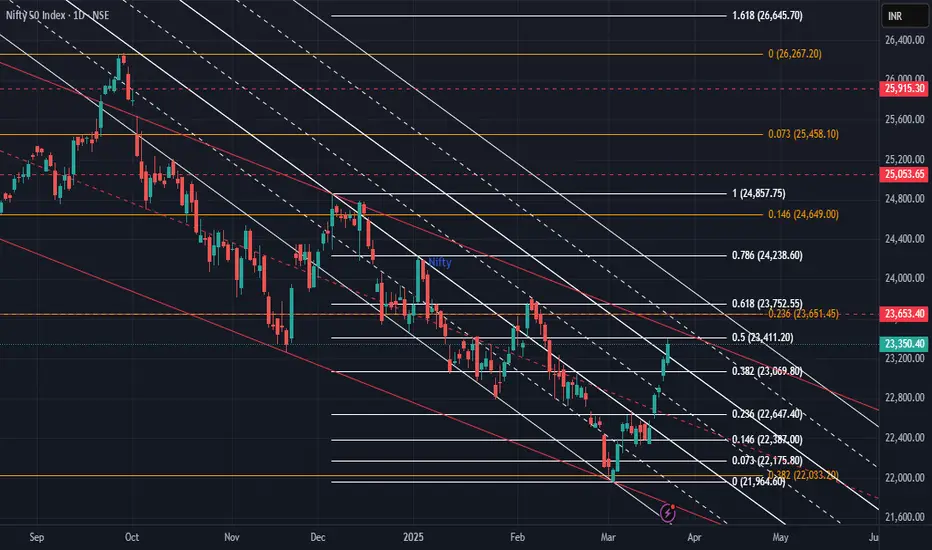
The primary downtrend commenced on September 27, 2024, and is poised to encounter a pivotal juncture, namely 180 days from its commencement on March 25, 2025 (Tuesday). This date also coincides with a cross-over with the Fibonacci value of 21 from March 4, 2025, where the interim correction commenced (21,964.60).
The 180D is a component of both the tetragram and the hexagram, and it also represents the midway point of a complete circle (360).
There is also another weird correlation, 4th MAR’25 & 25th MAR’25 both falls on Tuesday marking initiation & termination, the same day.
Reason II:
The geometric patterns of preceding and ongoing movements further support this analysis.
Analyzed both on a daily and weekly basis. The correction responded favorably to both Fibonacci retracements and trendlines. Upcoming resistance levels include:
RI: 23,590~23,600
RII:23,653 (23.6% of the downtrend)
RIII: 23,807
The previous support level is acting as a crucial resistance.
I also observe that there will not be a positive close in 3M charts.
Reference:
Important Dates to Remember:
As suggested, March 25, 2025, marks a significant juncture in the overall trend.
This is pure technical based analysis & does not involve any economic data releases other factors.
** Final Verdict: **
The market is anticipated to conclude its final leg of the downtrend, commencing from this Tuesday. However, the duration of this leg can range from 1 to 2 months.
I have identified several crucial dates for monitoring the upcoming trend. Stay informed!
**Strategy:**
Given the prevailing market conditions, adopting a bearish stance appears prudent.
Any sell positions executed after 23,550 will yield positive returns.
While it may seem counterintuitive to deviate from the prevailing trend, I am merely adhering to the established rules (without expressing any personal sentiment). However, it is inherently risky. Therefore, it is imperative to implement robust risk management strategies during such high-risk trades that are significantly influencing the market.
Additionally, please exercise caution regarding option buying. The low volatility environment is concerning, but it is anticipated to normalize as the downtrend progresses.
Fellow Traders,
The creation of this valuable analytical resource has required countless hours of dedication and effort. If you find it useful, I humbly request your support by boosting the idea and following me (updates will be provided via this post, new posts, and through minds). Your comments and thoughts on this idea are highly valued, and I am committed to engaging with each one personally.
Thank you for investing your time in reading this article.
Wishing you profitable and fulfilling trading endeavors!
Disclaimer:
Before concluding, I must emphasize that the insights shared are based on my analysis. It is crucial for you to conduct your own research and, if necessary, consult with a financial advisor before making any trading decisions. The dynamic nature of financial markets necessitates that your strategies align with your financial objectives and risk tolerance.
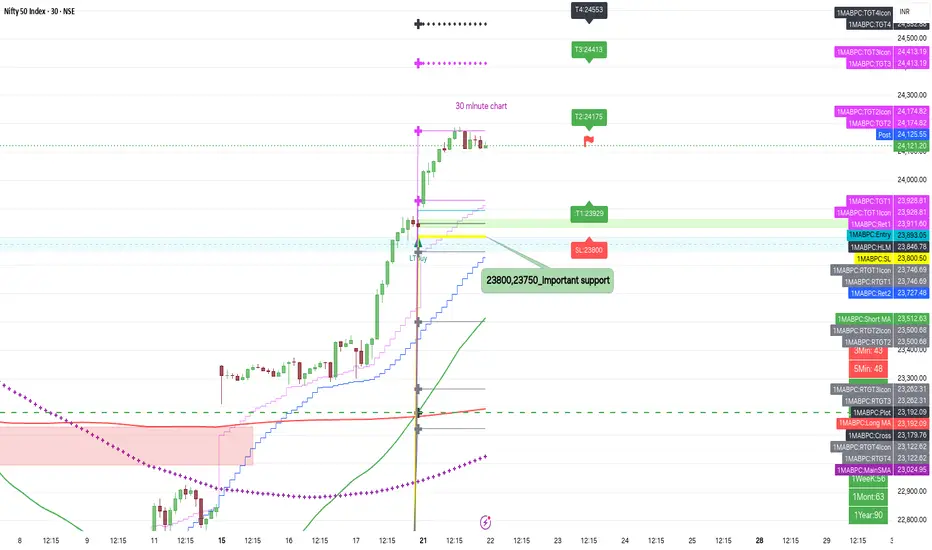
NIFTY -3OMHere are the levels for nifty to trade for tomorrow intraday and mark these levels on the chart. Fib retracement is drawn from all time high to swing low.
On weekly TF Price is bullish and the price is near the swing high. On Daily TF the price formed the inverted head and shoulders pattern. Price has stretched a lot on upside so if PDH is broken don't immediately enter the trade as it might be fake break out.
For bullish trades wait for the price to come down to the fib retracement levels and then on with any bullish pattern we can go long. For selling if price open gap up near to the 0.5 fib level which is marked with yellow that will be strict resistance if price make any bearish pattern there we can take sell side trades.
It is just my thoughts it does not mean it will exactly do the same it is just my view.
If you think I am wrong you can share you views below Thank you.
TIP: Always buy the at low and sell at high.
Here I mention only the high probability trades only. as intraday trader you can have multiple entries and exits according to your setups.
DISCLAIMER: This is my own analysis and you do your own analysis before you take any trade and I am not SEBI registered and contact your financial adviser before taking any trades .I am not responsible for your profit or loss. This is only for educational purpose and learning.
comment below if you have any doubts.
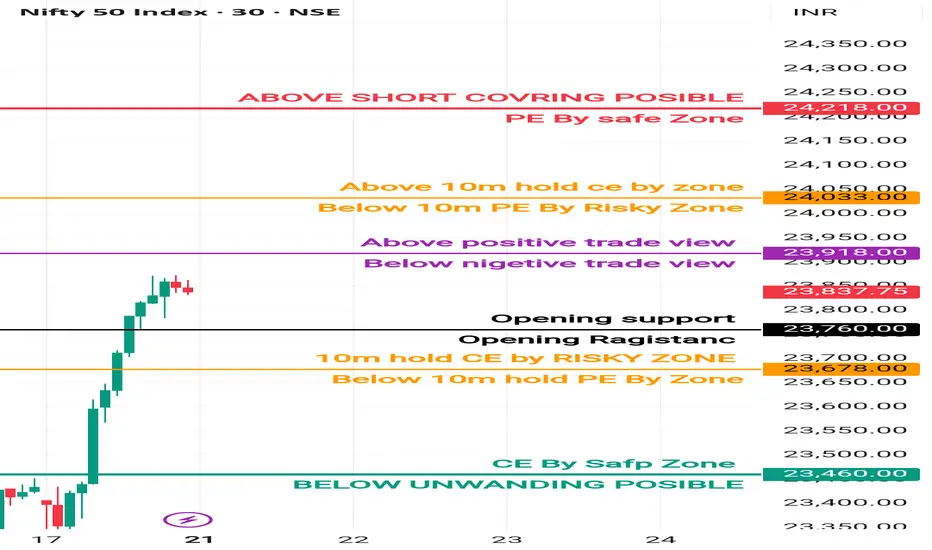
21 April Nifty50 trading zone
#Nifty50 #option trading
99% working trading plan
👉Gap up open 23918 above & 15m hold after positive trade target 24032, 24212
👉Gap up open 23918 below 15 m not break upside after nigetive trade target 23760, 23680
👉Gap down open 23760 above 15m hold after positive trade target 23912, 24032
👉Gap down open 23760 below 15 m not break upside after nigetive trade target 23684, 23460
💫big gapdown open 23680 above hold 1st positive trade view
💫big Gapup opening 24032 below nigetive trade view
📌 Trade plan for education purpose I'm not responsible your trade
More education follow & support me
Nifty Intraday Trade Setup | 21st April 2025Good Evening Traders,
Due to busy schedule we were not able to post Nifty intraday setup regularly but we will try to start posting Intraday ideas again.
On Thursday, Nifty opened with a gap-down due to fall in US markets on Wednesday but Nifty formed a double bottom around 21800 and is currently bullish so we saw good short-covering rally from 23330 to 23870.
Tomorrow, buy Nifty if sustains above 23870 for the targets of 23950 and above marked level. On the other side, sell if Nifty sustains above 23770 for the targets of 23680 and below marked level on the chart.
Expectations: Buy on dips in Nifty
Intraday Levels:
Buy Above - 23870
Sell Below - 23770
To motivate us, Please like the idea If you agree with the analysis.
Happy Trading!
InvestPro India

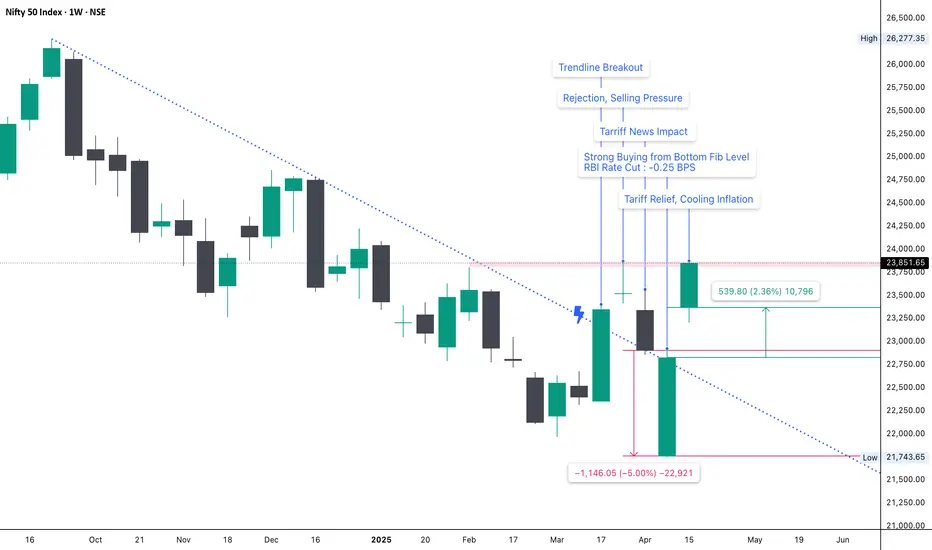
Nifty Weekly Wrap – 3rd Week of April ’25📉📈 Nifty Weekly Wrap – 3rd Week of April ’25 🔍
Bulls Charge Ahead – A 1,000+ Point Weekly Rally!
📌 Market Recap
What a week! Nifty 50 delivered a massive +1023 point gain – up 4.4% on a weekly closing basis – breaching the crucial 23,800 level and closing strong.
The rally was powered by a duo of positive triggers:
✅ Tariff relief
✅ Cooling inflation
This combination boosted sentiment and attracted strong institutional buying across the board.
📊 Technical Overview
Weekly & Monthly Candles: Bullish ✅
PCR Ratio: At 1.15, signaling a bullish tilt
RSI: Holding steady at 54 – trend and momentum both aligned
200 SMA on Daily Chart: At 24,050 – a crucial level to watch.
🔼 A breakout and close above this may trigger fresh buying and a possible shift in long-term sentiment.
📌 Bank Nifty Leadership
Bank Nifty almost hit its all-time high, clearly outperforming Nifty this week.
The rally wasn’t limited to just PSU or private players – both segments showed strong participation, giving more legs to this uptrend.
📍 Key Bank Nifty Level:
➡️ As long as 52,000 holds, the uptrend structure remains intact.
📉 Volatility Update – India VIX
India VIX cooled off by a sharp 24%, settling near 15 – further reinforcing the low fear + high confidence mood in the market.
📌 Market Sentiment Snapshot
Everything is aligning for the bulls:
✅ Sectoral rotation
✅ Robust earnings
✅ Institutional buying
✅ Easing macro concerns
🎯 Momentum is real, and as long as levels hold, dips might continue to be bought.
📌 Key Levels to Watch (Nifty)
🔼 Resistance Zones
▶️ 24,050 (200 SMA – critical level)
▶️ 24,190 ~ 24,225
▶️ 24,450
🔽 Support Zones
▶️ 23,820
▶️ 23,660 ~ 23,710
▶️ 23,400
▶️ 23,200
📋 Strategy Heading into Next Week
🧘 Stay with the trend, but don’t get complacent.
📌 Watch for a clean breakout above 24,050 with volume – it could set the tone for a fresh leg higher.
📌 On the downside, 23,660–23,820 is a key demand zone to track.
Let the structure develop – no need to predict every move. Follow price, stay flexible.
NIFTY - LONGNSE:NIFTY Weekly chart accumulations with positive head shoulder breakout shows new and strong upward trend may be occurs. On daily chart it shows double bottom breakout. Large cap stocks leads the market as in current scenario.

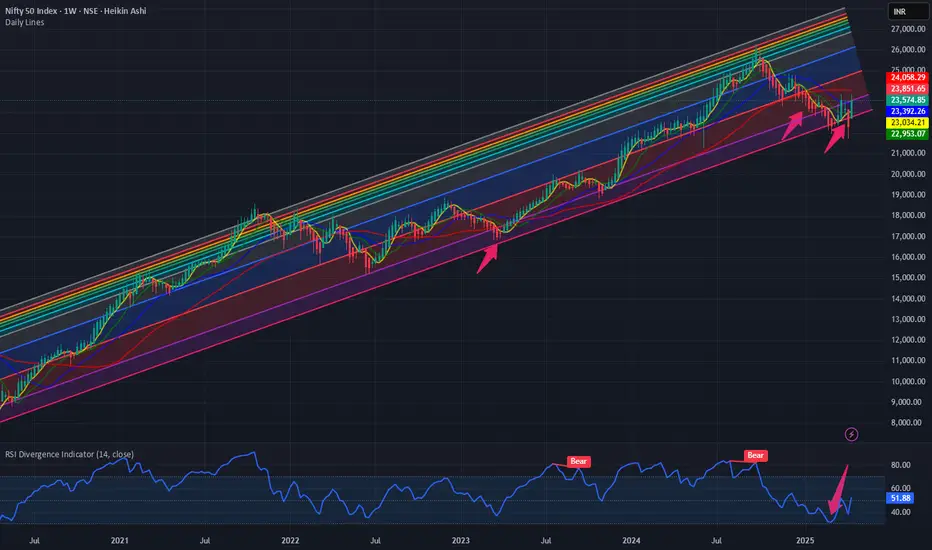
$NIFTY in bullish momentum. More upside-expectedDuring the last few days, we have been discussing the weakness in the US Dollar and the TVC:DXY index and what it means for the commodities like Gold ( AMEX:GLD ) and Oil ( TVC:USOIL ). But we never discussed the positive effect it has on the emerging markets like $NIFTY. The index NSE:NIFTY which consists of top 50 stocks based on market cap in India is having a positive momentum divergence after touching the lower bound of the upward sloping Fib retracement levels. Here in this blog space on 17th March we posted that NSE:NIFTY looks oversold and we might be ready for a bounce. We favored going long NSE:NIFTY at 22000. Since then, the RSI bottomed and we up 8% form the lows of 22032.
If we still follow the Fib levels from the last blog, the charts are telling us that we might be headed to 25000 before having any meaning full pullback. The index internals look healthy with RSI hovering around 50 and not in overbought territory. And the tailwind to all this is still the US Dollar story. Here we are targeting 95 in the TVC:DXY on a short-term basis. This might push NSE:NIFTY to 25000 and beyond.
Verdict : NSE:NIFTY rally continues to 25000; TVC:DXY to 95.

How to trade Nifty or stocks In this video I have explained how one should trade Nifty or stocks and also some lessons for initiating and exiting trading positions I love to teach and have been teaching and training guys on trading Enjoy the video

Nifty in Year 2025Elliott Wave Diagonal pattern. Nifty on completion of single leg of a longer Diagonal pttern on weekly TF. Expected move within this pattern to complete and move after its competion. Analysis included Time correction also.

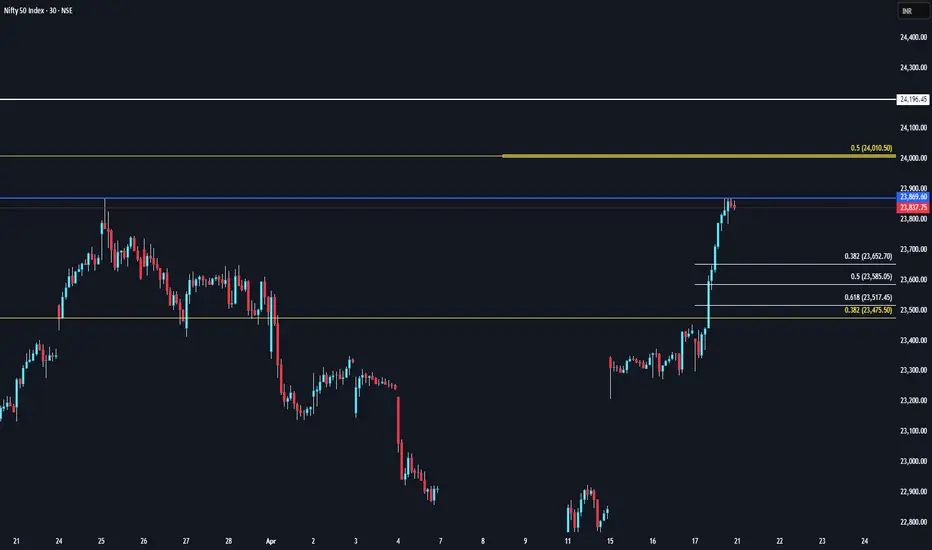
Nifty Closes 1000 Points Higher – Will It Catch Up with BNFIn a strong move, Nifty 50 surged by 1000 points to close at 23,851, compared to last week’s close. The index made a weekly high of 23,872 and a low of 23,207. As highlighted in last week's analysis, a breakout above 23,400 could push Nifty toward 23,900 — a target it missed by just 23 points.
However, an intriguing divergence has emerged between Nifty and Bank Nifty. While Bank Nifty has scaled a new all-time high, Nifty still trades significantly below its previous all-time high of 26,277. This sets the stage for an interesting dynamic: Will Nifty rally to close the gap, or will Bank Nifty face a correction?
What to Expect Next Week?
For the upcoming week, Nifty is expected to trade in a range between 23,200 and 24,414. Despite the bullish signals on the daily and weekly timeframes, the monthly chart remains weak, indicating that volatility is likely to persist until a broader trend confirmation.
S&P 500 Outlook: Bounce or Breakdown?
The S&P 500 index saw a mild pullback, closing around 80 points lower from the previous week’s close of 5,363. Our “sell on rise” strategy mentioned last week worked well, as the index dipped post-rally.
Now, things get technically interesting. On the weekly chart, the S&P 500 is forming a potential bullish W pattern and an inside bar. A breakout above the previous week's high of 5,481 could trigger upward targets of 5,551, 5,637, and 5,679.
However, on the downside, a break below 5,115 would reintroduce bearish pressure, which could have negative ripple effects across global markets.
Key Market Takeaways:
Nifty 50: Strong rally, but still below ATH. Watch 23,200–24,414 range next week.
Bank Nifty: At ATH, diverging from Nifty – crucial to monitor.
S&P 500: At a technical crossroads – potential for breakout or breakdown

Nifty Month expiry analysis - April final week.Nifty is looking positive on charts, and there is still room left for upside momentum . Last week’s closing at 23850 will work as an important support this week, and we can expect upside momentum to continue upto 24283-403 in the upcoming week. An important level to watch for upside is 23960. On the downside, if due to any fresh global uncertainties, Nifty breaches 23770, then it can slip to the range of 23500. All levels are marked in the chart posted.

Nifty Analysis & Trade Plan for Monday, 21st AprilNifty Analysis & Trade Plan for Monday, 21st April

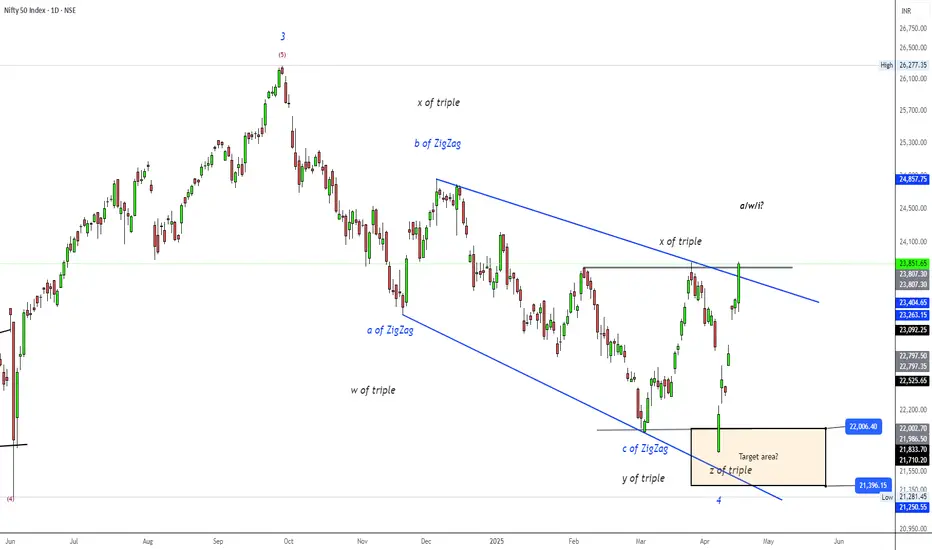
NIFTY50.....Correction ahead?Hello Traders,
the NIFTY50 has achieved my target range @ 23872 and touched the wave x² range of a possible triple pattern. This was inline to my analysis!
It will be interesting to observe how market will react in the coming one or two days ahead!
Chart analysis!
As to seen, there is a trend line drawn, and it has been touched three times, what makes this one really important! On the way up, there are some gaps to the upside, and sooner or later, they will be closed.
A first target for this scenario could be a range of about 22867 area.
The bulls have to watch the impulsive structure, that has been formed at the last days, 'cause it's possible to count an impulsive move up (1-2-3-4-5)! The next move, when it is done, is a correction within a wave 2, that more often than not retrace a 0.618 Fibo of wave 1 of any degree. New lows, while not expected, are just below @22194 a real scenario!
When the bulls are willing to extend the gains, one target range is around the wave x of the triple @ 24857 a realistic idea!
Well, friends, that's it for a quick note.
Happy Easter and a great week for all of you.....
Ruebennase
Please ask or comment as appropriate.
Trade on this analysis at your own risk.
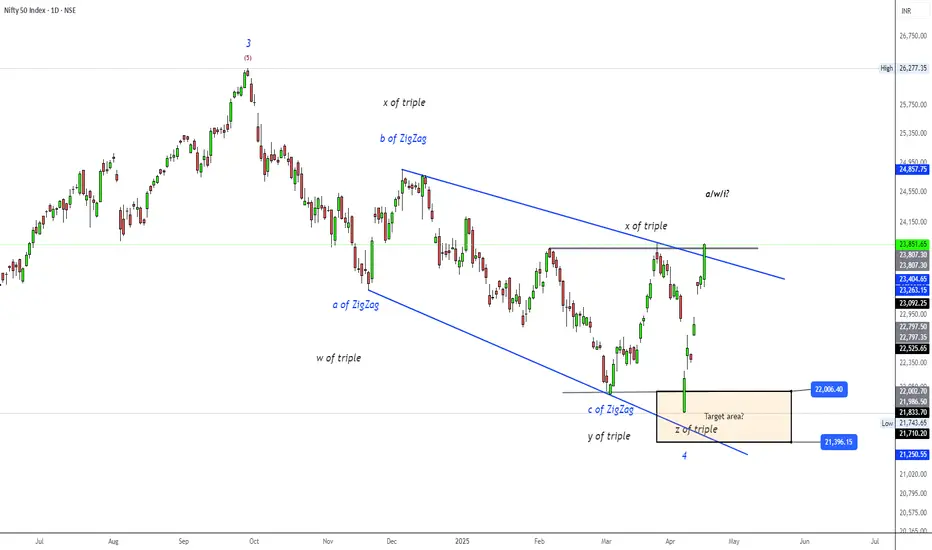
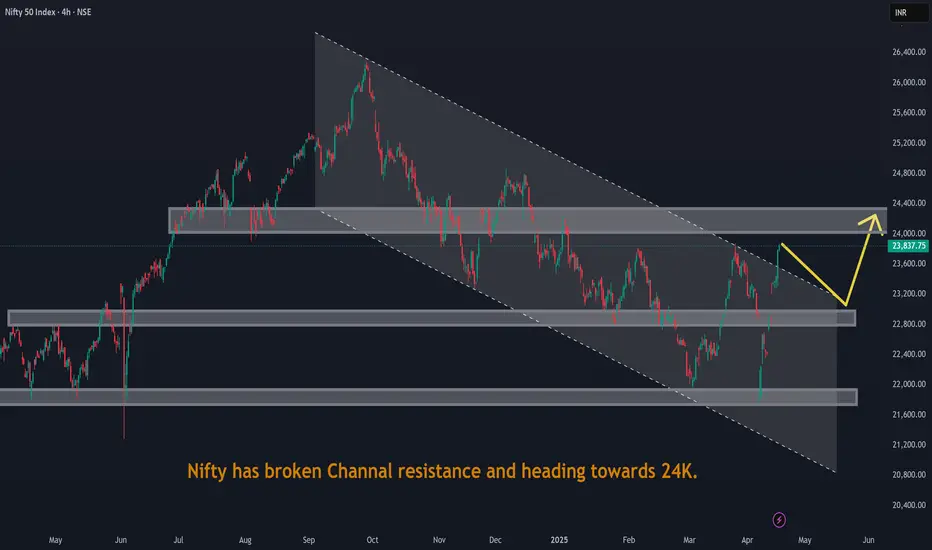
Nifty has broken Channal resistance and heading towards 24K.Nifty has broken Channal resistance and heading towards 24K.
Nifty has finished neutral triangle with BD trendline brokenneutral triangle complete in daily
chart and BD trendline is broken by the thrust with
time taken by thrust less than time
taken to form wave e
b and d are overlapping, there is price alternation btw b and d,
also b is 5 monowave
and d is 3 monowave
now price can go atleast till 75% of wave c
So market can go bullish now

NIFTY trading at RESISTANCE!! But!! As we can see NIFTY trading at final resistance after a strong breakout of 23400 level and now is trading around 23800 levels which has acted as a strong supply zone previously hence we can expect signs of REJECTION around here but if any case it sustains above the given level then we can also see a possible formation of inverted head and shoulders pattern in bigger time frame hence any closing above 24000 levels could show another strong unidirectional rally which can also lead to new ATH so plan your trades accordingly and keep watching everyone.
