NIfty FIIs: Bearish, with a net short position (-110,267), but reducing derivative exposure, suggesting profit-taking or lower conviction.
Clients and Pros: Leaning bullish, covering bearish bets (short puts: +40,324 for clients, +28,888 for pros; short calls: +70,551 for clients). Pros’ net long (+124,523) is positive.
DIIs: Cautiously bullish, with steady long futures (+78,089) and minimal changes, providing stability.
Sentiment: Mixed, with FIIs bearish, clients/pros bullish, and DIIs stabilizing. The bullish tilt from clients/pros aligns with option chain put writing.
NIFTY trade ideas

Nifty Analysis EOD – 17th April 2025🟢 Nifty Analysis EOD – 17th April 2025 🔴
Weekly Expiry Surprise – A One-Sided Short Covering Rally!
📌 Market Background
Before jumping into today’s rally, let’s briefly revisit yesterday’s analysis:
“Tomorrow’s weekly expiry + a holiday on Friday = high chance of a rangebound expiry day. Even if we get a gap-up due to global cues or news, I’m not expecting a breach above 23,500.”
This view was based on the recent expiry behavior and range contraction, especially with the past two days showing just a 170-point range and the last 10 expiries averaging a 192-point intraday range.
But today, the market did what it does best – surprised everyone!
📌 Today’s Price Action
Nifty gave a one-sided, mind-blowing short-covering rally on the weekly expiry day.
IB High + PDH Breakout triggered a sharp move early in the session.
Sustained price action above 23,550 in the morning session activated aggressive short covering.
This momentum carried Nifty all the way to an intraday high of 23,872.
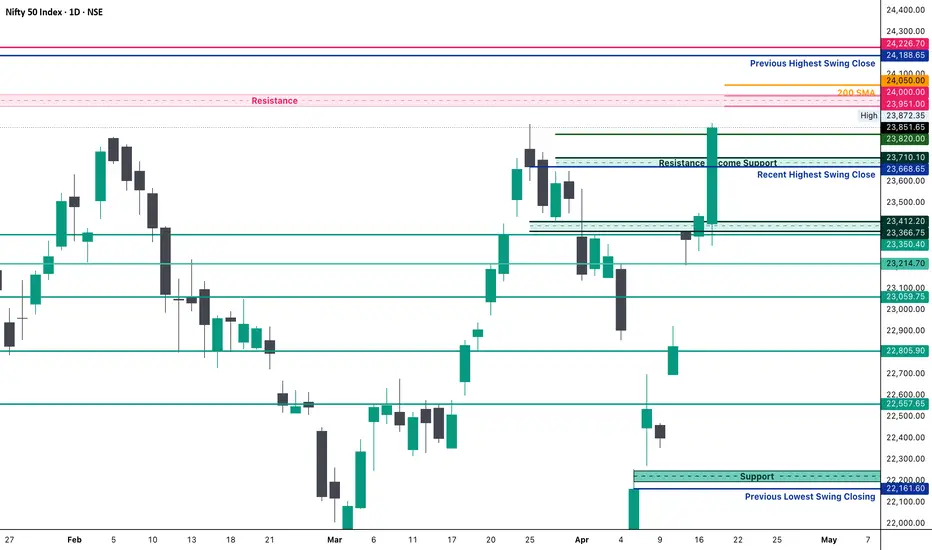
Closing at 23,852, Nifty registered a new swing breakout, moving above its previous highest swing close.
📊 Intraday Movement Stats
Total movement: 574 points 🔥
Nifty: +414 points (+1.77%)
Bank Nifty: +1172 points (+2.21%)
Nifty 500: +277 points (+1.3%)
Midcap: +312 points (+0.60%)
Smallcap: +61 points (+0.37%)
📌 Key Observations
Bank Nifty is now just 177 points away from its All-Time High closing.
Smallcap and Midcap underperformance suggests today’s rally was index-heavy – many portfolios might not reflect the same gains as Nifty.
📉 So, What’s Next at 23,850?
Honestly… don’t know!
Will it push to 24,050?
Or take a pause and pull back for a retracement?
With Friday being a holiday, we’ll have to wait until Monday for clarity.
📌 Important Levels to Watch
🔼 Resistance Zones
23,950 ~ 24,000
24,050
24,190 ~ 24,225
🔽 Support Zones
23,820
23,660 ~ 23,710
23,500
23,400 ~ 23,430
23,340
23,200 ~ 23,190
🧠 Strategy Insight
Don’t chase. Watch price action around 23,820–23,950.
Be flexible. Don’t marry a bias. Let Monday’s opening structure guide your next move.
Trading Mindset
I Am a Software Developer and a Passionate Trader
Over the past five years, I have explored nearly every aspect of trading—technical analysis, intraday trading, MTF, pre-IPO investments, options selling, F&O, hedging, swing trading, long-term investing, and even commodities like gold and crude oil.
Through this journey, I realized that **technical analysis is only about 20% of the equation**. The real game is **psychology and mindset**.
I have distilled my learnings into concise points below—insights that have shaped my approach and will continue to guide me in my version 2.0 of trading. I hope they prove valuable to you as well.
---
### **Position Sizing**
One of the most important aspects of trading is choosing the right position size. Your trade should never be so large that it causes stress or worry. Keep it at a level where you can stay calm, no matter how the market moves.
### **Set Stop-Loss and Target Before Placing a Trade**
Decide in advance when you will exit a trade—both at a loss (**stop-loss**) and at a profit (**target**). This helps maintain emotional balance, preventing extreme excitement or frustration.
### **How to Calculate Position Size**
- Use **technical analysis** to identify your **stop-loss** and **target**.
- Example: If CMP is ₹100 and your stop-loss is at ₹94 (₹6 risk per share), determine your risk tolerance:
- ₹3,000 risk ➝ **500 shares** (₹3,000 ÷ ₹6)
- ₹1,200 risk ➝ **200 shares** (₹1,200 ÷ ₹6)
- Adjust quantity based on how much you're willing to risk.
### **Setting Target Price & Risk-Reward Ratio**
The most important factor in setting a target is the **risk-reward ratio**. If your stop-loss is ₹6, your target should be at least **₹6, ₹9, or ₹12**.
### **Why Is Risk-Reward Important?**
Let’s say you take **10 trades**—5 go in your favor, and 5 go against you. If your risk-reward ratio isn’t favorable, you could end up in a loss.
Example:
- You **lose ₹6** in two trades → ₹12 total loss
- You **gain ₹3** in three trades → ₹9 total profit
- **Net result: -₹3 loss**
To ensure profitability, your **reward should be equal to or greater than your risk**. A **1.5x or 2x risk-reward ratio** is ideal.
### **Flexibility in Targets**
Even when the price reaches **Target 1**, you can **book partial profits** and let the rest run with a **trailing stop-loss**.
---
### **Managing Multiple Trades**
This is **very important**. If you're a beginner, **limit yourself to 2 trades**, and even if you're a pro, **avoid more than 3-5 positions**.
**Example:** If you have **₹2 lakh**, make sure you have **only 2 trades open at a time**. Add a third stock **only when you close another position**.
---
### **How to Deploy Capital**
Patience is key. If you have **₹1 lakh**, **divide it into 4-5 parts** and buy **in small chunks over time**.
**Why?**
The **nature of stocks** is to move in waves—rising, facing profit booking, then breaking previous highs. Instead of investing everything at once, **buy in staggered amounts** to ensure your **average price stays close to CMP**.
---
### **Avoid Market Noise**
When trading, **stay in your zone**.
Social media posts can make you feel **slow compared to others**, but they don't show the full picture. Avoid distractions like:
- Direct stock tips from **news channels**
- P&L snapshots from traders
- Following too many **analysts on social media**
Instead, **listen to expert views**, but stay disciplined with **your own strategy**.
---
### **Stock Selection**
Stock selection has **two elements—technical and fundamental** (I'll write a separate post on this).
Always **buy a stock that you can hold even in your darkest times**.
**Example:**
- Choose **blue-chip stocks** with **high market caps & strong promoter holdings**
- Never **buy a stock just because it’s in momentum**
- If a stock **turns into a forced SIP**, it’s not a good buy
Pick stocks with **a long-term story**—even if you fail to exit at the right time, you should be comfortable holding them.
---
### **Accept That It’s the Market, Not You**
Many traders fail because they **don’t admit that the market is unpredictable**.
Losses happen because of volatility, not necessarily poor strategy. **Example:**
- You lose a trade and **try improving your method** but face another hit
- Some losses **are simply beyond your control**
Most of what happens in the market is **not in your hands**—including stop-loss triggers. **Accept this reality,** and focus on **risk management** instead of revenge trading.
---
### **Keep Separate Trading & Investment Accounts**
Trading and investing **are different**. If you keep them **in the same account**, you’ll:
- **Book small profits** on investments
- **Hold short-term trades in losses**
Having **separate accounts** keeps **your goals clear**.
---
### **Don’t Let the Market Dominate You**
Even full-time traders **shouldn’t obsess over the market**.
Limit your **screen time to 2-3 hours during market hours**.
**Why?**
- You can’t **act on global markets until 9:15 AM IST**
- Even if a **war or tariff issue** arises, **you can’t do anything until market open**
- Overthinking leads to **over-trading**, which drains money
Instead, **invest time in developing new skills**.
---
### **Do What Suits You, Not Others**
If you're good at **swings, stick to swings**. If you're good at **intraday, do intraday**.
Don't follow **what works for a friend—trade based on what suits you**.
---
### **Avoid FOMO**
Don't **stress** if a stock jumps **20% in a day**.
Stock **accumulation zones, demand/supply areas, profit booking**, and **retests** happen **regularly**—opportunities will always come.
Even traders who claim they made **20% in a day** **don’t share how often they got trapped chasing stocks**.
---
### **Stop-Loss Is Your Best Friend**
No, stop-loss is your **best friend for life**.
**Example:**
- Suppose you **enter 10 trades in a month**.
- **6 do well** and you book profits.
- **4 go against you**, but instead of exiting, **you hold** because you believe they’ll recover.
- Next month, you **repeat this cycle**—adding more positions.
Over time, **this builds a portfolio of lagging stocks**, and suddenly, **your losses dominate your portfolio**.
---
Even Experts Face Losses
Even professionals with **advanced research teams lose money**.
Retail traders often **believe they can avoid losses by analyzing a few ratios**, but **losses are part of trading**.
A stop-loss ensures **you stay in the game long-term**—instead of holding onto losing trades indefinitely.
---
Take a Break & Restart
Taking breaks is **crucial**. If everything is going wrong, **don’t hesitate to press the reset button**—step back, analyze, and refine your approach. A fresh mindset leads to better trading decisions. (I’ll write a detailed post on this soon.)
nifty 24000-23400nifty 24000-23400
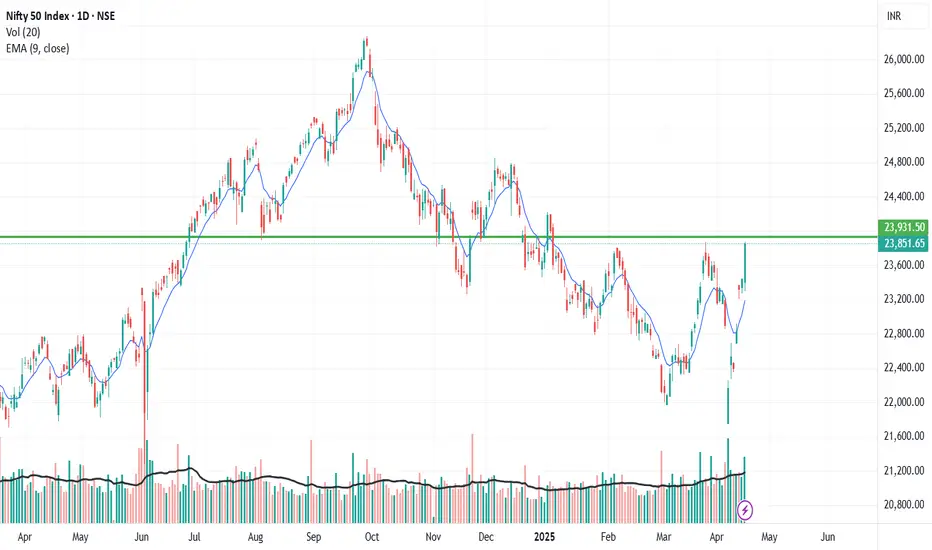
The Nifty 50 has been showing strong bullish momentum, reclaiming its previous swing high and closing at a three-and-a-half-month high

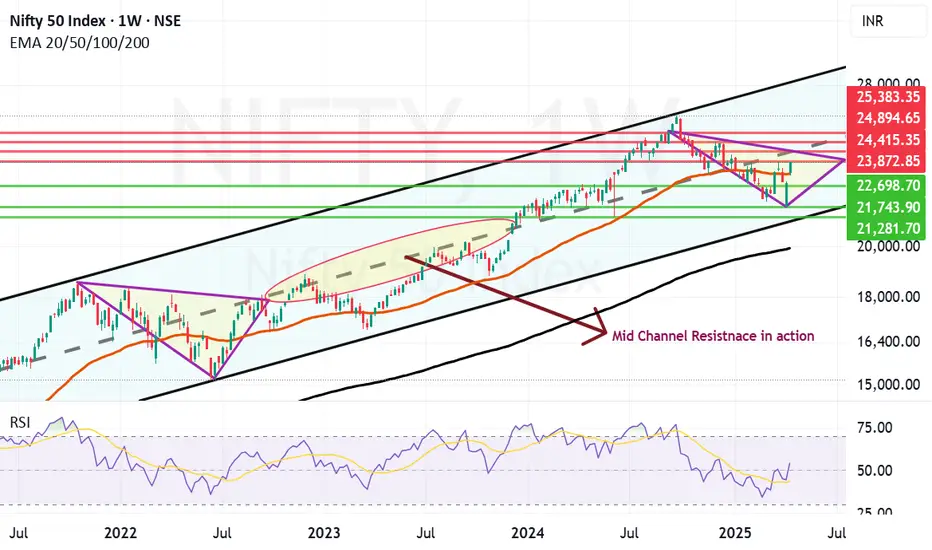
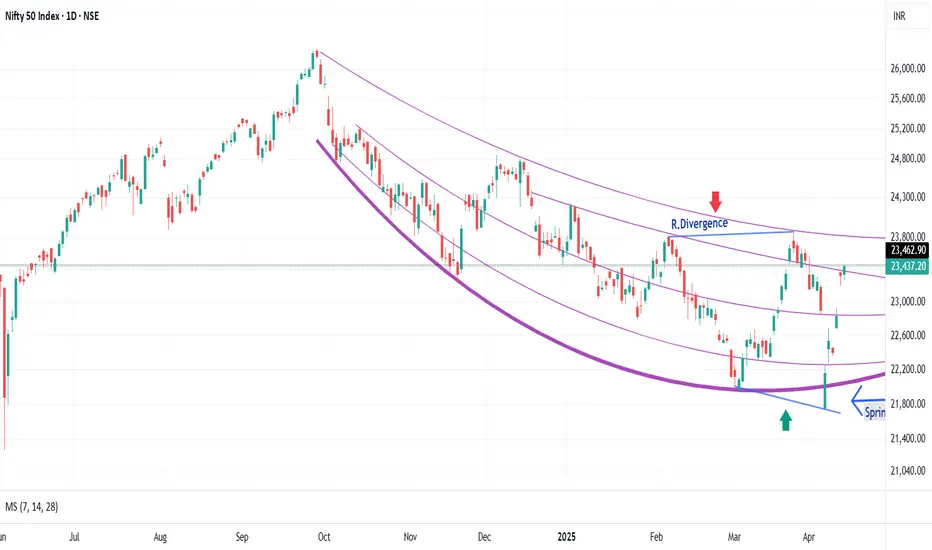
Nifty Parallel Channel and how things are shaping up. Nifty has closed strongly above the Mother line of Weekly chart this week. This should be considered a solid come back by Indian markets after the Trump Tariff induced fall. Indian economy is showing it's capability to bounce back on the back of strong rally in most of the sectors other than IT. Uncertainty in IT still looms as below par results that have started coming for might TCS and INfosys. We have a long weekend and uncertainties due to various announcements by global leaders regarding Tariffs can still spoil the party so one needs to be cautious in carrying huge positions over night and over the week especially in F&O trades.
Nifty travelling in a Parallel channel depicted above since 2020 is just below its Mid channel resistance at 24415. If you want to see the power of Mid Channel resistnace look at how it stopped Nifty between August 22 to December 23 below it. So Mid-channel resistnace should never be taken lightly. The area is depicted in the chart for your better understanding. Even before we reach that point of major resistance, Nifty has to counter strong resistance which was high of today and this week at 23872. Closing above 24415 can enable and empower Bulls to further push Nifty towards 24894, 25K and 25383 levels if the rally continues.
To know more about Parallel channel and how this Technical tool can be used to create wealth in stock market , you need to read my book The Happy Candles Way To Wealth creation. It is a highly rated book have a look at various reviews of the readers on Amazon. Both paperback and Kindle versions of the same are available on Amazon.
Nifty supports in case it is not able to cross and close above the resistnace zone of 23872 and 24415 will be 23272 (Strong Mother Line Weekly Support or 50 Weeks EMA) and 22698. A closing below 22698 in case of some adverse news or global development can empower the bears and can have potential to drag Nifty towards recent low of 21743 or 52 week low of 21281.
As of now things looking good but we have to wait and see the global and local developments over the weekend.
Disclaimer: The above information is provided for educational purpose, analysis and paper trading only. Please don't treat this as a buy or sell recommendation for the stock or index. The Techno-Funda analysis is based on data that is more than 3 months old. Supports and Resistances are determined by historic past peaks and Valley in the chart. Many other indicators and patterns like EMA, RSI, MACD, Volumes, Fibonacci, parallel channel etc. use historic data which is 3 months or older cyclical points. There is no guarantee they will work in future as markets are highly volatile and swings in prices are also due to macro and micro factors based on actions taken by the company as well as region and global events. Equity investment is subject to risks. I or my clients or family members might have positions in the stocks that we mention in our educational posts. We will not be responsible for any Profit or loss that may occur due to any financial decision taken based on any data provided in this message. Do consult your investment advisor before taking any financial decisions. Stop losses should be an important part of any investment in equity.
Nifty important FIbonacci levels from Previous year closeNIfty important FIbonacci levels from previous year close.
Todays closing was above previous year close.
Previously failed to break previous year close. Lets see what happens.

Nifty 50 review as the new FY started As disclosed, in the chart drawings zones shown,clearly indicates that the BMI Nifty 50 has managed to bounce from the Jan month important zones.
Now, the nifty is trying to challange the bullish zone resitance once again. It will be interesting now to see, the near future.

NIFTY 50 4hr analysis (bullish) (16/04/2025)Welcome back folks
havent been posting lately because of the hectic schedule,
the analysis is based majorly on the current emotions of the speculators that is relief bullish rally
- possible gap up tomorrow, if market makers decide to book profits tomorrow then its blood bath again imo
- either a follow up range or breakout above marked figures in the chart is expected
- i personally believe to not overthink this and be a part of the crowd and hope for the latter
trade cautiously, i wont be posting index charts anytime soon now, only stocks if schedule allows me
feel free to chat with me in the comments
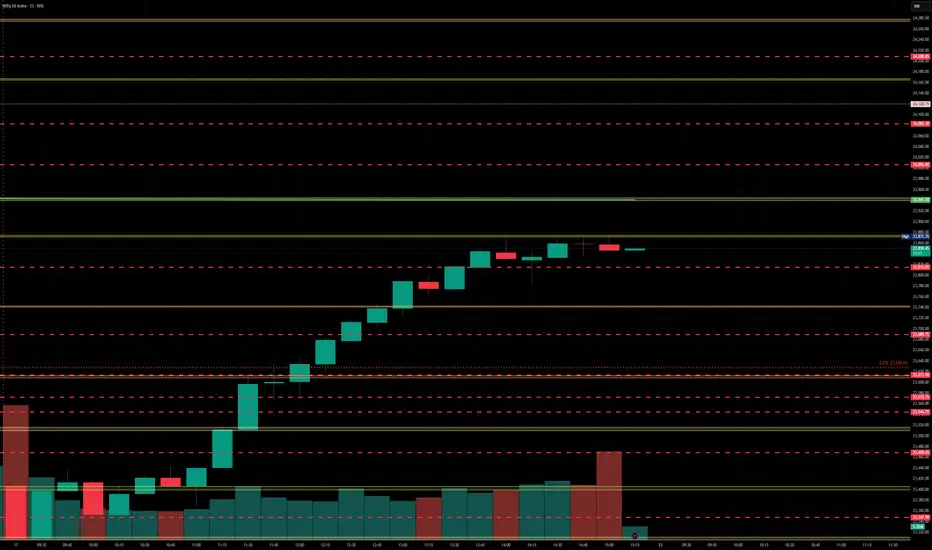
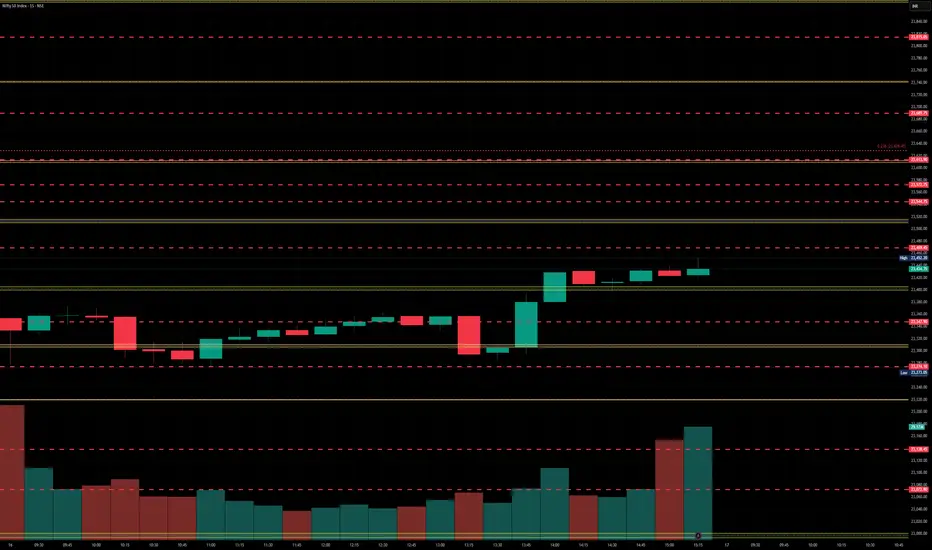
Nifty levels - Apr 21, 2025Nifty support and resistance levels are valuable tools for making informed trading decisions, specifically when combined with the analysis of 5-minute timeframe candlesticks and VWAP. By closely monitoring these levels and observing the price movements within this timeframe, traders can enhance the accuracy of their entry and exit points. It is important to bear in mind that support and resistance levels are not fixed, and they can change over time as market conditions evolve.
The dashed lines on the chart indicate the reaction levels, serving as additional points of significance to consider. Furthermore, take note of the response at the levels of the High, Low, and Close values from the day prior.
We hope you find this information beneficial in your trading endeavors.
* If you found the idea appealing, kindly tap the Boost icon located below the chart. We encourage you to share your thoughts and comments regarding it.
Wishing you success in your trading activities!
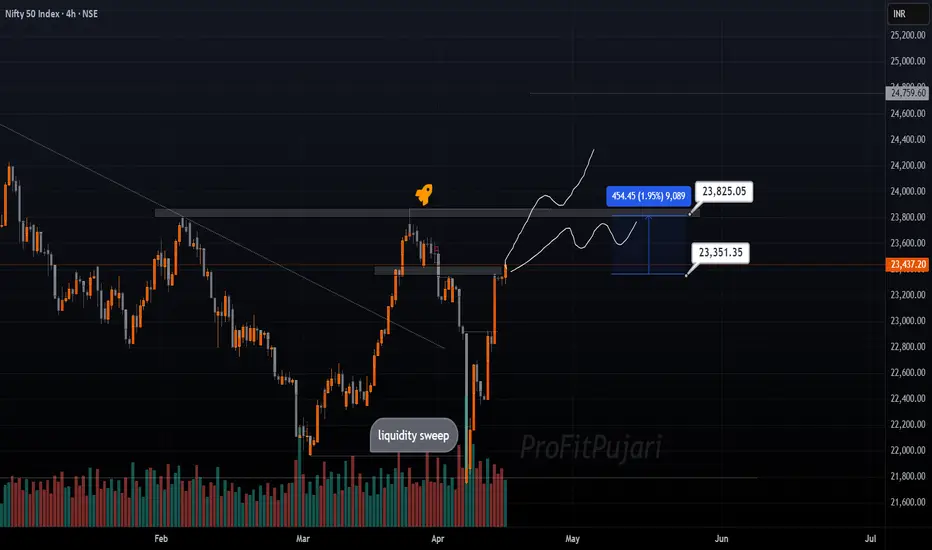
Nifty 50 Trendline Breakout – Retest Buy Setup📌 Trade Setup:
✅ Entry (Buy) Zone:
Buy on retest: Around 23,750–23,850 (previous resistance and breakout zone).
Aggressive buy: Market price at 23,849, but risk-reward is slightly unfavorable here.
🎯 Target (Short-term Swing):
Target 1: 24,200 (minor resistance)
Target 2: 24,800 (next major swing high zone)
🛑 Stoploss:
Conservative: Below 23,000 (safe below breakout and 50 EMA)
Aggressive: Below 23,200
for educational purposes only

#NIFTY Intraday Support and Resistance Levels - 17/04/2025Slightly gap down expected in nifty. After opening if nifty sustain above 23300 level then expected nifty will consolidated between 23300 to 23500 level in today's session. Any strong rally in index only expected breakout of this level. Strong upside rally expected if nifty starts trading above 23500 level in today's session.

Nifty trend directionAfter a long struggle, Short covering helped Nifty to rose to 23438.
Call writers were aggressive till 11:00 am writing around 44M calls and finally they gave up at 13:55 and started covering their positions and helped Nifty to rose to 23438
PUT writers started booking profits form 10:15 and harvested their gain for 26M PUTS.
Meanwhile FII's booked their profits for 1,721 future contracts
Based on the above facts we believe 23355 will act as a trend changer for today's trade.
23400 is here but weekly candle is yet to close! As we can see NIFTY did manage to close itself above 23400 level showing signs of bullishness but this level has acted as a strong support previously and hence expected to act as a strong resistance. Hence we must wait for a weekly candle to close above 23400 level for confirmation for further upmove else our view is bearish and can result in good fall as the gap has already been filled and can result in sharp fall as it is already trading in strong supply zone so plan your trades accordingly and keep watching.

17 April Nifty50 trading zone #15 April Nifty50 trading zone
#Nifty50 #Toady #NIFTYBANK #options
99% working trading plan
👉Gap up open 23481 above & 15m hold after positive trade target 23612, 23888
👉Gap up open 23481 below 15 m not break upside after nigetive trade target 23380
👉Gap down open 23380 above 15m hold after positive trade target 23481, 23612
👉Gap down open 23380 below 15 m not break upside after nigetive trade target 23238,
💫big gapdown open 23238 above hold 1st positive trade view
💫big Gapup opening 23612 below nigetive trade view
📌 Trade plan for education purpose I'm not responsible your trade
More education following me

Nifty 17.04.2024 Analysis As of April 16, 2025, Foreign Institutional Investors (FIIs) have exhibited a mixed stance on Indian equities, particularly the Nifty 50 index.
Tickertape
+1
Reuters
+1
Recent FII Activity:
April 16, 2025: FIIs were net buyers in the cash segment, purchasing ₹15,286.90 crore and selling ₹11,350.48 crore, resulting in a net inflow of ₹3,936.42 crore.
The Economic Times
+2
Business News Today
+2
Trendlyne.com
+2
Month-to-Date (April 1–16, 2025): Despite the positive activity on April 16, FIIs have been net sellers overall, with gross purchases of ₹143,676.11 crore against gross sales of ₹168,315.70 crore, leading to a net outflow of ₹24,639.59 crore.
Business News Today
Market Impact:
The Indian markets have shown resilience amid global uncertainties. Domestic institutional investors (DIIs) have continued to invest, cushioning the market against FII outflows. Analysts are favoring sectors less exposed to international volatility, including banking, power, telecoms, autos, and consumer goods.
While FIIs have been net sellers in April, the positive activity on April 16 suggests a potential shift in sentiment. However, sustained inflows would depend on global market stability and domestic economic indicators.
Reuters
For real-time updates on FII and DII activities, you can refer to the following resources:
DII ** 16-Apr-2025 11,065.94 13,578.71 -2,512.77
FII/FPI * 16-Apr-2025 15,286.90 11,350.48 3,936.42

Nifty near the trendline resistance now after another good day.Nifty has cleared the 200 days EMA or the Father line on Daily chart. But in the hourly chart depicted here has hit a resistance zone which happens to be a trend line resistance.
RSI of Nifty is currently above 73 and the scope for upside is there but limited. With a shortened week tomorrow we will have a weekly closing. So a positive closing tomorrow can place us in a good space for a next week. However with everchanging trade war scenario it is difficult to guess if investors will encash their long positions or carry them forward into the next week.
The next resistances for Nifty remain at 23456, 23621, 23713, 23784 and 23915 before Nifty regains 24K levels. The support zones for Nifty remain at 23292, 23156, (Mother and Father lines of hourly chart are close by near) 23017 and 22980. So this zone will be a strong support. A closing below 22980 can drag Nifty down towards 22771 or even 22361 region.
Also one must keep an eye on Reliance result tomorrow. As it is a index power house it can single handedly make or break the weekly closing. Flat or positive closing tomorrow will be very helpful for the bull run to continue.
Disclaimer:The above information is provided for educational purpose, analysis and paper trading only. Please don't treat this as a buy or sell recommendation for the stock or index. The Techno-Funda analysis is based on data that is more than 3 months old. Supports and Resistances are determined by historic past peaks and Valley in the chart. Many other indicators and patterns like EMA, RSI, MACD, Volumes, Fibonacci, parallel channel etc. use historic data which is 3 months or older cyclical points. There is no guarantee they will work in future as markets are highly volatile and swings in prices are also due to macro and micro factors based on actions taken by the company as well as region and global events. Equity investment is subject to risks. I or my clients or family members might have positions in the stocks that we mention in our educational posts. We will not be responsible for any Profit or loss that may occur due to any financial decision taken based on any data provided in this message. Do consult your investment advisor before taking any financial decisions. Stop losses should be an important part of any investment in equity.

Scalping with ATM Options Using Candle + OI Confirmation!Hello Traders!
If you love quick entries and fast exits with defined logic, then ATM Option Scalping is your game. But scalping without confirmation often leads to stop-loss hits. That’s why combining candlestick structure with live Open Interest (OI) data gives you a serious edge. Let’s break down the exact setup I use to scalp with ATM options in Nifty & BankNifty .
Why ATM Options for Scalping?
Better Liquidity: ATM strikes have tight spreads and high volumes, making execution quick and efficient.
Quick Premium Movement: Even small index moves reflect fast in ATM premiums.
Less Theta Decay (Intraday): Within first half of day, theta doesn’t hurt much. Scalping avoids time decay traps.
Scalping Strategy: Candle + OI Confirmation
Step 1 – Watch 5-Min Candle Setup:
Look for strong breakout candles, bullish/bearish engulfing, or reversal candles at key zones like VWAP/PDH/PDL.
Step 2 – Confirm with OI Shift:
Check ATM strikes on option chain.
Put OI rising + Price sustaining = bullish confirmation.
Call OI rising + Price rejecting = bearish confirmation.
Step 3 – Take Trade in ATM Option:
Enter CE or PE near breakout candle close with proper SL below/above that candle.
Step 4 – Exit Fast (Scalp Mode):
Book partial profits at 30–40% or when next resistance/support is hit. Avoid overholding!
Bonus Risk Management Tips
Avoid Trading Near News or Events: OI gives false signals in high volatility zones.
1 Trade = 1 Risk Unit Only: Do not revenge trade. Scalping is about accuracy, not frequency.
Trade only when both candle + OI align: No confirmation = no entry.
Rahul’s Tip
Let the chart speak, but let the OI validate. When both agree — that’s where scalpers win big.
Conclusion
Scalping with ATM options using candle structure + OI shift is a powerful setup if executed with discipline. It’s fast, clean, and logical. Focus on 1–2 setups a day — and make them count.
Do you scalp ATM options? Share your entry rules or struggles in the comments below!
Is Nifty gearing up for bullish rally?Nifty 50 Daily Chart Analysis (Heikin Ashi)
Nifty is trading around 23,437, showing a strong short-term rebound from recent lows near 22,260. The price has moved above the red SuperTrend resistance cloud and is now testing key Fibonacci levels.
Key Observations:
SuperTrend Cloud has turned green again, suggesting a bullish shift in trend.
Fibonacci Levels:
0.236 at 22,802 (strong support).
0.382 at 23,454 — current price is near this resistance zone.
0.5 at 23,981 and 0.618 at 24,508 are higher resistance levels to watch.
Trendline Resistance (dashed line) is approaching — a breakout above that could confirm further upside.
EMA Stack Strength Meter is turning positive (green) again, showing improving momentum.
Volume remains stable, no major spikes yet.
Summary:
Short-Term: Bullish momentum is picking up. Break above 23,500 can lead to a move toward 24,000+.
Medium-Term: Watch for a clean break and close above 23,981 to confirm trend reversal.
Downside Risk: If price fails to hold 23,200–23,000 zone, it could retest 22,800 support.
The trend is cautiously bullish but facing resistance. Bulls need follow-through above 23,500–24,000 for sustained upside.

Nifty levels - Apr 17, 2025Nifty support and resistance levels are valuable tools for making informed trading decisions, specifically when combined with the analysis of 5-minute timeframe candlesticks and VWAP. By closely monitoring these levels and observing the price movements within this timeframe, traders can enhance the accuracy of their entry and exit points. It is important to bear in mind that support and resistance levels are not fixed, and they can change over time as market conditions evolve.
The dashed lines on the chart indicate the reaction levels, serving as additional points of significance to consider. Furthermore, take note of the response at the levels of the High, Low, and Close values from the day prior.
We hope you find this information beneficial in your trading endeavors.
* If you found the idea appealing, kindly tap the Boost icon located below the chart. We encourage you to share your thoughts and comments regarding it.
Wishing you success in your trading activities!
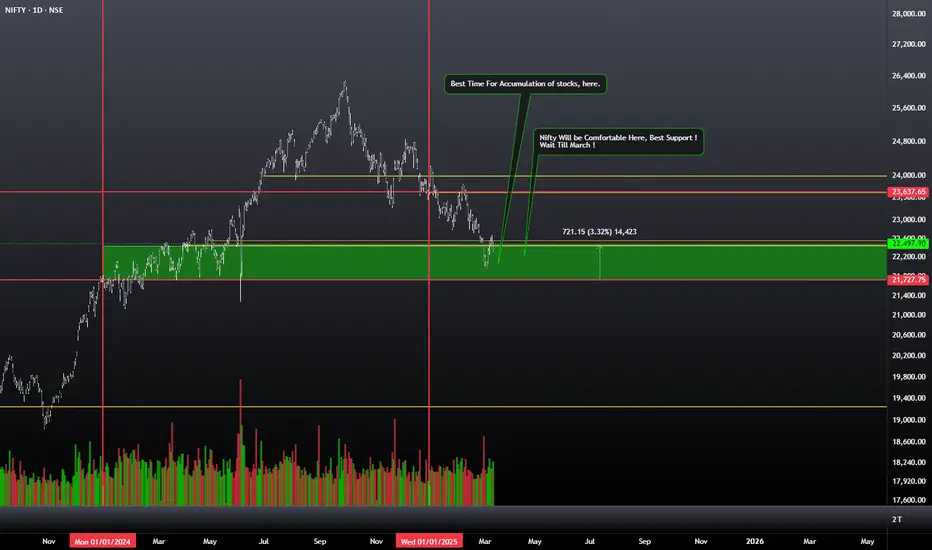
March Pain Point in $NSE:NIFTY | Best Support is Coming !NSE:NIFTY
Hi
Green Area Is Best Time to Accumulate Stocks.
Best Support, and Stocks with Low Beta are the Gems So Accumulate them with Nifty Supports.
Too Much is Happening, like Nifty Rebalancing, Nifty50 Next Rebalancing, Global Sentiments with Indian Govt Love for Tax Policy.
Be Prudent !
Let Them Short and Long on the Other Side.
Make Good Position on Nifty Stock !
thanks
nifty 23500nifty 23500
The NIFTY 50 index is currently at 23,426.15 INR, reflecting a 0.42% increase from the previous close. Today’s trading range has been between 23,273.05 INR and 23,430.95 INR

Expecting to reach 23412In order to balance price, buyers must offer fair value at 23,412 on the 4H timeframe. If that level is reached, a decline may follow; otherwise, we may see a run on liquidity.If you see the 1H candle wick down into the 1H IFVG , then in my view, buyers are likely planning to seek or trigger a run on liquidity at 23,412.

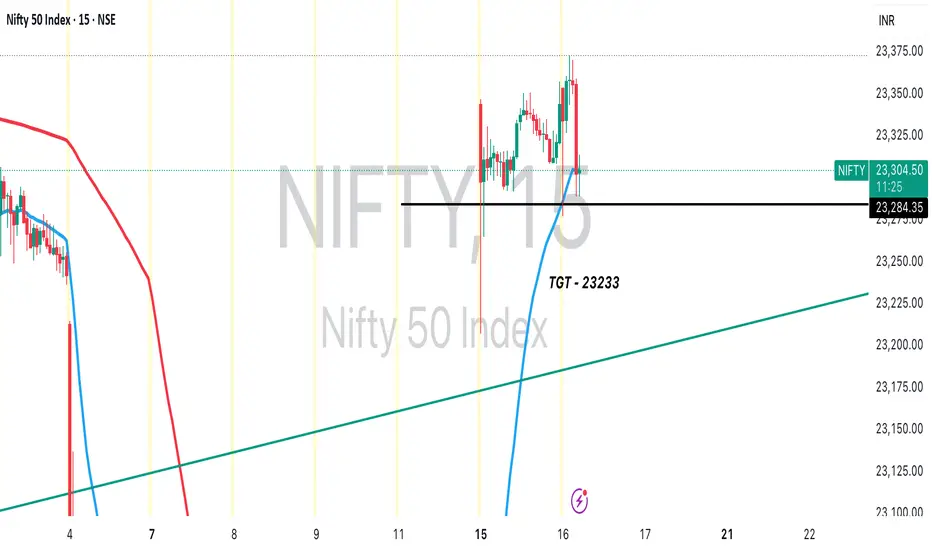
NIFTY Shorting OpportunityNIFTY is overstretched and we can expect some selling to happen now.
The price is unable to form new Highs.
We can expect a correction to 23,233 levels on an intraday basis.