Learning#03 : VWAP in Intraday TradingLearning#03 : VWAP in Intraday Trading
📊 VWAP in Intraday Trading: The Market’s Fair Price GPS
Ever wondered if there’s a level that shows where the real trading action is happening? That’s exactly what VWAP does — it’s like a volume-weighted compass that intraday traders use to orient themselves in the market.
It’s not just another line on your chart. VWAP reflects where institutions and volume-heavy participants are active. That’s why understanding how price interacts with it can give you a serious edge.
Let’s break it down 👇
🧠 What is VWAP?
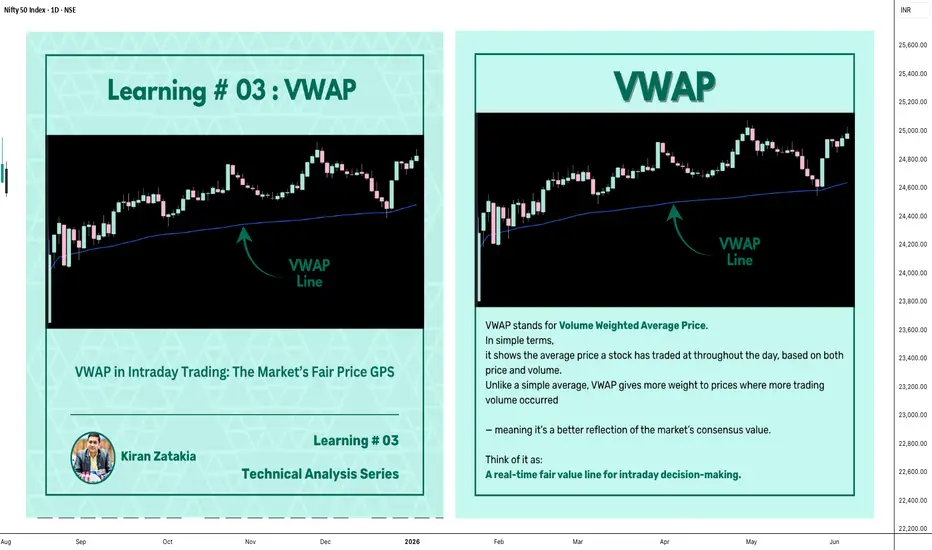
VWAP stands for Volume Weighted Average Price.
In simple terms, it shows the average price a stock has traded at throughout the day, based on both price and volume.
Unlike a simple average, VWAP gives more weight to prices where more trading volume occurred — meaning it's a better reflection of the market’s consensus value.
Think of it as:
A real-time fair value line for intraday decision-making.
📈 Why VWAP Matters for Intraday Traders
VWAP acts as an intraday anchor. It tells you whether the price is currently trading above or below the day’s volume-weighted average — giving you quick insight into who's in control.
Here’s how to interpret it:
When price is above VWAP, buyers are in control and the bias is bullish.
When price is below VWAP, sellers are dominating and the bias is bearish.
When price is hovering near VWAP, the market is undecided, consolidating, or lacking direction.
In short, VWAP tells you who’s winning the intraday tug of war — and whether it’s even worth stepping in.
⚙️ How to Use VWAP in Your Intraday Strategy
1️⃣ VWAP as a Trend Filter
Before entering a trade, check where price is relative to VWAP:
Price above VWAP with higher lows → Focus on long setups
Price below VWAP with lower highs → Focus on short setups
🔁 Skip counter-trend trades. Stay with the flow.
This helps in trending markets by keeping you aligned with momentum.
2️⃣ VWAP as Dynamic Support or Resistance
VWAP behaves like a magnet. Price often pulls back to it and either:
Rejects (respects the level as support/resistance), or
Breaks and reclaims (signaling a potential reversal)
Use it alongside:
Flag patterns
Inside bars
Break-and-retest structures
3️⃣ VWAP Reversion Play (Snapback Trade)
This is a mean-reversion setup:
Price moves quickly away from VWAP at open
No strong follow-through, signs of exhaustion
Take a counter-trend trade back to VWAP
⚠️ Avoid this in strong trending markets — best used in choppy or fading environments.
4️⃣ VWAP with Price Action for Structure
Pair VWAP with clean price action:
Mark support and resistance zones
Observe price behavior near VWAP
Look for confirmation: inside bars, rejection wicks, engulfing candles
🎯 This adds logic and clarity to your entries — no random trades.
🔍 Bonus VWAP Tips
Combine VWAP with:
CPR (Central Pivot Range) for confluence zones
Opening range for breakout bias
Volume profile to spot high interest areas
These combos create strong, repeatable trade setups.
✅ VWAP Recap: Why It Matters
Here’s a quick breakdown of how VWAP can sharpen your intraday trading game:
Bias Building: VWAP helps confirm whether the market structure is bullish or bearish, giving you a reliable directional bias.
Trend Filtering: It keeps you aligned with the current momentum by filtering out counter-trend trades.
Pullback Entries: VWAP acts as a dynamic support or resistance level, offering clean zones to enter trades during pullbacks.
Mean Reversion: In sideways or fading markets, VWAP becomes a natural magnet — allowing you to target price reversions.
Risk Management: It provides logical reference points for placing stop-losses and defining entry zones, adding clarity to your risk-reward planning.
✍️ Final Thoughts
VWAP may sound simple, but it brings real structure to intraday trading.
It tells you where volume met price, and that’s powerful. When used with price action, it creates a solid framework for:
Building directional bias
Finding clean entries
Managing risk like a pro
VWAP doesn’t predict — it reflects. And in trading, reflection is more useful than prediction.
🛎️ Respect VWAP. Trade with structure.
— Kiran Zatakia
NIFTY trade ideas
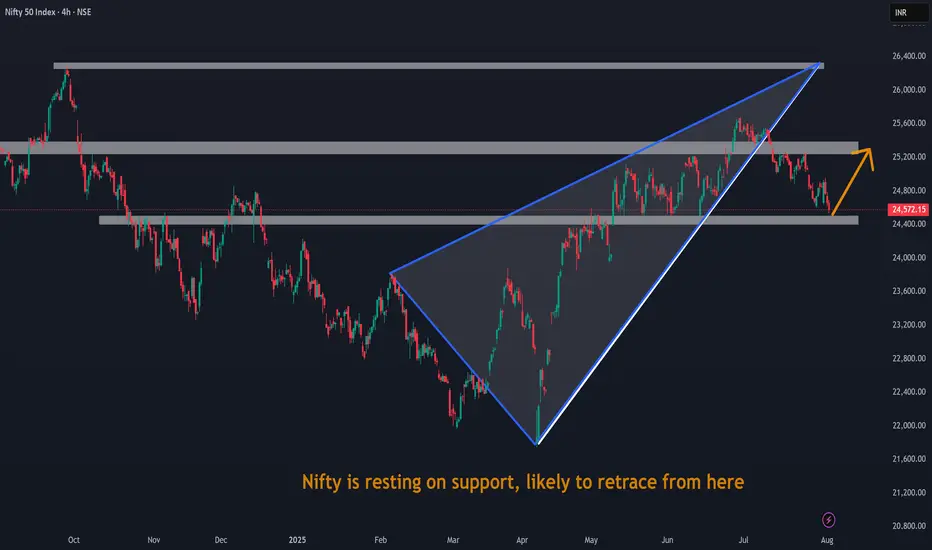
Nifty is resting on support, likely to retrace from hereNifty is resting on support, likely to retrace from here. Us Tariff on india already decided. So Nifty should close higher than opening price on monday.
Nifty Analysis EOD – August 2, 2025 – Friday🟢 Nifty Analysis EOD – August 2, 2025 – Friday 🔴
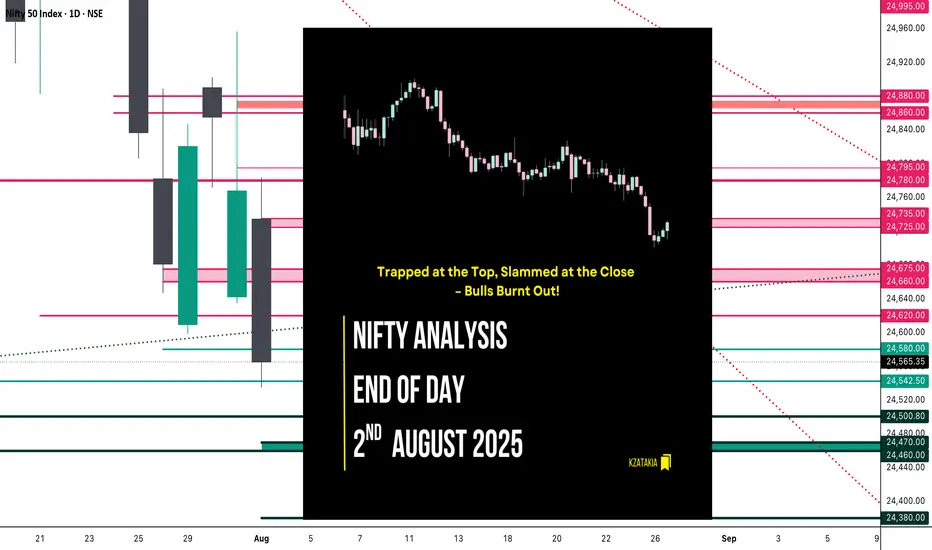
Trapped at the Top, Slammed at the Close – Bulls Burnt Out!
🗓️ Nifty Summary
With the continuation of yesterday's hidden weakness, today's session gave early hope but ended with a bearish surprise. Nifty opened near the key support zone of 24,735 ~ 24,725, hovered indecisively, then suddenly rallied to 24,780, trapping bulls just under resistance.
But the trap was set.
A sharp reversal followed as Nifty broke not just the day’s low, but also the previous day’s support zone of 24,660 ~ 24,675, pulling the index lower into the 24,565.35 close — the second lowest close since May 12.
A fierce 2–3 hour tug-of-war between bulls and bears took place in a tight 40–50 point range until 2:50 PM, when bulls gave up—leading to a 100+ point fall in the last half-hour. shocked many traders, especially those fatigued from the earlier choppy action.
Much like yesterday, both sides of the trade were available today.
Did you catch them?
Zoom Out View :
Today’s close is just 23 points above the June 3 close, wiping out nearly 59 sessions (81 days) of gain.
Will the zone of 24460 ~ 24542 provide support again, or are we headed for a retest of the 24000 ~ 23800 and 23200 ~ 22800 (Pattern Target and Virgin) range?
Yes, you read correctly 23200 ~ 22800…!
Not so soon…but eventually…!
wish you tell me crazy and hope I am wrong…!
📈 5 Min Time Frame Chart with Intraday Levels
📉 Daily Time Frame Chart with Intraday Levels
🕯️ Daily Candle Breakdown
Open: 24,734.90
High: 24,784.15
Low: 24,535.05
Close: 24,565.35
Change: −203.00 (−0.82%)
Candle Structure
🔴 Large bearish body (169.55 pts)
☁️ Moderate upper wick (49.25 pts)
⬇️ Short lower wick (30.30 pts)
Interpretation
Opened lower, climbed early but failed at 24,780+.
Selling dominated the rest of the session, closing near lows.
Moderate upper wick shows early bullish attempt was rejected.
Candle Type
Bearish Marubozu-like – clear seller dominance.
Key Insight
Sellers defended 24,780–24,800 zone.
Closing near 24,560 keeps the short-term bias bearish.
Next support: 24,500, 24,470 ~ 24460
⚠️ Bulls must reclaim 24,735+ on closing basis to neutralize sentiment.
🛡 5 Min Intraday Chart
⚔️ Gladiator Strategy Update
ATR: 212.37
IB Range: 87.55 → Medium
Market Structure: Balanced
Trades Triggered
🕙 10:05 AM – Long Entry → 🎯 Target Hit (R:R – 1:1)
🕚 11:09 AM – Short Entry → 🎯 Target Hit (R:R – 1:2)
🔍 Trade Summary
Both sides were offered—clean hit on long and solid breakdown on short. A Gladiator’s delight.
📊 Support & Resistance Levels
🔼 Resistance Zones
24620
24660 ~ 24675
24725 ~ 24735
24780 ~ 24795
24860 ~ 24880
🔽 Support Zones
24,542 ~ 24,535
24,500
24,470 ~ 24,460
24,380
💬 Final Thoughts
"Traps are laid where confidence is highest. Stay alert, stay flexible."
A textbook day where patience paid off — those who didn’t force trades were rewarded with clean moves in both directions.
✏️ Disclaimer
This is just my personal viewpoint. Always consult your financial advisor before taking any action.
Time to be cautious Nifty is at make or break levels, Be careful about general market trends before jump into any new trades.
Long Term Nifty Analysis.(With Economic Commentary). We saw phenomenal resistance by Indian markets today after the Tariff announcements. Nifty bounced back and at one point was 330 points above low of the day. However there was Profit booking and selling on bounce due to prevailing Tariff uncertainties and Nifty came of the peak to close at 24768. Even after losing a lot of ground which it gained it ended up 133 points from the low of the day. Nifty ended the day in the negative losing 87.6 points from yesterday's close. This was much better than estimation of many experts. We might not be out of the woods yet but nevertheless fight back was phenomenal.
Now coming to Tariffs. I am not an expert in economy but let us assume the worst case scenario that trade negotiations fail and this is the tariff stays at 25% + Penalty. Again assuming that we loose 50% of our exports to US due to this decision. Say tariff would apply to 50b worth goods exported by us to USA and we 25b worth business. The impact on GDP will be as under.
GDP Impact = 25b/3.7T= 0.0067 = 0.67% of our GDP will be shaved off..(Rough Estimate). So say our is say 6.5. Then we continue to grow at 5.9 or 5.8. (Again I am not an expert and this estimate is based on a lot of assumption). This loss of GDP can be covered by increasing local consumption or exploring other market. Enhancing ties with markets outside USA. Thus it is not something which is going to kill Indian markets. We survived 1991, We survived Covid, We survived, Ukraine - Russia war, Israel-Iran conflict, Operation Sindoor Lows so we will survive this too and continue thriving. India is destined to become 3rd Largest Economy and unless there are local / internal political mishaps or mess-ups our growth will continue.
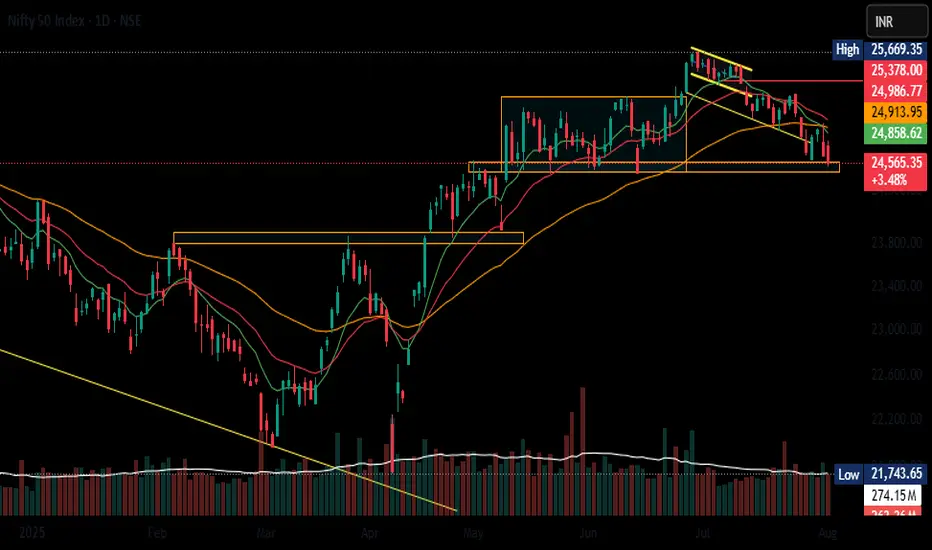
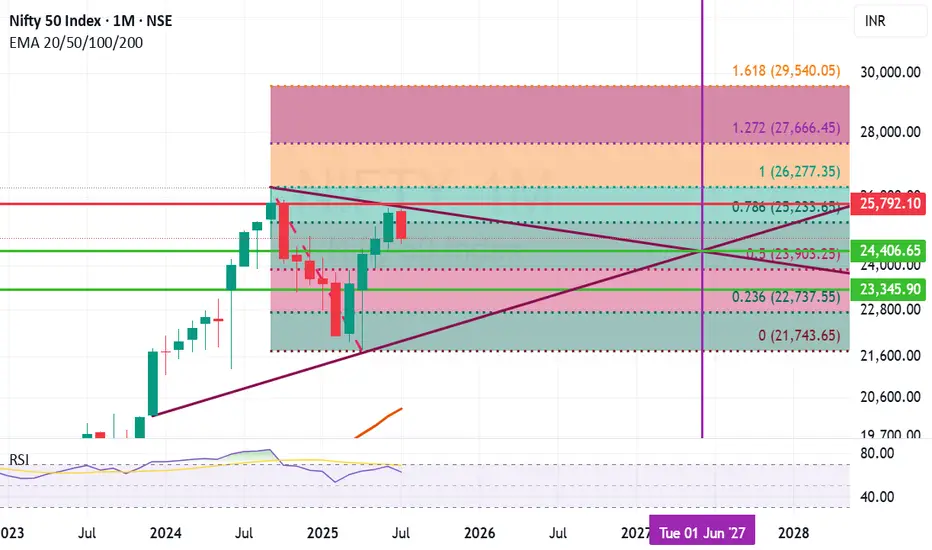
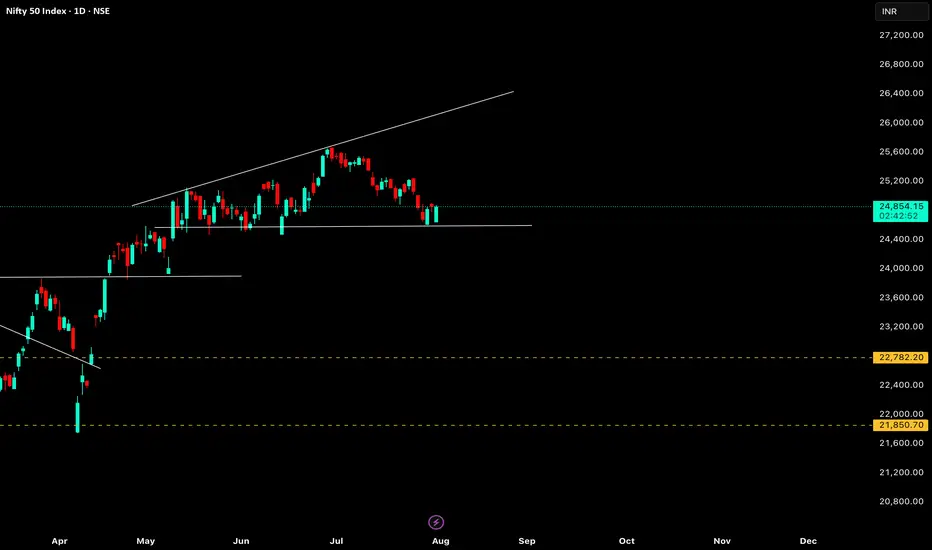
Fibonacci retracement of Nifty ant trend line analysis suggests few important support and resistance levels. The Horizontal line in the chart here suggests the cut off date. The chart suggests that:
Important Supports for Nifty remain at: 24406 (Mid Trend Support), 23903 (Important Fibonacci Support), 23345 (Important Candle support), (Below 23345 Nifty becomes very week and we will be in Bear grip where bears can drag Nifty down to 22737 or even 21742 in unlikely circumstances).
Important Resistance Levels: 25233 (Important Fibonacci resistance), 25792 (Important Candle resistance), 26277 (Previous All Time high), In the long term we might reach 27666 or even 29540 in close to 24 months time.
Conclusion:
Scenario 1) Indian Growth story continues and business thrive the optimistic range for Nifty by June 2027 seems to be the range between 26277 to 29540 or above.
Scenario 2) Indian economy faces changes and internal / external issues hamper progress the pessimistic range for Nifty by June 2027 seems to be anywhere between 23090 to 26277.
Scenario 3) Local or Global catastrophic events unfurl. Global and Indian economy takes a hit (Long drawn wars or local political leadership changes, Covid like events etc.) during this time frame 23090 to 21743 or below..(This does not seem likely but you never say never).
Disclaimer: The above information is provided for educational purpose, analysis and paper trading only. Please don't treat this as a buy or sell recommendation for the stock or index. The Techno-Funda analysis is based on data that is more than 3 months old. Supports and Resistances are determined by historic past peaks and Valley in the chart. Many other indicators and patterns like EMA, RSI, MACD, Volumes, Fibonacci, parallel channel etc. use historic data which is 3 months or older cyclical points. There is no guarantee they will work in future as markets are highly volatile and swings in prices are also due to macro and micro factors based on actions taken by the company as well as region and global events. Equity investment is subject to risks. I or my clients or family members might have positions in the stocks that we mention in our educational posts. We will not be responsible for any Profit or loss that may occur due to any financial decision taken based on any data provided in this message. Do consult your investment advisor before taking any financial decisions. Stop losses should be an important part of any investment in equity.
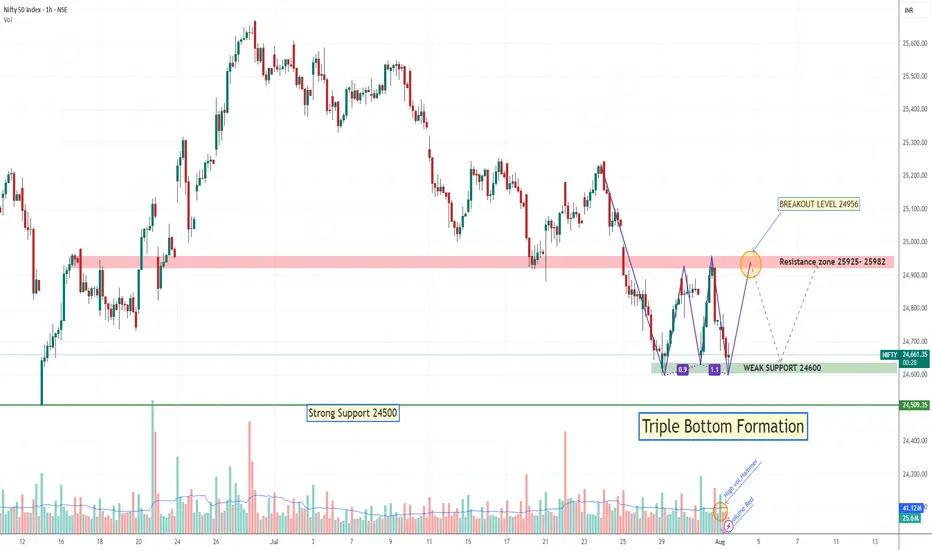
Tripple Bottom Formation if Hold 24600Nifty 3rd Time Tested 24600 level if it Break next Strong support 24500, if hold then may rallied again till 24956. May be Falling red candle is just testing candle of High-volume Hammer.
nifty 01/08/2025I am not SEBI Registered analyst. this is for education purpose only. this is only my view. please do own research before innate a trade or making investment plan. technical analysis are probability only.
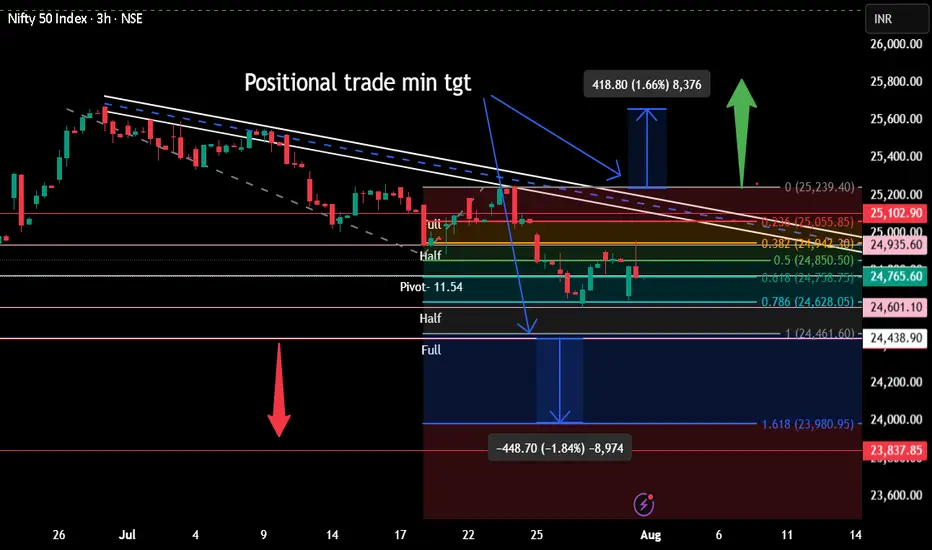
In addition to previous positional trade with targetThis are no buy sell recommendation but sharing for learning purpose only.
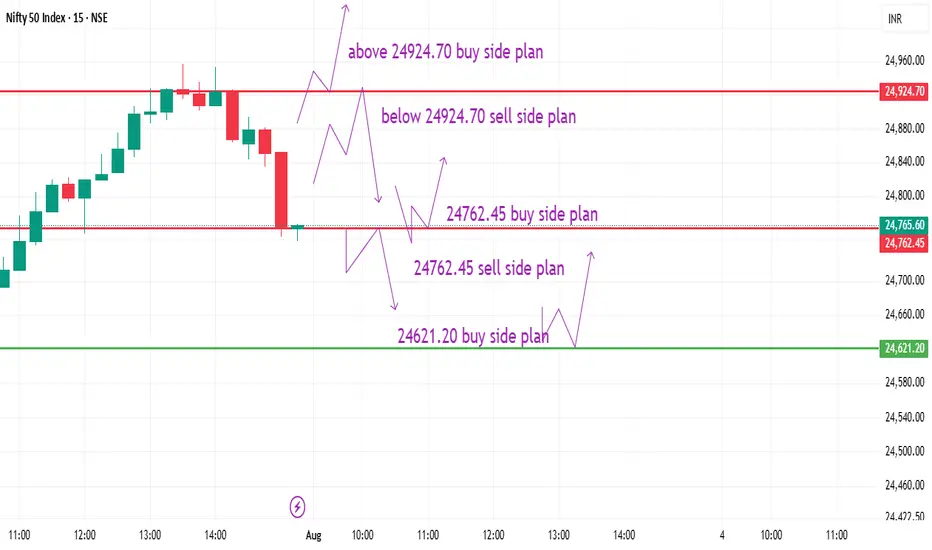
#NIFTY August 1st view#NIFTY August 1 st View : NSE:NIFTY Currently doing wave 3, and around buying zone, lets add up Nifty future and Nse Stocks for fresh high from Aprils low

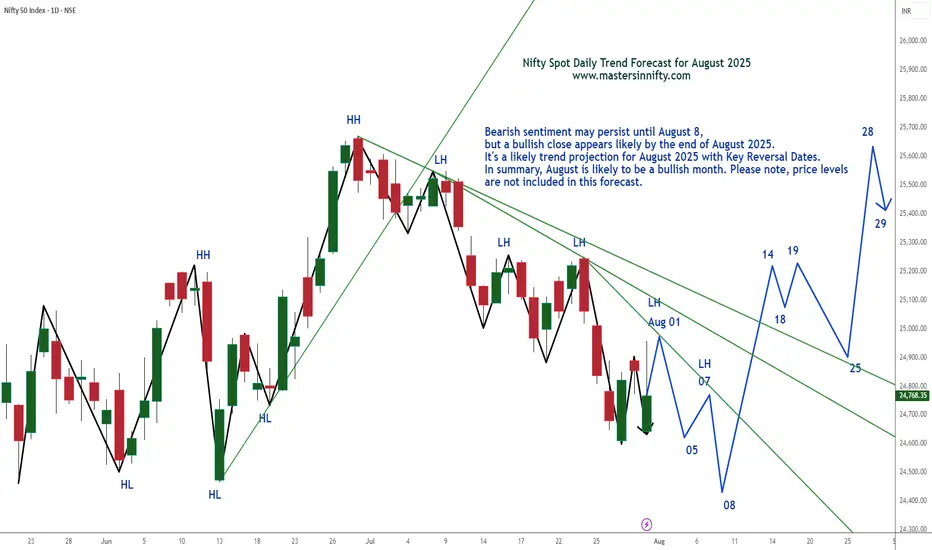
Nifty Spot Index Projection Line for August 2025Bearish sentiment may persist until August 8, but a bullish close appears likely by the end of August 2025.
It's a likely trend projection for August 2025 with Key Reversal Dates. In summary, August is likely to be a bullish month. Please note, price levels are not included in this forecast.
Traders are suggested to conduct own technical studies before entering into the trades and proper risk management is a must.
This is just my personal view.
Best of Luck & Happy Trading.
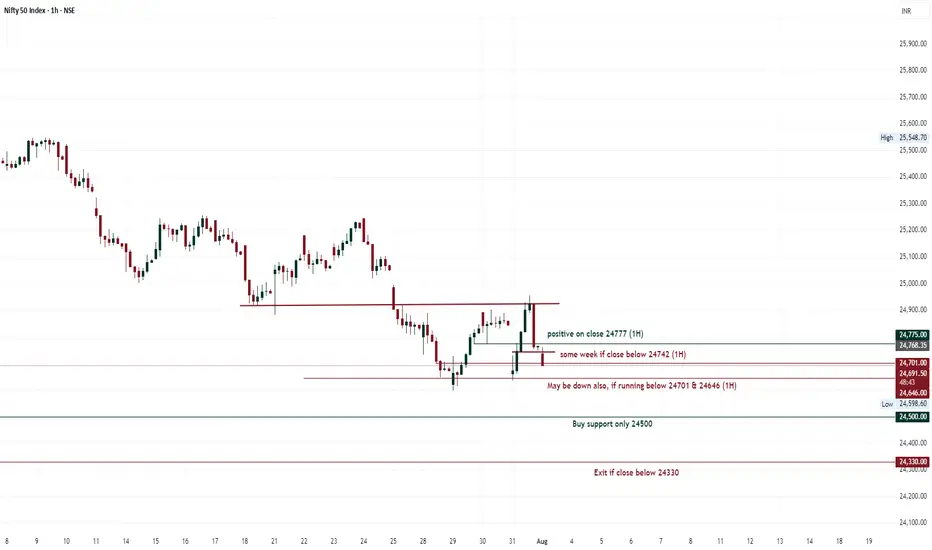
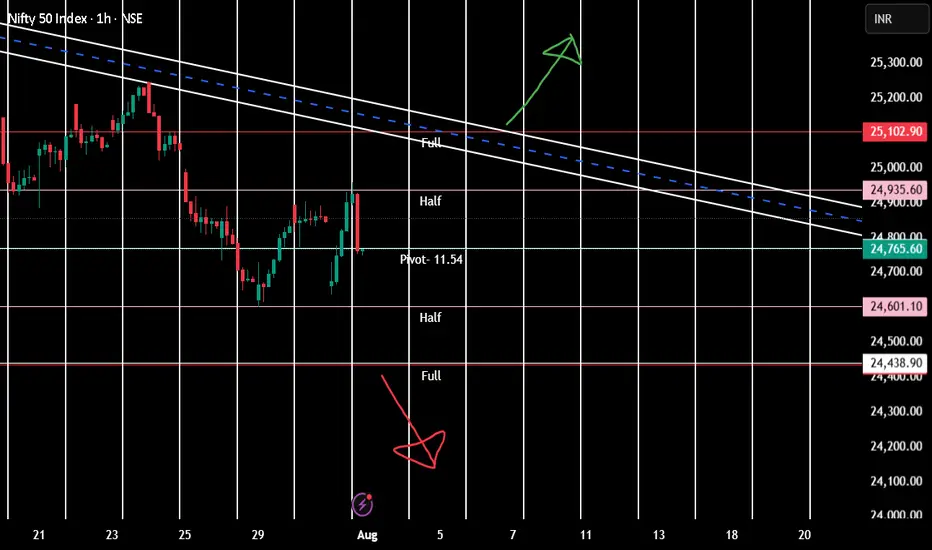
Positional tradeAt present market is for scalper/intraday trader. Positional trade to be done only once,
1. 24438 is crossed on day closing basis. Bearish view
2. 25102 is crossed on day closing basis. Bullish view
Pivot- Half-Full are weekly range and applicable only till 7th August.
Vertical lines are important times for intraday as buyer
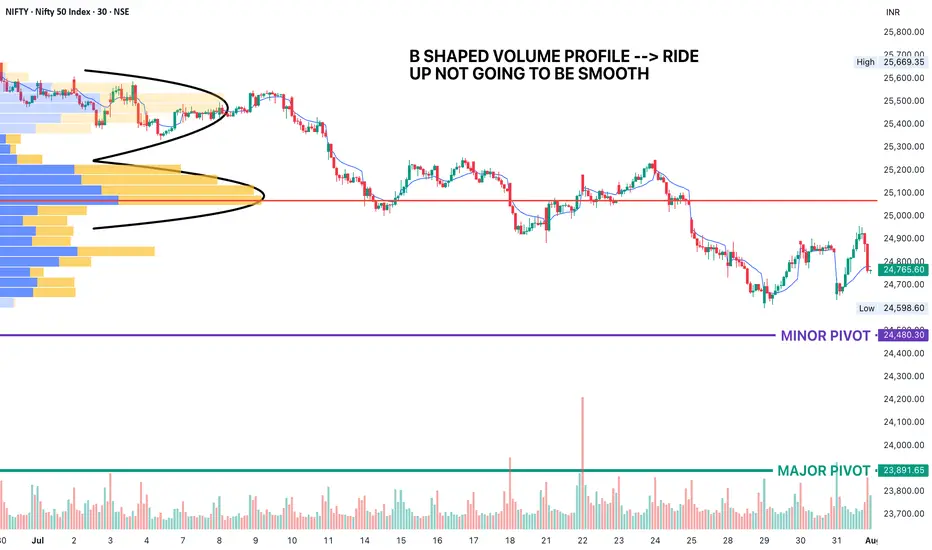
NIFTY UPDATE The volume profile on Nifty indicates that up moves will not be smooth, we need some base formation before any meaningful momentum returns to the market. Keep tracking the minor and major pivots marked. This is what I will be tracking to take profits.
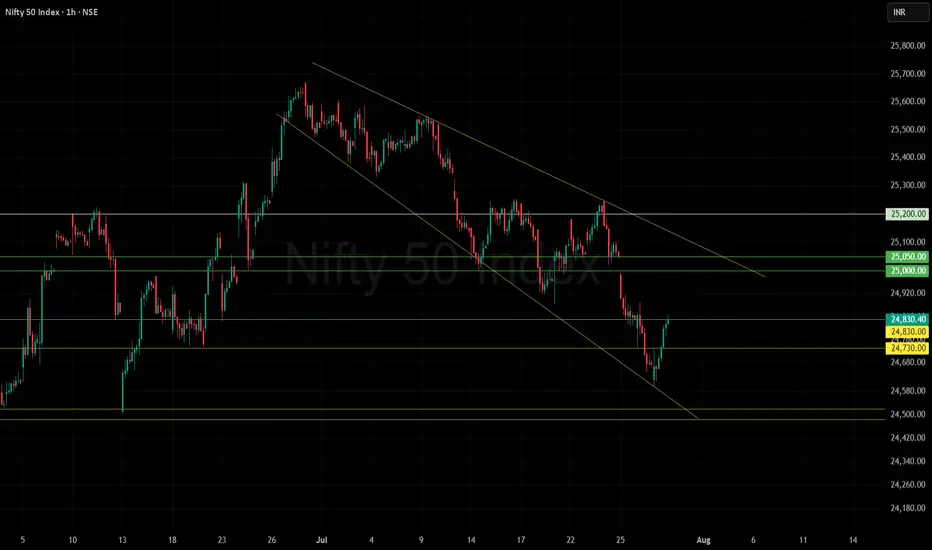
Nifty again back towards the upper rangeNifty’s recent rise can be attributed to short covering ahead of the monthly expiry, which often results in a surge as traders close their short positions.
Currently, the index faces a strong resistance zone around 25,000–25,100. A clear move above this range could indicate a trend change or a shift towards a more bullish outlook. If Nifty does not decisively cross this resistance, the market is expected to remain neutral to sideways, meaning price action could stay range-bound without a clear direction.
Additionally, 24,600 will act as a strong support level. As long as Nifty stays above 24,600, market sentiment should remain stable, supporting a constructive stance. A break below this level could signal increased caution.
Summary:
Rise driven by short covering ahead of expiry.
Strong resistance at 25,000–25,100.
24,600 will act as strong support.
Above 25,100: Trend change or bullish breakout likely.
Below 25,100: Market remains neutral/sideways.
Above 24,600: Sentiment stays steady; below may warrant caution.
Unless Nifty crosses above the resistance zone or drops below strong support, the outlook remains stable and sideways.
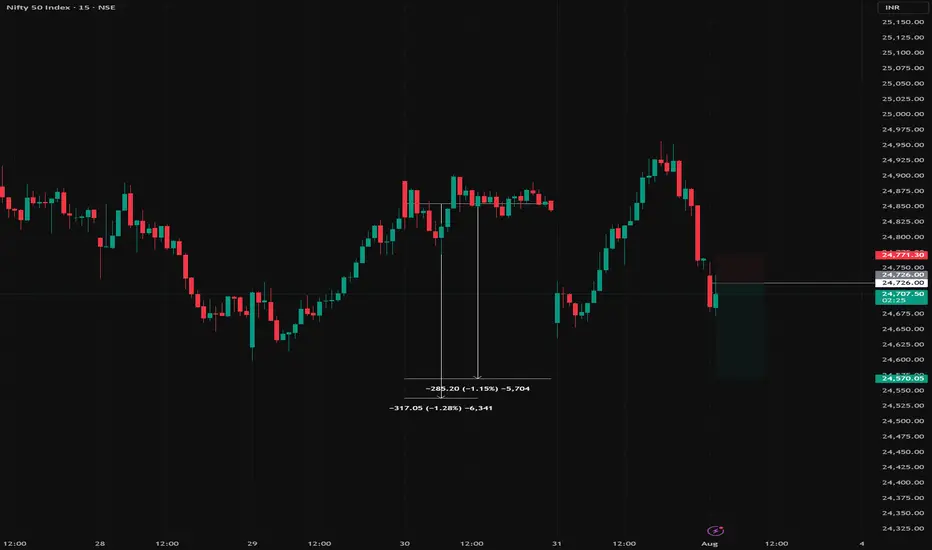
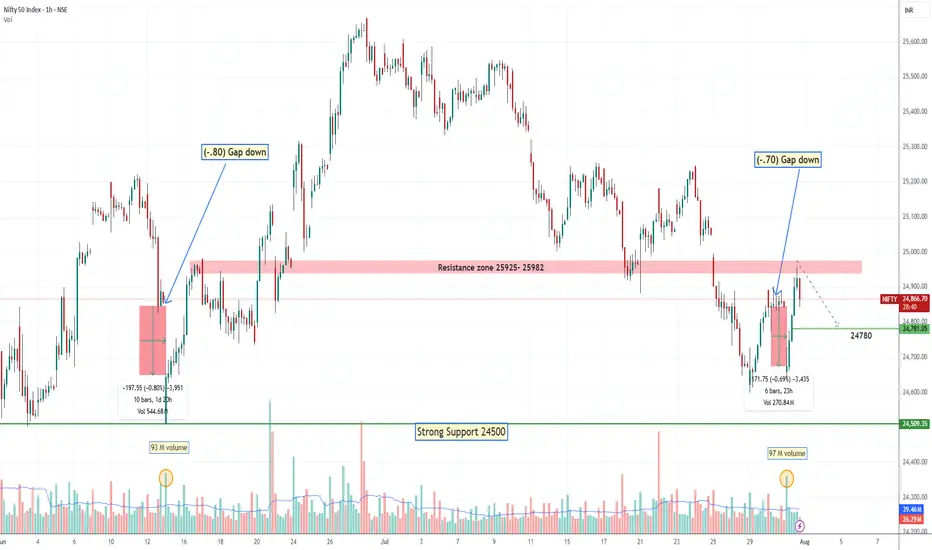
Nifty 24780 Pullback possible on next 1-2 days On 31 July, if someone watch closely price action he could capture Today up move coz Nifty gave almost same price action as 13 June let's try to find what is the Same thing: -
(A)31 July 2025: gap down is (-70%)
volume around 97 million
Bounce Back after gap down around +1%
(B) 13 June: gap down was (-80%)
Volume around 93 million
Bounce back after gap down around +1
On 13 June Nifty faced resistance of 24980 level then retraced. Due to such similarities, we can conclude that it could be pullback around 24780 level although I don't say market will behave same as before, I know every second of market is very dynamic and different from past days, but technical analysis always based on historical data. so, this is just assumption. take the trade on your own analysis & research.
#NIFTY50 Analysis 31st July#NIFTY50 currently seems to be correcting the rally from April low. Any rally is a buy in 3-7 swings. However we see second leg formation in progress.

What's Nifty Next?With rising tensions between countries, market sentiment is becoming increasingly cautious. This geopolitical uncertainty is likely to weigh heavily on investor confidence in the coming weeks.
Based on the current scenario, a realistic target for Nifty seems to be around 21,000 by July, especially if the negative sentiment continues and foreign institutional investors (FIIs) remain net sellers. Global cues, crude oil prices, and currency fluctuations could further impact the index's performance.
📌 However, if by any chance Nifty manages to close above 25,500, it would indicate an extremely strong bullish breakout, defying current market fundamentals. Given the present conditions, this seems highly unlikely, unless there is a sudden positive catalyst such as:
A major resolution in geopolitical issues
Strong corporate earnings
Aggressive policy support from the government or RBI
🧠 My Take:
For now, it’s wise to remain cautious and watch key support/resistance levels. Volatility may remain high, and short-term traders should manage their positions carefully.
💬 Let me know your thoughts in the comments below. Do you think 21k is coming soon, or can the bulls surprise us all?

Nifty Analysis EOD – July 30, 2025 – Wednesday🟢 Nifty Analysis EOD – July 30, 2025 – Wednesday 🔴
Trapped in Illusion – A Day of Decoy Moves
Nifty moved 130 points today, falling short of the 2-week average range of 196 points. It formed its IB by 11:40 AM, marking the day's high and low early. For the rest of the session, it hovered between the IB high and the previous day high, eventually closing near the mean.
Despite a close below the open, Nifty managed a green close vs. the previous day—making it a classic "moboroshi candle" day, where visuals deceive sentiment.
📉 Intraday 5 Min Time Frame Chart
🪜 Intraday Walk
IB formed by 11:40 AM
False breakout on both sides trapped traders badly
Nifty stayed stuck between IB high and PDH
Closed slightly above the previous close, but below open
Eyes on breakout of 24,910 for targets of 24,995 and 25,090–25,110
🔄 Trend & Zone Update
📈 Resistance Zone Shifted To: 25,110 ~ 25,090
📉 Support Zone Shifted To: 24,520 ~ 24,480
🕯 Daily Time Frame Chart with Intraday Levels
🕯️ Daily Candle Breakdown
Candle Type: Small Red Hammer‑Like Candle (Decoy / Moboroshi)
Today’s OHLC:
🟢 Open: 24,890.40
🔺 High: 24,902.30
🔻 Low: 24,771.95
🔴 Close: 24,855.05
📈 Change: +33.95 (+0.14%)
📌 Candle Structure:
Real Body: 35.35 pts (Small bearish body)
Upper Wick: 11.90 pts (Very small)
Lower Wick: 83.10 pts (Long)
📌 Key Observations:
Buyers stepped in near 24,770 zone
Closed near open but slightly lower → mild net selling
Long lower wick indicates dip buying support
📌 Implication:
Buyers defended 24,770–24,780 zone
A reclaim of 24,900–24,920 may resume bullish move
A close below 24,770 weakens support
🛡 5 Min Intraday Chart
🛡️ Gladiator Strategy Update
ATR: 195.72
IB Range: 78.15 → Medium
Market Structure: Balanced
💥 Trades Triggered:
🕙 10:25 AM – Short Entry → SL Hit
📌 Trade Summary:
False IB breakouts on both sides led to a stop loss hit—typical trap in a tight consolidation phase.
📌 Support & Resistance Levels
📈 Resistance Zones:
24,880 ~ 24,890
24,910
24,995
25,090 ~ 25,110
📉 Support Zones:
24,830 ~ 24,820
24,780
24,725 ~ 24,715
24,660 ~ 24,650
🔮 What’s Next? / Bias Direction
Awaiting breakout above 24,910 for potential targets of 24,995 and 25,090–25,110. Consolidation may reward patient breakout players in upcoming sessions.
🧠 Final Thoughts
“Structure is key. When levels work, respect them. When they break, adapt.”
Today's range was narrow, but traps show signs of buildup. Be ready when the market unwinds.
✏️ Disclaimer
This is just my personal viewpoint. Always consult your financial advisor before taking any action.

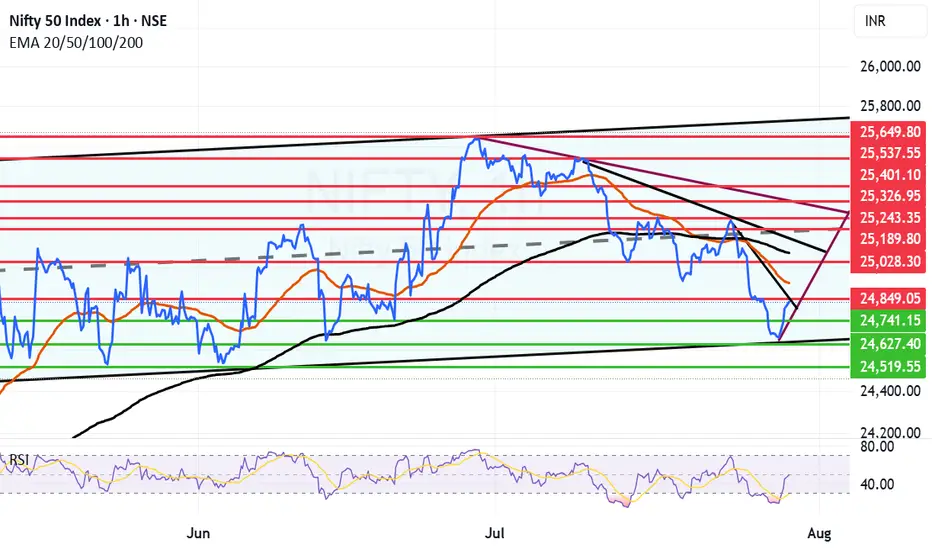
Good turnaround by market as expected from the channel bottom.We had given a message that the market was nearing the bottom and there can be a turnaround sooner than later and market turned around today. This bounce can be currently seen as a technical bounce but it can become a full fledged fightback by bulls if it crosses key resistance levels of Mother line, Father line and Mid-channel resistance. These are the 3 key resistances in front of us currently. All eyes on the important trade deal announcements and with US and China which are on going any news on that from can disrupt the market proceedings in either way. Support and resistance levels for Nifty are as under:
Key Nifty Resistances: 24849 (Trend line resistance), 24922 (Motherline Resistance of hourly chart), 25028, 25070 (Father line resistance), 25189 (Mid-channel resistance), 25243 (Very important resistance for Bulls to conquer). Above 25243 Bulls can gain control of Nifty.
Key Support levels: 25741, 25627 (Channel bottom Support), 24519.
Disclaimer: The above information is provided for educational purpose, analysis and paper trading only. Please don't treat this as a buy or sell recommendation for the stock or index. The Techno-Funda analysis is based on data that is more than 3 months old. Supports and Resistances are determined by historic past peaks and Valley in the chart. Many other indicators and patterns like EMA, RSI, MACD, Volumes, Fibonacci, parallel channel etc. use historic data which is 3 months or older cyclical points. There is no guarantee they will work in future as markets are highly volatile and swings in prices are also due to macro and micro factors based on actions taken by the company as well as region and global events. Equity investment is subject to risks. I or my clients or family members might have positions in the stocks that we mention in our educational posts. We will not be responsible for any Profit or loss that may occur due to any financial decision taken based on any data provided in this message. Do consult your investment advisor before taking any financial decisions. Stop losses should be an important part of any investment in equity.
Nifty Analysis EOD – July 29, 2025 – Tuesday🟢 Nifty Analysis EOD – July 29, 2025 – Tuesday 🔴
Bulls Strike Back After Trendline Trap & Break
Nifty started below the previous day's low, and after marking day low at 24,598.60, it rose to 24,725 where it faced the trendline and CPR zone. A sharp rejection from there quickly pushed Nifty back to the day's open level. A base-building process began, characterized by a low-range but high-volatility phase.
Gradually, Nifty crossed the VWAP and the trendline again, breaking the day's high and CPR zone, ultimately reaching R1 and closing near the highest point at 24,830.40.
In the first half, both long and short traders got trapped in fast swings—refer to the chart for visual cues.
🕯 5 Min Time Frame Chart with Intraday Levels
🔄 Trend & Zone Update
📈 Resistance Zone Shifted To: 25,110 ~ 25,090
📉 Support Zone Shifted To: 24,520 ~ 24,480
🕯 Daily Time Frame Chart with Intraday Levels
🕯 Daily Candle Breakdown
Open: 24,609.65
High: 24,847.15
Low: 24,598.60
Close: 24,821.10
Change: +140.20 (+0.57%)
🕯Candle Structure Breakdown:
Real Body: Green candle (Close > Open):
24,821.10 − 24,609.65 = 211.45 pts (large bullish body)
Upper Wick: 26.05 pts (small)
Lower Wick: 11.05 pts (very small)
🕯Interpretation:
Market opened lower but found strong buying support, rallying to nearly 24,850.
Closed near the day’s high—bulls dominated.
Tiny lower wick shows hardly any selling pressure after the open.
🕯Candle Type:
Bullish Marubozu-type — strong signal of reversal or continuation, indicating control by buyers.
🕯Key Insight:
Strong bounce from sub-24,600 back above 24,800 has improved short-term sentiment.
If 24,830–24,850 breaks in the next session, potential upside till 24,920–24,995.
Support now shifts to 24,700–24,720.
🛡 5 Min Intraday Chart
⚔️ Gladiator Strategy Update
ATR: 202.98
IB Range: 128.5 → Medium
Market Structure: Balanced
Trades Triggered:
🕒 11:10 AM – Long Entry → Target Hit 🎯 (1:3 Risk:Reward)
🧱 Support & Resistance Levels
Resistance Zones:
24,815 ~ 24,830
24,850
24,920
24,995
Support Zones:
24,725
24,693
24,660 ~ 24,650
🧠 Final Thoughts
“Volatility shakes the weak hands; structure empowers the patient.”
Today’s session was a textbook example of how the market tests conviction. After trapping early traders with sharp intraday swings, Nifty rewarded those who respected structure and waited for confirmation. The reclaim of the trendline, VWAP, and CPR zone reinforced the strength of bullish intent. If the momentum continues above 24,850, we may be entering a fresh leg of the uptrend—stay nimble, but don't lose sight of the bigger picture.
✏️ Disclaimer
This is just my personal viewpoint. Always consult your financial advisor before taking any action.

Nifty bounced backOur observation aligns well with the earlier analysis. The time cycle highlighted July 29 as a potential inflection point, and the strong short covering during the monthly expiry has clearly supported the 200+ point bounce today.
With NIFTY closing at 24,820, if it manages to cross the 24,850 level tomorrow, the path to 25,000 and possibly higher resistance levels should open up, signaling a stronger recovery.
Keep watching key supports around 24,700 as the base; sustained momentum above 24,850 will be crucial to confirm the bullish reversal. Stay nimble and monitor volumes and global cues for confirmation.