nifty 23400 or again down 22800nifty 23400 or again down 22800
Nifty 50, often referred to as "Nifty," is a benchmark stock market index in India. It represents the weighted average of 50 of the largest and most liquid Indian companies listed
NIFTY trade ideas

Nifty levels - Apr 03, 2025Nifty support and resistance levels are valuable tools for making informed trading decisions, specifically when combined with the analysis of 5-minute timeframe candlesticks and VWAP. By closely monitoring these levels and observing the price movements within this timeframe, traders can enhance the accuracy of their entry and exit points. It is important to bear in mind that support and resistance levels are not fixed, and they can change over time as market conditions evolve.
The dashed lines on the chart indicate the reaction levels, serving as additional points of significance to consider. Furthermore, take note of the response at the levels of the High, Low, and Close values from the day prior.
We hope you find this information beneficial in your trading endeavors.
* If you found the idea appealing, kindly tap the Boost icon located below the chart. We encourage you to share your thoughts and comments regarding it.
Wishing you success in your trading activities!

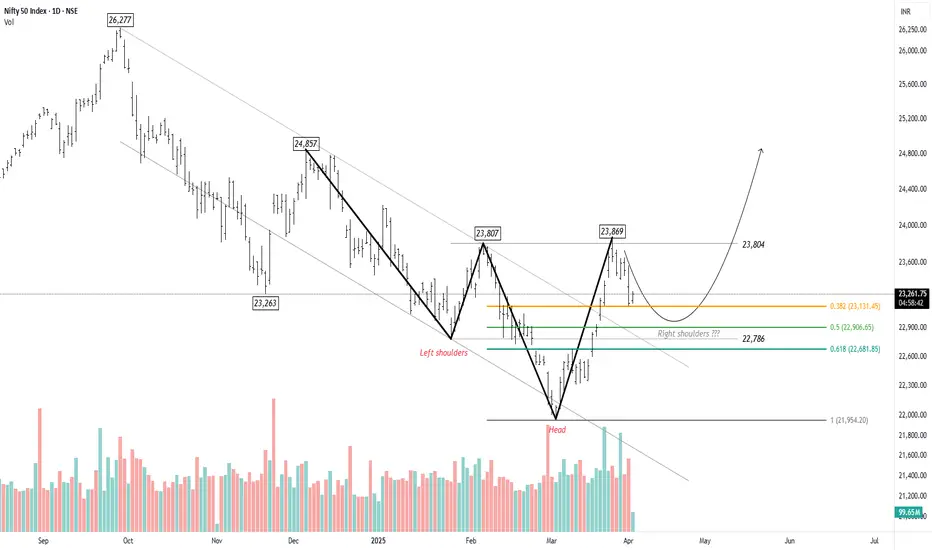
Nifty - Awaiting the Fifth Wave for a BreakoutNifty recently hit a low of 21,905 , marking a key reversal point in the trend. A well-defined Head and Shoulders pattern is emerging, with the right shoulder currently forming. The ongoing pullback has retraced to the 38.2% level, but there is potential for it to extend towards the 50% mark at 22,906 . However, the upward move appears to be losing momentum, with buying interest remaining subdued.
Based on the chart, the head of the pattern signifies the beginning of a new impulse wave. This appears to be the fourth wave within the larger first wave. Once Nifty completes this corrective phase, the fifth wave is expected to present a trading opportunity. If wave equality holds, Nifty could potentially rise to 24,857 .
#NIFTY Intraday Support and Resistance Levels - 02/04/2025Today will be slightly gap up opening expected in nifty. After opening if nifty starts trading below 23200 level then expected sharp downside upto 23050 level in opening session. Upside 23450 level will act as a strong resistance for today's session. Any bullish side rally can reversal from this level.
Nifty analysis 02.4.2025As of April 2, 2025, the Nifty 50 index has experienced notable fluctuations influenced by global economic developments. On April 1, the index declined by 1.5% to close at 23,165.7, marking its steepest drop since February 28. This downturn was primarily attributed to investor apprehension regarding anticipated reciprocal tariffs from U.S. President Donald Trump.
mint
Despite this decline, market indicators suggest a potential rebound. Futures point to a modest recovery, with the Gift Nifty trading around 23,327, indicating a flat to slightly positive opening for the Nifty 50. Technical analyses present a mixed outlook; some indicators show neutral trends, while others suggest a bearish sentiment.
Additionally, a recent shift in investment patterns has been observed, with increased inflows into gold exchange-traded funds (ETFs) as investors seek safe-haven assets amid equity market volatility.

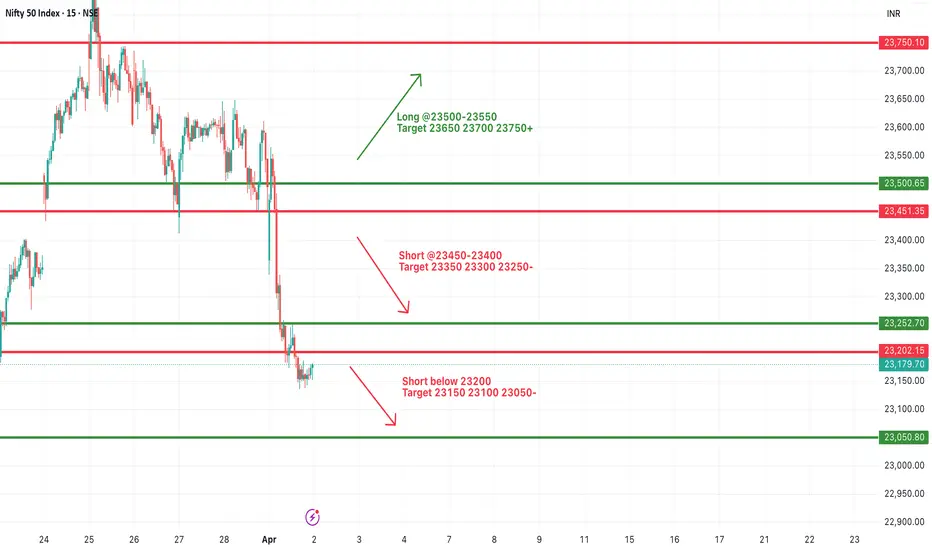
Nifty 50:Nifty 50:
As mentioned in our earlier posts Nifty 50 index has come down from 23875 to 23165 in the last 3 days.
The immediate resistance lies @23600-23700, while the support @ 22300.
What's possible next?
Nifty 50 has to come down over the next few days to 200-300 points to continue its possible upward trajectory.
Buy on dip market is on hold until 22300.
Cheers.
Note: As always look for potential value buys.
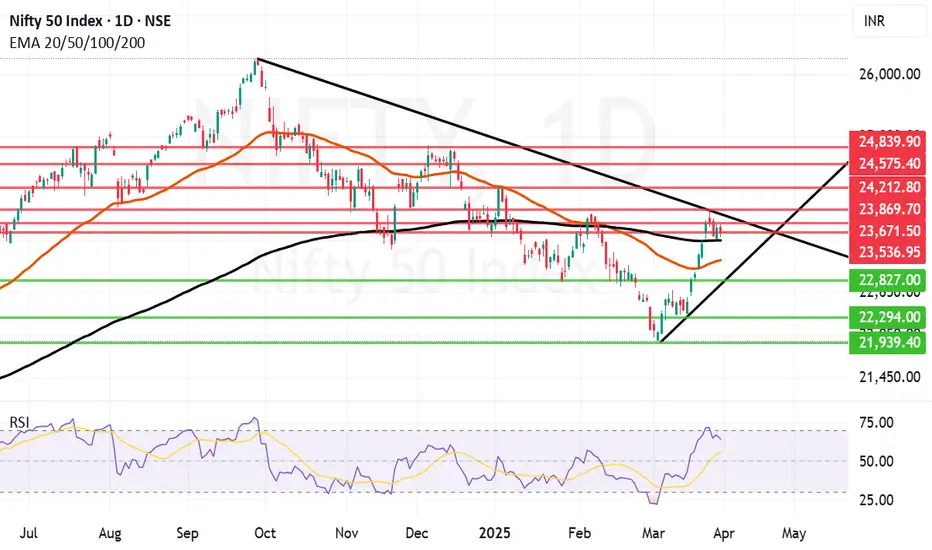
Nifty is holding on above the Father line but by a thin margin.After reaching a weekly high of 23869 Nifty decided to fall back in search of its support zone. Currently it is holding above the Father line in the daily chart which is at 23406. Below the Father line there is Mother line waiting to support Nifty at 23114 in case the weakness seen on Friday persists. We will be in trouble again in case we get a daily or weekly closing below this level. In such a scenario the supports for Nifty will be at 22827, 22294 and 21939. In case the Nifty is able to gain momentum again the resistances it will face will be near 23536, 23671 and 23864. Closing above 23869 will enhance the short term momentum in Nifty which can lead it to 24K+ levels.
To know more about supports, Resistances, investing in stocks based on sector index, Trend lines Parallel Channels, Mother, Father and small Child Theory, Behavioural finance, Fundamental analysis, Technical analysis, Profit booking etc. Read my book The Happy Candles Way to Wealth creation. It is as on date one of the highest rated books on Amazon. The paperback version and Kindle can be bought through Amazon. You can also contact me to buy the same.
Things are slightly off balance with shadow of the candle just slightly in favour of bears as of now but Bulls will definitely try and retake the advantage back to their side given a slight opportunity. So the Bull and Bear tussle to continue into April and may escalate given Trump Tarif announcements and upcoming result season.
Disclaimer: The above information is provided for educational purpose, analysis and paper trading only. Please don't treat this as a buy or sell recommendation for the stock. No one can guarantee any success in highly volatile market or otherwise. There is also chance of bias in our opinion. The supports and resistances indicated are based on data which has a cycle time of being 3 months or older so it is not necessary that it will work. The author or Smart Investment will not be responsible for any Profit or loss that may occur due to any financial decision taken based on any data provided in this message.
NIFTY approaching 23000-22900-22800 levels As we can see NIFTY looks more weak as it has broken the consolidation making it weaker. Now that it has confirmed the weakness and expected to reach its next eminent demand zone of 23000-22900 levels hence till the zone is reached, every rise can be shorted so plan your trades accordingly and keep watching.

2 April Nifty50 important level trading zone #Nifty50
99% working trading plan
Gap up open 23231 above & 15m hold after positive trade target 23312, 23432
Gap up open 23231 below 15 m not break upside after nigetive trade target 23114, 23070
Gap down open 23114 above 15m hold after positive trade target 23231, 23312
Gap down open 23114 below 15 m not break upside after nigetive trade target 23070 , 22995
💫big gapdown open 23070 above hold 1st positive trade view
💫big Gapup opening 23312 below nigetive trade view
📌For education purpose I'm not responsible your trade
More education following me

NIFTY : Trading Levels and Plan for 31-Mar-2025📌 NIFTY Trading Plan – 31-Mar-2025
📊 Market Overview:
Nifty closed at 23,495, showing mixed sentiment near the Opening Support Zone (23,401 – 23,465). The market is at a crucial juncture, with potential bullish momentum above resistance levels, while breakdowns below key supports may trigger selling pressure.
This plan will help you react strategically to different opening scenarios, ensuring a favorable risk-reward ratio.
🔼 Scenario 1: Gap-Up Opening (100+ points above 23,600)
A gap-up above 23,600 signals bullish momentum, but for sustained upside, Nifty must stay above 23,642 – 23,842. Watch for rejection at resistance zones, as profit booking can lead to reversals.
✅ Plan of Action:
If Nifty sustains above 23,772, expect a move towards the next resistance at 23,925 – 23,990. A breakout above 23,990 could open doors for 24,050+.
If price faces rejection at 23,842, a pullback towards 23,642 → 23,495 is possible. If it breaks below 23,495, expect further downside.
Avoid aggressive longs inside 23,642 – 23,842, as this is a potential reversal zone. Wait for a decisive breakout or rejection confirmation.
🎯 Pro Tip: If the gap-up is filled within the first 15-30 minutes, it suggests weak buying pressure and increases the probability of a reversal.
⚖ Scenario 2: Flat Opening (Within ±100 points, around 23,500)
A flat opening near 23,495 indicates indecision. The market will take direction after the first few candles, so breakouts or breakdowns from key levels should be closely monitored.
✅ Plan of Action:
Upside case: If Nifty breaks and sustains above 23,642, it may head towards 23,772 → 23,925. Monitor price action near these resistance levels before entering fresh longs.
Downside case: If Nifty breaks below 23,495, it could test 23,336 → 23,164. A breakdown below 23,164 will shift the trend bearish.
Avoid trading inside the No Trade Zone (23,495 – 23,642), as price could consolidate before a breakout.
🎯 Pro Tip: In a flat opening, wait for a clear 15-minute candle close above or below key levels before entering trades.
🔽 Scenario 3: Gap-Down Opening (100+ points below 23,400)
A gap-down below 23,400 may indicate fresh selling pressure, making it crucial to observe whether buyers step in at support zones.
✅ Plan of Action:
If price sustains below 23,400, expect a decline towards 23,336 → 23,164. A breakdown below 23,164 could lead to a sharp fall towards 23,100.
If price finds support at 23,164 and rebounds, it may recover towards 23,336 → 23,495. A strong close above 23,495 will shift momentum back to the bulls.
Be cautious of bear traps – If the market gaps down but quickly recovers, it could trigger short covering, leading to a strong upside reversal.
🎯 Pro Tip: If the gap-down occurs near a strong buyer’s support zone, wait for a bullish price action confirmation before entering long trades.
⚠️ Risk Management Tips for Options Traders
🔹 Avoid over-leveraging – Use proper position sizing to manage risk.
🔹 Theta Decay Awareness – If the market consolidates, option premiums will erode rapidly.
🔹 Use Spreads for Protection – Instead of naked options, use spreads to limit risk and improve probability.
🔹 Trade at Key Levels – Avoid impulsive trades; focus on defined support and resistance zones.
📌 Summary & Conclusion
📍 Key Levels to Watch:
🟥 Resistance: 23,772 → 23,925 → 23,990
🟧 No Trade Zone: 23,495 – 23,642
🟩 Support: 23,336 → 23,164 → 23,100
🔸 Bullish Bias: Above 23,642, targeting 23,772 – 23,925
🔸 Bearish Bias: Below 23,400, expecting a fall towards 23,336 – 23,164
🔸 Neutral/Choppy: Inside 23,495 – 23,642, avoid unnecessary trades
🎯 Final Advice:
Stick to the structured trading plan and execute only at key levels.
Avoid emotional trading—wait for confirmation before entering trades.
The first 15-30 minutes after market open will provide better clarity—observe price action before committing to a trade.
📢 Disclaimer
I am not a SEBI-registered analyst. This trading plan is for educational purposes only. Please conduct your own research or consult a financial advisor before making any trades.

Nifty50 Analysis Based on Today's ClosingThe Nifty 50 index closed at ₹23,165.70 on April 1, 2025, down by 354 points (-1.50%)
Analysis Based on Today's Closing
Key Support Levels
Immediate Support: ₹23,100
This level aligns with the 20-day EMA and is a critical short-term support. A breakdown below this could lead to further downside.
Next Support: ₹22,900
If ₹23,100 is breached, the next significant support lies at ₹22,900, which could act as a strong demand zone.
Key Resistance Levels
Immediate Resistance: ₹23,400
This level, which was previously a support, now acts as resistance. A recovery above this level could indicate a reversal.
Next Resistance: ₹23,650
Sustaining above ₹23,650 could lead to a test of ₹23,800, which is a critical resistance for bullish momentum.
Scenario Analysis
Bearish Breakdown
If Nifty 50 falls below ₹23,100, it could test ₹22,900.
A breakdown below ₹22,900 could lead to further weakness, targeting ₹22,700 or lower.
Bullish Recovery
If Nifty 50 reclaims ₹23,400, it could target ₹23,650.
A breakout above ₹23,650 could lead to ₹23,800, signaling a potential trend reversal.
Market Sentiment
The market sentiment remains cautious due to global headwinds, including concerns over U.S. tariff policies.
Sectors like IT and banking faced significant pressure, contributing to today's decline.
NOTE: Please note that this analysis is for informational purposes only and should not be considered as financial advice or a recommendation to buy or sell any securities. Always conduct your own research and consult with a certified financial advisor before making any investment decisions.

NIFTY50.....Box trading?Hello Traders,
the NIFTY50 has seen a massive sell-off during Monday's session. It declined from a high @ 23483.70 to a low @ 23221.15 in the first trading hour. That was a huge sell-off, off about 227.15 points.
It collapsed below my favored sell-off level @ 23462 and opened the door to more selling pressure, as it touched my price range from 23289 to 23196 by some points.
Chart analysis:
On March 24th the index achieved a 2.0 Fibo-extension @ 23869.60 points. This was a peak! Since the index is in a corrective mode, and possibly has shown a w-x-y correction, that has chances to morph into a triple correction.
Shorthand I expect a test off the lower boundary of the box, ranging @ 23038 points. N50 has the option to show a wave 4 of lower degree and decline than to a wave 5 low below today's low.
But step by step.
First, I'd like to check tomorrow's pattern and judge that.
The bulls need a massive buying pressure to achieve the range of 23414 to 23646.45 points.
Well Traders..... That's it for a short note.
Have a great week....
Ruebennase
Please ask or comment as appropriate.
Trade on this analysis at your own risk.

Nifty levels - Apr 02, 2025Nifty support and resistance levels are valuable tools for making informed trading decisions, specifically when combined with the analysis of 5-minute timeframe candlesticks and VWAP. By closely monitoring these levels and observing the price movements within this timeframe, traders can enhance the accuracy of their entry and exit points. It is important to bear in mind that support and resistance levels are not fixed, and they can change over time as market conditions evolve.
The dashed lines on the chart indicate the reaction levels, serving as additional points of significance to consider. Furthermore, take note of the response at the levels of the High, Low, and Close values from the day prior.
We hope you find this information beneficial in your trading endeavors.
* If you found the idea appealing, kindly tap the Boost icon located below the chart. We encourage you to share your thoughts and comments regarding it.
Wishing you success in your trading activities!

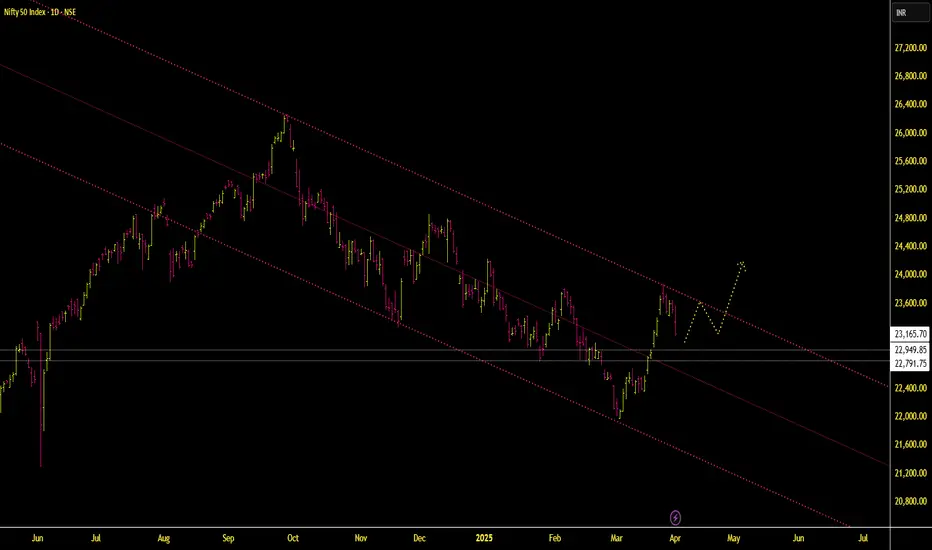
Nifty short term analysis as per Gann fanNifty touched 2/1 Gann fan Line and corrected from there 1/1 low Gann fan Line which stands at 4 march 2025. Nifty may find resistance at 2/1 level if it crosses this decisively then will go towards higher level in coming days.

nifty50 directioncurrent scenario suggest price to follow the bearish trend as todays low was broken after a early morning pullback that infuse the liquidity more on the supply side than demand and we saw a big red bar it is likely to come back at the area around 23000 to 22950 with minor intraday pullbacks
