Nifty levels - Jul 23, 2025Nifty support and resistance levels are valuable tools for making informed trading decisions, specifically when combined with the analysis of 5-minute timeframe candlesticks and VWAP. By closely monitoring these levels and observing the price movements within this timeframe, traders can enhance the accuracy of their entry and exit points. It is important to bear in mind that support and resistance levels are not fixed, and they can change over time as market conditions evolve.
The dashed lines on the chart indicate the reaction levels, serving as additional points of significance to consider. Furthermore, take note of the response at the levels of the High, Low, and Close values from the day prior.
We hope you find this information beneficial in your trading endeavors.
* If you found the idea appealing, kindly tap the Boost icon located below the chart. We encourage you to share your thoughts and comments regarding it.
Wishing you success in your trading activities!
NIFTY trade ideas
Nifty 20500 or 19200?Last time, I was correct when I foresaw and gave an update on the Nifty's latest peak of 25650 the day before it happened, along with the beginning of a potential downward trend. Now, if the Nifty can break below 24500, there's a good chance we'll drop below the previous low of 21700 and reach at least 20500 or even lower, at 19200, by February 2026.
#Nifty - Pivot Point is 25016.05Date:12-06-2025
#Nifty Current Price: 24950
Pivot Point: 25016.05 Support: 24711.72 Resistance: 25322.18
#Nifty Upside Targets:
Target 1: 25529.42
Target 2: 25736.65
Target 3: 26006.88
Target 4: 26277.10
#Nifty Downside Targets:
Target 1: 24503.59
Target 2: 24295.45
Target 3: 24025.225
Target 4: 23755.00

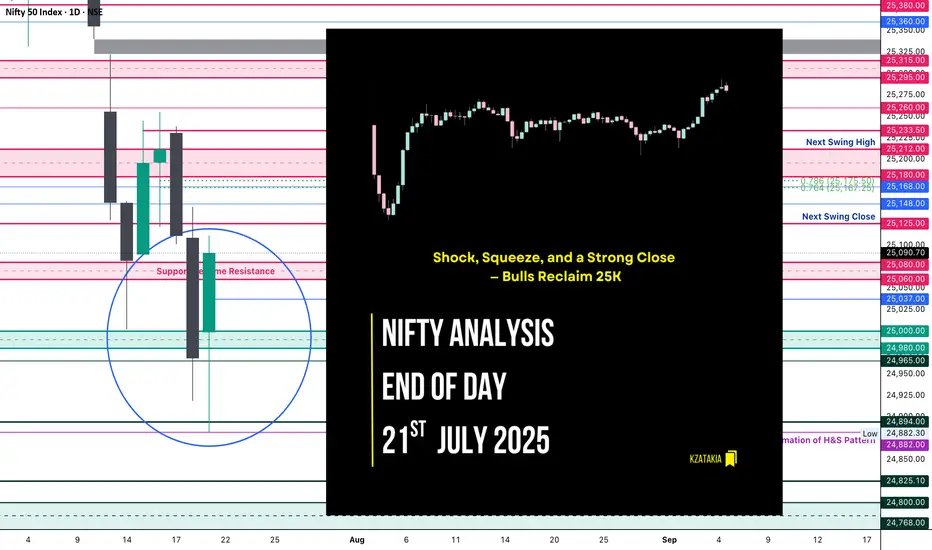
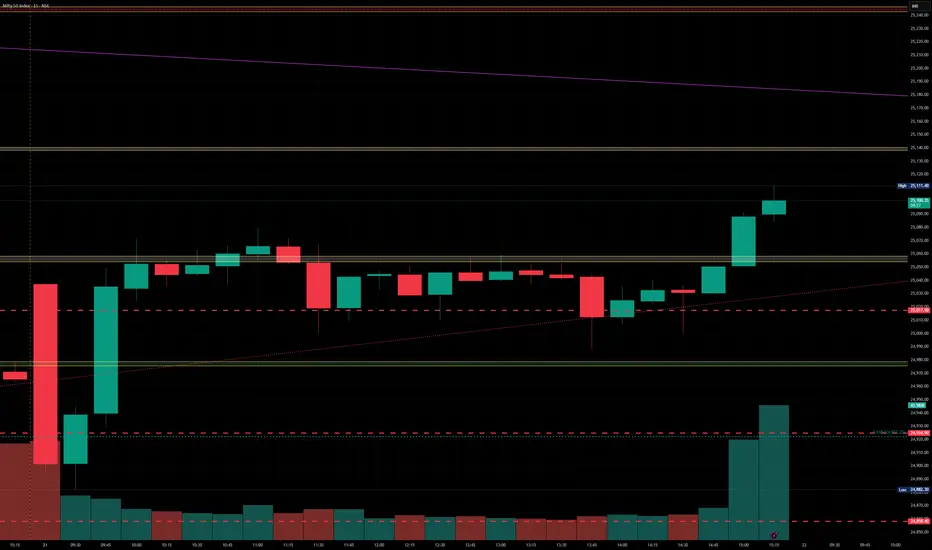
Nifty Analysis EOD – July 21, 2025 – Monday 🟢 Nifty Analysis EOD – July 21, 2025 – Monday 🔴
“Shock, Squeeze, and a Strong Close — Bulls Reclaim 25K”
Today’s move was nothing short of shocking. In the first 45 minutes, Nifty plunged more than 150 points, breaking through key levels and touching 24,882. But what followed was a V-shaped recovery that caught both Friday’s shorts and those who shorted below PDC/PDL completely off guard.
The index powered up to mark a day high of 25,080, and sustained above CPR and VWAP throughout most of the session. A final push came around 2:55 PM, breaking the intraday trendline and CDH, registering a fresh high before closing near the top at 25,090.70.
✅ Bulls not only held 25K — they dominated the battlefield all day, recovering almost everything lost during Friday’s drop.
🕯 5 Min Time Frame Chart with Intraday Levels
🕯 Daily Time Frame Chart with Intraday Levels
🕯 Daily Candle Breakdown
Open: 24,999.00
High: 25,111.40
Low: 24,882.30
Close: 25,090.70
Change: +122.30 (+0.49%)
📊 Candle Structure Breakdown
Real Body: 91.70 points → strong bullish body
Upper Wick: 20.70 points → slight hesitation near highs
Lower Wick: 116.70 points → deep intraday buying from the lows
🔍 Interpretation
Mildly negative open, followed by a sharp 150-point fall
Buyers stepped in strongly near 24,880, triggering a sharp reversal
V-shape recovery sustained above CPR & VWAP, closing near high
Close is not just above open — it’s above Friday’s close and 25K mark
🕯 Candle Type
Hammer-like Bullish Reversal Candle — Long lower wick with green body, signaling strong dip buying and possible short-term trend reversal
📌 Key Insight
Strong defense at 24,880–24,900 created the base for reversal
Close above 25,090 shifts near-term bias in favor of bulls
25,110–25,140 is the next resistance to watch
As long as we stay above 24,900, buyers hold the edge
🛡 5 Min Intraday Chart
⚔️ Gladiator Strategy Update
ATR: 186.31
IB Range: 166.8 → Wide IB
Market Structure: 🟡 Balanced
📉 Trades Triggered:
10:09 AM – Long Trade → ❌ SL Hit
📌 Support & Resistance Levels
Resistance Levels:
25,080 ~ 25,060
25,125
25,168
25,180 ~ 25,212
Support Levels:
25,037
25,000 ~ 24,980
24,965
24,894 ~ 24,882
24,825
24,800 ~ 24,768
💭 Final Thoughts
🧠 “Volatility doesn’t confuse the market — it reveals who’s in control.”Today’s V-shaped reversal erased all doubts from Friday’s fall. Buyers didn’t just defend — they counterattacked and reclaimed 25K with authority.Follow-through above 25,125 on Monday could confirm trend resumption.
✏️ Disclaimer
This is just my personal viewpoint. Always consult your financial advisor before taking any action.
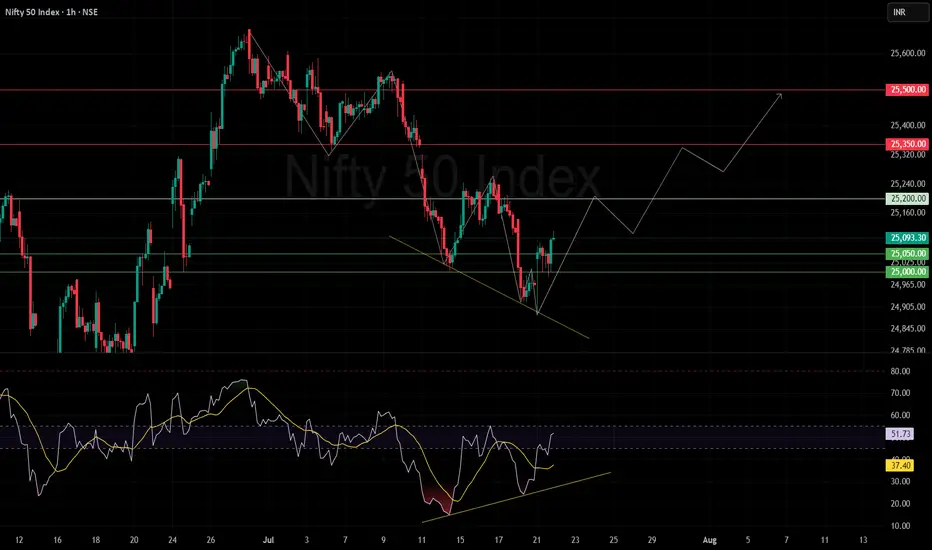
Nifty bounced with a liquidity grab.Market Action Overview
Breakdown Below 25,000: The Nifty 50 index recently dipped below the psychologically significant level of 25,000, a move that likely triggered stop-loss orders and drew out short-sellers.
Liquidity Grab: This action can be interpreted as a classic "liquidity grab," where the market briefly breaks a key support, absorbs sell-side liquidity, and shakes out weak hands before reversing direction.
Quick Rebound: Following the breakdown, the index swiftly reclaimed the 25,000 mark, signaling a strong buy-side response and potential exhaustion of selling pressure.
Recent Trend: The index recently rebounded from a downward phase, forming a lower low before bouncing from a support zone.
Support Levels: Key supports are visible at 25,000 and 25,050.
Resistance Levels: Notable overhead resistances are at 25,200, 25,350, and 25,500.
Potential Path & Projections
The indicated projection outlines a potential upward journey:
A base formation near current levels.
Possible upward move toward 25,200.
If sustained, a further rally toward the resistance levels of 25,350 and then 25,500.
The chart suggests a zig-zag correction/consolidation before each resistance break, implying healthy pullbacks amid the upward path.
Trendlines & Patterns
Falling Wedge Breakout: The downtrend appears to be capped by a descending trendline which has just been breached to the upside—a potentially bullish signal.
Short-Term Recovery: An optimistic bias is presented by the "inverted V" or "W-shaped" price action, hinting at accumulating strength.
RSI Pattern: The RSI is climbing from its recent lows and maintains an upward trendline also showing positive divergence with price, supporting a bullish outlook.
Momentum: If the RSI sustains above 50, momentum could stay positive; a move above 60 might trigger increased buying.
Key Takeaways
Short-Term Bias: Bullish, given breakout patterns and the upward RSI momentum.
Critical Levels to Watch:
Support: 25,000
Resistance: 25,200, 25,350, 25,500
Confirmation Needed: Watch for price acceptance above 25,200 for further bullish momentum. Failure to hold above 25,000 may invalidate the positive setup.
Conclusion
Indicators point to a potential short-term recovery for the Nifty 50, provided support holds and RSI maintains or extends its upward trajectory. Resistance breakouts above 25,200 could open the door to higher targets, but as always, traders should monitor for reversals near mapped resistance zones.
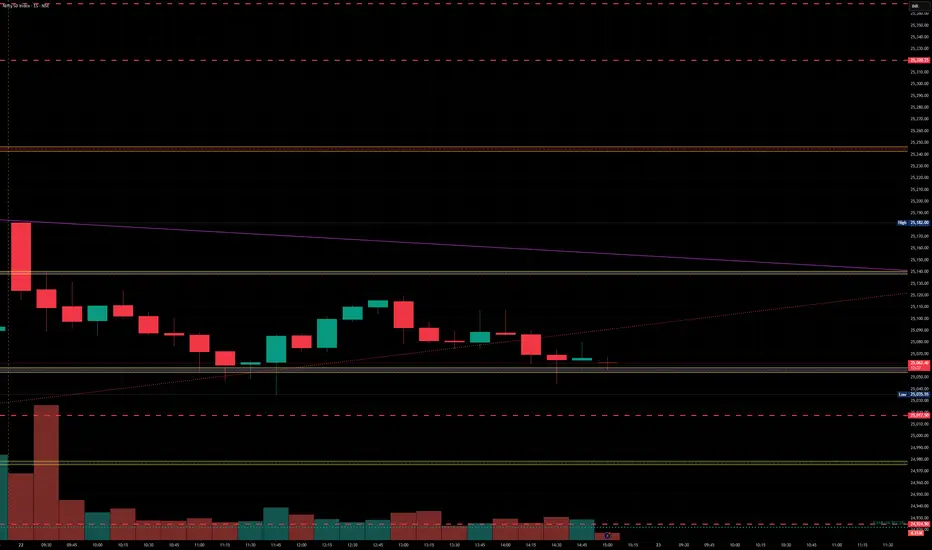
Nifty levels - Jul 22, 2025Nifty support and resistance levels are valuable tools for making informed trading decisions, specifically when combined with the analysis of 5-minute timeframe candlesticks and VWAP. By closely monitoring these levels and observing the price movements within this timeframe, traders can enhance the accuracy of their entry and exit points. It is important to bear in mind that support and resistance levels are not fixed, and they can change over time as market conditions evolve.
The dashed lines on the chart indicate the reaction levels, serving as additional points of significance to consider. Furthermore, take note of the response at the levels of the High, Low, and Close values from the day prior.
We hope you find this information beneficial in your trading endeavors.
* If you found the idea appealing, kindly tap the Boost icon located below the chart. We encourage you to share your thoughts and comments regarding it.
Wishing you success in your trading activities!
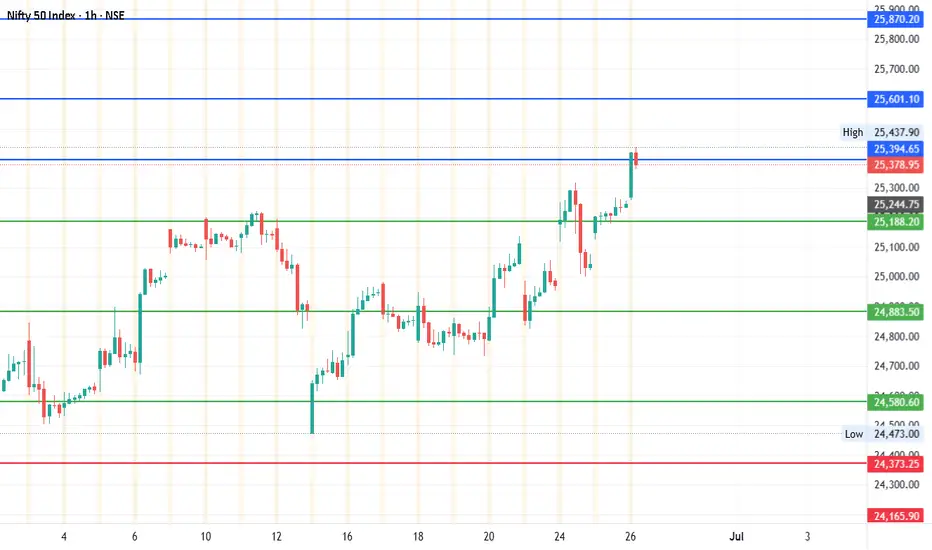
#NIFTY - 640 pts done. What Next?May 29
Date: 29-05-2025
#NIFTY - Pivot Point is 24883.50
#NIFTY Current Price: 24755 (As on 29th May 2025 post is still valid). We also have other pivot points, and the target levels are pointing to the much higher. Both the pivots are valid.
Every pivot point will have a different target level.
Upside Target 1: 25394.66 is hit and continue to watch these levels.
Upside Targets: 25394.66, 25601.10, 25870.20 and 26139.30
Downside Targets: 24373.24, 24165.90, 23896.80 and 23627.70
Support: 24580.58
Resistance: 25188.21
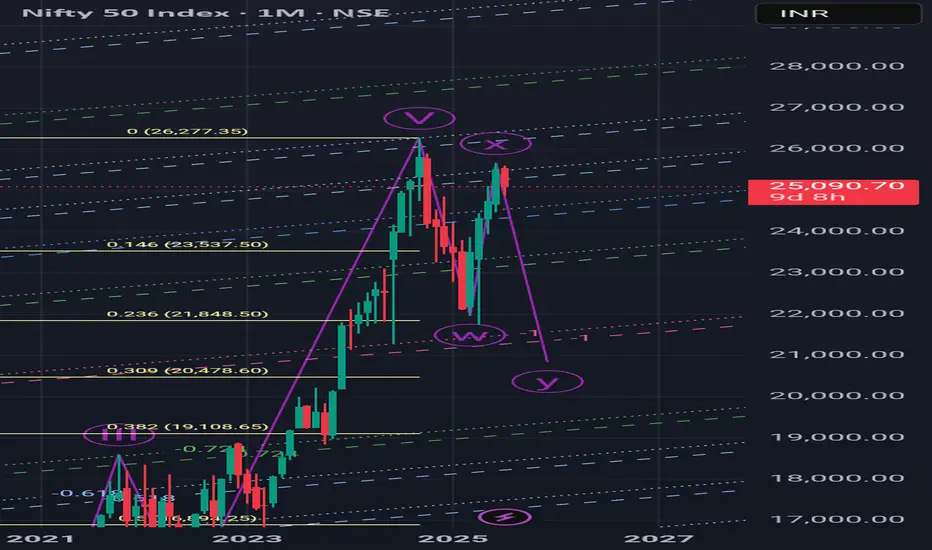
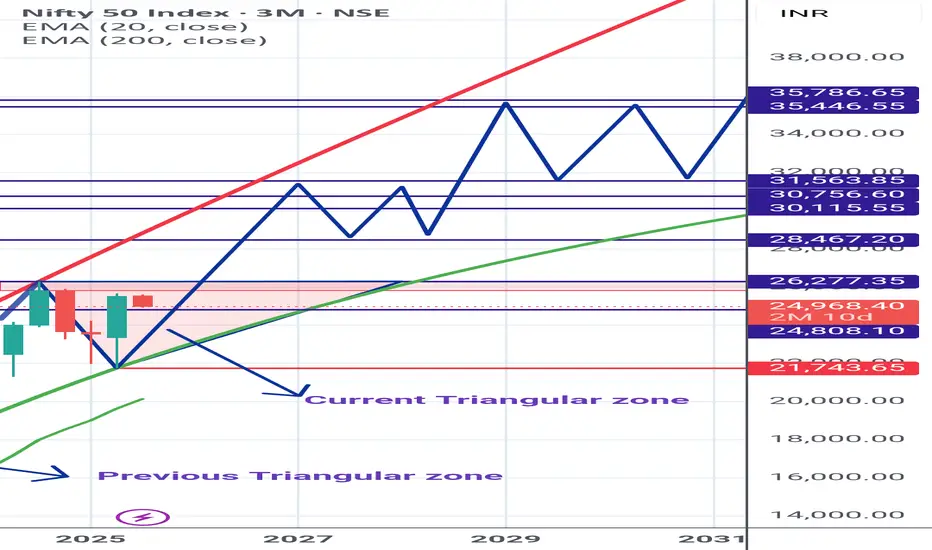
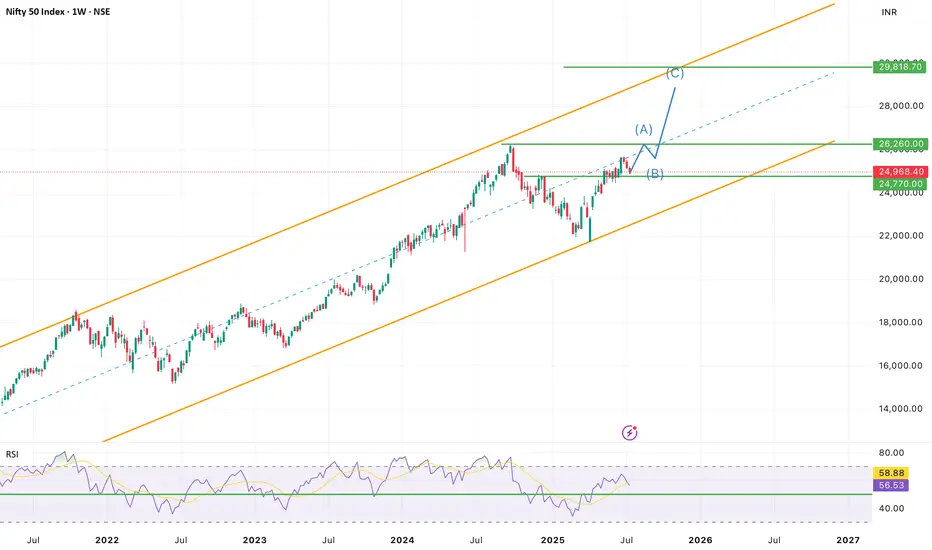
Nifty Spot Longterm View*Nifty Spot* Chart for members Reference.
Currently trading in Parabolic trend and inside Triangular zone.
Shared *My Study* based on chart pattern.
Kindly do your analysis from your side too.
Technical Analysis: NIFTY50 (Closing: ₹24,968.40 on 18-Jul-2025)*Analysis as of 21-Jul-2025 (Monday)*
1. Candlestick Patterns
Daily: A bearish engulfing pattern formed on 18-Jul-2025, closing below the prior candle’s low. Signals short-term reversal risk.
Weekly: Doji formation (indecision) near all-time highs. Weekly close below ₹25,000 warns of exhaustion.
Intraday (4H): Bearish pin bars at ₹25,100 resistance. Watch for follow-through selling below ₹24,900.
2. Harmonic Patterns
Daily: Potential Bearish Bat pattern in development:
XA: ₹23,200 → ₹25,200 (100%)
B: 61.8% retracement at ₹24,400 (pending)
Confirmation below ₹24,400 targets ₹23,800 (0.886XA).
3. Elliott Wave Theory
Weekly: Final waves of Wave 5 (impulse) likely complete at ₹25,200.
Daily: Starting ABC corrective wave:
Wave A: ₹25,200 → ₹24,800 (if breaks ₹24,900)
Wave B: Rally to ₹25,000–25,100 (short opportunity)
Wave C: Target ₹24,300 (1.618xA).
Intraday (1H): Minute wave iii down in progress below ₹24,950.
4. Wyckoff Theory
Phase: Potential distribution near highs:
Upthrust (18-Jul high ₹25,120) failed to hold.
Spring Level: ₹24,900. Break confirms downtrend (test supply).
Downside target: ₹24,500 (fall after distribution).
5. W.D. Gann Analysis
Square of 9:
Key support: √24,968 ≈ 158.0 → 158² = 24,964 (critical pivot).
Close below 24,964 opens ₹24,650 (next square).
Time Cycles:
21-Jul is 180° from 21-Jan 2025 high. Watch for trend change.
Gann Angle: 1x1 angle from Jul-2025 high at ₹25,200 → breaks below imply ₹400/day decline.
6. Ichimoku Kinko Hyo (Daily)
Tenkan: ₹24,950 (resistance)
Kijun: ₹24,800 (support)
Cloud: Lagging span below price; cloud thinning (bearish momentum).
Signal: Price below Kijun → trend weakness.
7. Key Indicators
RSI (Daily): 62 → declining from overbought (70). Bearish divergence.
Bollinger Bands (4H): Price testing lower band (₹24,900). Break targets ₹24,600 (2σ lower).
VWAP (1H): ₹25,050 → intraday resistance.
Moving Averages:
Death Cross (50-DMA/200-DMA): Not triggered, but 5-DMA (₹25,020) crossed below 20-DMA (₹25,050).
Timeframe Summary
Timeframe Key Levels Bias Pattern/Thesis
5M/15M Res: ₹24,990 Bearish Scalp shorts below VWAP (₹25,050)
30M/1H Res: ₹25,050 Sup: ₹24,900 Bearish Bearish EW wave iii; RSI < 50
4H Res: ₹25,100 Sup: ₹24,800 Neutral Break below ₹24,800 confirms Wyckoff distribution
Daily Res: ₹25,200 Sup: ₹24,400 Bearish Bearish Bat + ABC correction
Weekly Res: ₹25,500 Sup: ₹24,000 Neutral Doji warns of reversal; hold ₹24,400 key
Actionable Outlook
Intraday (21-Jul):
Short below ₹24,900 (SL: ₹25,050) → Target ₹24,800.
Break below ₹24,800 extends to ₹24,650.
Swing (1–2 Weeks):
Sell rallies near ₹25,100 (SL: ₹25,250) → Target ₹24,400.
Weekly close > ₹25,200 invalidates bearish view.
Critical Supports: ₹24,800 (Wyckoff spring) → ₹24,400 (Harmonic/EW target) → ₹24,000 (psychological).
Key Resistances: ₹25,050 (VWAP) → ₹25,200 (ATH) → ₹25,500 (Gann square).
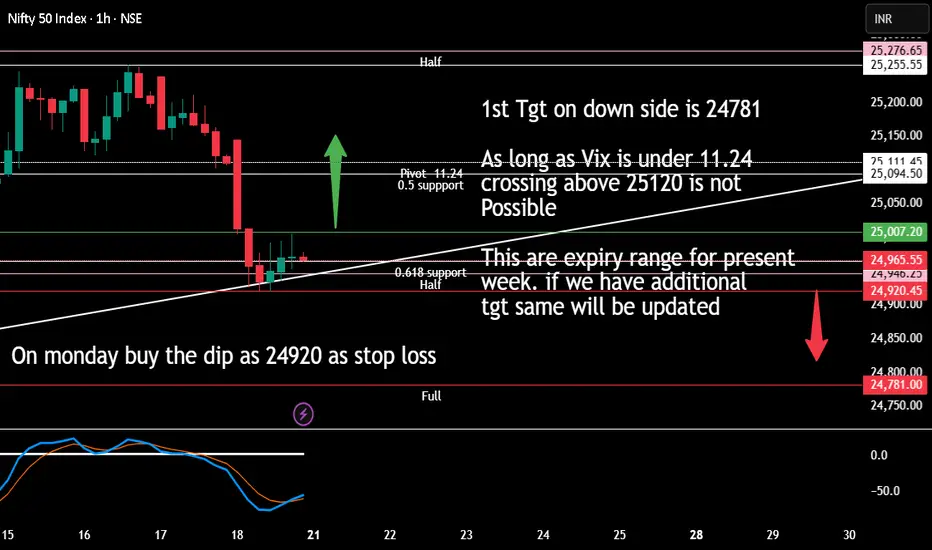
Monday till thursday expiry rangeAs long as vix value is under 11.24 crossing pivot and going on top is not possible as per my mathematical range calculation (accuracy is 80%).
If it is near 25111 level on Thursday (and ind vix is less than 11.24) a very good time to make handsome money as market will touch 24946.27 level (probability s 80%)
For Monday we should follow buy the dip as long 24920 is intact.
Breaching 24920 market will show 24800-24781 as first target. If 30 min candle stays below this level (24780) then next tgt will be open. Will keep you posted if anything changes.
Caution: I am not SEBI registered it is my mathematical analysis and it is not buy or sell recommendation
Nifty July 4th Week Analysis Nifty trend is looking unclear and closing is certainly not in favor of bulls, downside would be open upto 24700 if nifty breaches important support of 24900-830. To resume its upside momentum nifty must cross and sustain above 25150-200.
All levels are marked in the chart posted.
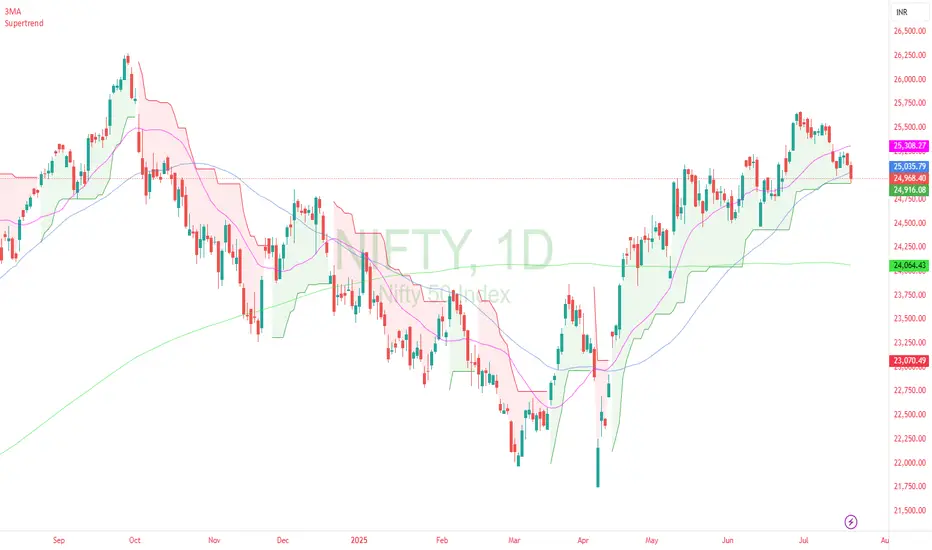
nifty dailyThis is great chart . Price is at Supertrend support on daily chart. Lowest risk in going long. Best technical chart in while .
NIFTY - NEW HIGH SOON...NSE:NIFTY Weekly chart showing negative closing from last three weeks, but undertone of the market showing something big to come on price. Rsi giving positive divergence on intraday timeframes.
nifty 50 on strong momentumgood momentum seen over nifty , also on good support minor bounce can convert in to a good reversal which can lead it to supply zone or above.
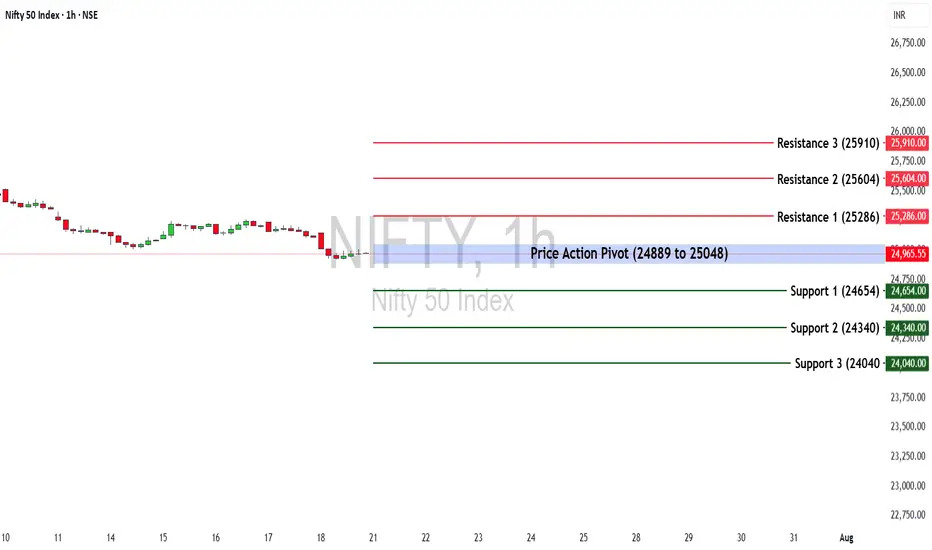
Nifty 50 at a Turning Point? Key Levels & Market Outlook AheadThe Nifty 50 ended the week at 25,149.85, posting a loss of -1.22%.
🔹 Key Levels for the Upcoming Week
📌 Price Action Pivot Zone:
24,889 to 25,048 – This is a crucial range to monitor for potential trend reversals or continuation. A breakout or breakdown from this zone can set the tone for the week.
🔻 Support Levels:
S1: 24,654
S2: 24,340
S3: 24,040
🔺 Resistance Levels:
R1: 25,286
R2: 25,604
R3: 25,910
📈 Market Outlook
✅ Bullish Scenario:
A sustained move above 25,048 (top of the pivot zone) may invite buying interest. If momentum continues, the index could test R1 (25,286) and possibly extend towards R2 (25,604) and R3 (25,910).
❌ Bearish Scenario:
Failure to hold the pivot zone and a breakdown below 24,889 could trigger further downside. The index may slide towards S1 (24,654) and deeper supports at S2 (24,340) and S3 (24,040).
Disclaimer: lnkd.in
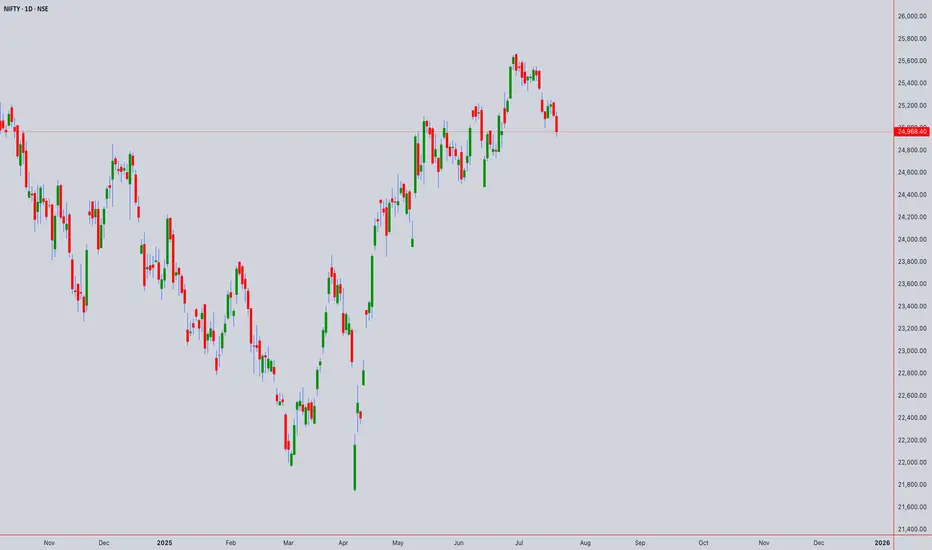
Nifty Closes Below 25,000 — What Lies Ahead?The Indian market's recent uptrend appears to be losing momentum, as the benchmark Nifty index extended its decline for the third consecutive week, ending just below the important 25,000 mark.
This pullback has been largely driven by weakness in the Financial and IT sectors, with major players like NSE:TCS , NSE:HCLTECH , and NSE:AXISBANK posting disappointing earnings.
From a technical perspective, the index is now approaching a key support zone near 24,900. A decisive break below this level could open the door for a further slide towards 24,500.
Open Interest (OI) data reinforces this view, with the 25,000–24,900 zone seeing the highest put writing, marking it as an immediate support area. On the upside, strong call writing at 25,100 and 25,200 on Friday suggests these levels will act as immediate resistance.
Given the current structure, the outlook for the coming week remains neutral to bearish.
Traders are advised to stay cautious, manage risk effectively, and keep a close watch on these crucial levels.
nifty support levelSupport is the level at which demand is strong enough to stop the index from falling any further
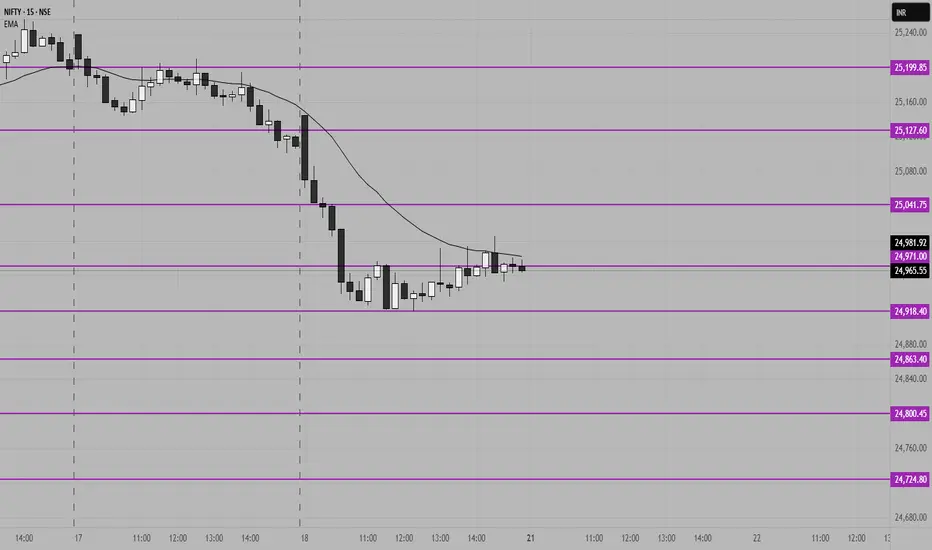
Nifty key Support and resistance levels for 21st July 2025NIFTY Key Support & Resistance for July 21st
Chart Overview:
NIFTY might consolidate after a sharp fall, currently trading around the 24,918–24,965 zone on the 15-minute chart. The price is hovering below the EMA, indicating weak momentum and hesitation in recovery.
Key Levels:
Major Resistance:
25,200 – Strong resistance zone; multiple rejections expected if tested. Watch for possible reversals or fake breakouts near this level.
Other Resistances:
* 25,127
* 25,041
Immediate Supports:
* 24,918
* 24,863
* 24,724
Outlook for July 21st:
* Failure to sustain above 24,970 could invite fresh selling toward 24,724.
* Range-bound action likely between 25,041 and 24,863 unless a strong breakout occurs.
---
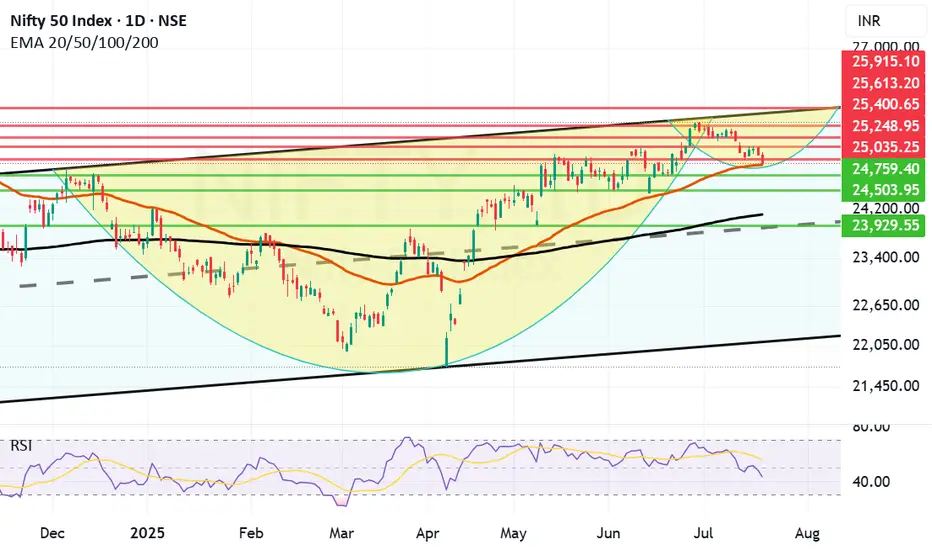
Can Reliance and Banks turn Nifty around? do or die Monday. Nifty as of now has taken support at Mother line in daily chart. As expected in my Yesterday's message. So Hopefully if Big Banks Results are in line tomorrow we might see Nifty going upwards from Monday.
Mota Bhai just announced the results. EBITDA is slightly less than expected but Net Profit and Revenue is much better than Market expectation. In my view market should react positively to this result.
Supports For Nifty remain at 24932 (Mother line), 24759, 24503. As indicated earlier if we get a closing below 24503 we may see a Fall towards 24106 or 23929 (In unlikely circumstances).
Nifty Resistances remain at: 25035, 25248, 25400 and 25613 (Channel top Resistance).
Results for tomorrow
HDFC BANK
ICICIBANK
AUSMALL BANK
RBL BANK
UNION BANK
YES BANK
CENTR BANK
PUNJA BANK
CENTR BANK
So it seems like a Do or Die Monday on cards. Shadow of the candle looks neutral as of now.
Disclaimer: The above information is provided for educational purpose, analysis and paper trading only. Please don't treat this as a buy or sell recommendation for the stock or index. The Techno-Funda analysis is based on data that is more than 3 months old. Supports and Resistances are determined by historic past peaks and Valley in the chart. Many other indicators and patterns like EMA, RSI, MACD, Volumes, Fibonacci, parallel channel etc. use historic data which is 3 months or older cyclical points. There is no guarantee they will work in future as markets are highly volatile and swings in prices are also due to macro and micro factors based on actions taken by the company as well as region and global events. Equity investment is subject to risks. I or my clients or family members might have positions in the stocks that we mention in our educational posts. We will not be responsible for any Profit or loss that may occur due to any financial decision taken based on any data provided in this message. Do consult your investment advisor before taking any financial decisions. Stop losses should be an important part of any investment in equity.
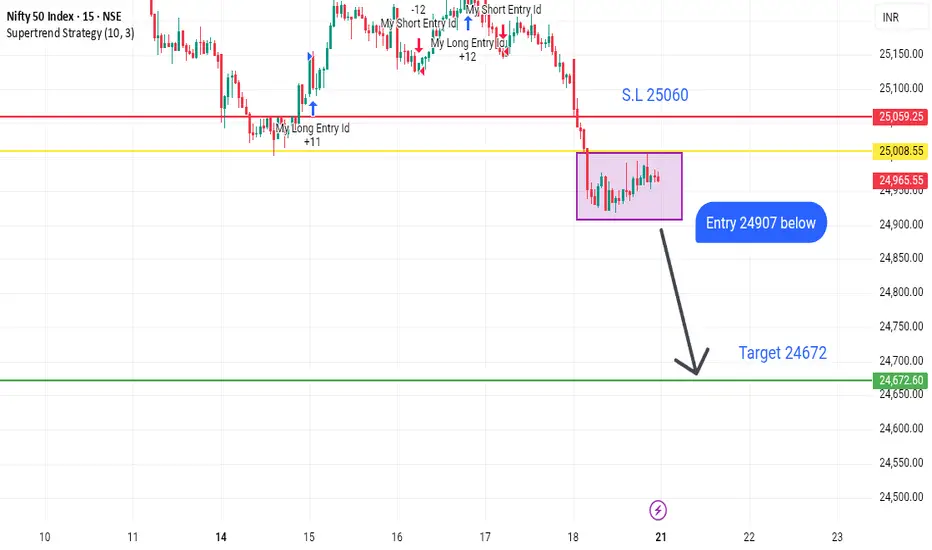
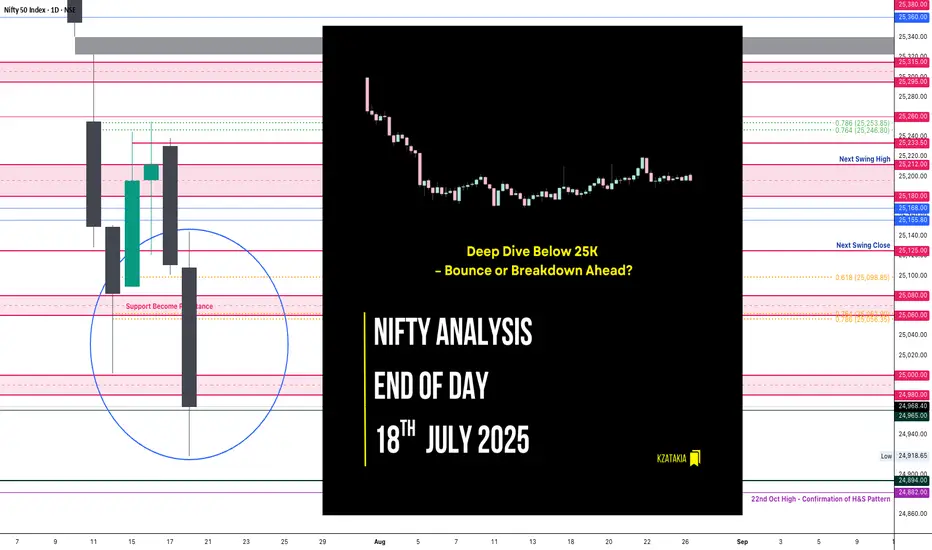
Nifty Analysis EOD – July 18, 2025 – Friday🟢 Nifty Analysis EOD – July 18, 2025 – Friday 🔴
“Deep Dive Below 25K – Bounce or Breakdown Ahead?”
As we discussed yesterday, a big move was on the cards — and Nifty delivered.
The index started flat to negative, and from the opening tick, sellers took firm control. It sharply broke through multiple key supports: PDC, PDL, S1, the important 25,080–25,060 support zone, swing low, 25,000–24,980, and even 24,965.
Buyers finally showed up near 24,920, a crucial level, and pulled off a modest 86-point recovery. The session ended at 24,968.40, still below the psychological 25,000 mark and the fractal swing low of July 14.
🕯 5 Min Time Frame Chart with Intraday Levels
🔍 Mixed Signals:
✅ Positive: Today’s low aligns with the 0.618 Fib retracement from the June 13 low to June 30 high — potential support zone.
✅ Positive: RSI(3 of 3) shows bullish divergence — early reversal sign?
❌ Negative: Closed below July 14 swing low — weak structural signal.
❌ Negative: Below 25,000 — psychological breakdown.
❓Now the big question: Will this bearish move continue, or is it a fakeout before reversal?
You're still bullish on the overall daily trend, but tactically bearish for intraday until a close above 25,125 confirms strength.
🕯 Daily Time Frame Chart For Additional View
🕯 Daily Time Frame Chart with Intraday Levels
🕯 Daily Candle Breakdown
Open: 25,108.55
High: 25,144.60
Low: 24,918.65
Close: 24,968.40
Change: −143.05 (−0.57%)
📊 Candle Structure Breakdown
Real Body: 140.15 pts → Large red bearish body
Upper Wick: 36.05 pts → rejection near early highs
Lower Wick: 49.75 pts → dip buying near 24,920
🔍 Interpretation
Mildly negative open with early strength attempt near 25,140
Sharp decline through major support zones
Buyers stepped in at 24,920, but recovery lacked follow-through
Close below 25K and key swing low confirms steady intraday selling pressure
🕯 Candle Type
Strong Bearish Candle with both wicks — sellers dominated, but not without some resistance from buyers at the lows.
📌 Key Insight
Short-term bearish momentum confirmed
24,920–24,890 is next critical support; breakdown may extend to 24,882–24,825
Bulls need to close above 25,125+ to reclaim control
🛡 5 Min Intraday Chart
⚔️ Gladiator Strategy Update
ATR: 181.56
IB Range: 126.45 → Medium IB
Market Structure: 🔴 Imbalanced
🟢 Trades Triggered:
09:42 AM – Short Trade → ✅ Trailed SL Hit Profit (R:R = 1 : 3.87)
📌 Support & Resistance Levels
Resistance Levels:
24,980 ~ 25,000
25,080 ~ 25,060
25,125
25,168
25,180 ~ 25,212
Support Levels:
24,965
24,894 ~ 24,882
24,825
24,800 ~ 24,768
💭 Final Thoughts
“Sometimes markets fall not to reverse, but to recharge.”
Today’s drop pierced major support zones, but the bounce from 0.618 Fib hints at possible resilience.
Structure needs clarity — Monday’s session will reveal whether this was a trap or fuel for bears.
✏️ Disclaimer
This is just my personal viewpoint. Always consult your financial advisor before taking any action.
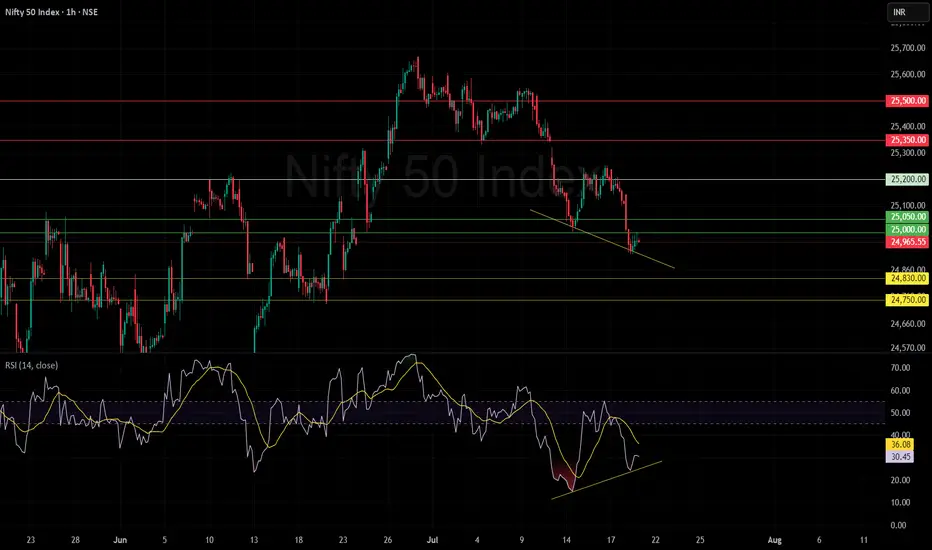
Nifty in an important/cautious zoneNIFTY 50
25,000 is the Consensus Key Level:
Most market participants are watching 25,000 as a critical psychological and technical zone. Sustaining above this keeps the market in a neutral range; a strong close above 25,200 is required for any momentum shift toward 25,350 and 25,500.
Bearish Liquidity Trap Likely:
Due to widespread focus on 25,000, a brief dip below it for 1–2 days wouldn't be surprising—this would trigger stop-losses, sweep liquidity, and potentially set up a sharp reversal if key supports like 24,830 hold.
Immediate Support and Downside Risk:
If the index sustains below 25,000, watch 24,830 first, then 24,750 and 24,500 as possible downside levels. Failure to defend these could extend the correction, but oversold RSI and positive divergence are early signals for a relief bounce.
Momentum Indicators:
RSI is near oversold (30.45) and forming bullish divergence versus price—lower lows in price but higher lows in RSI—signaling selling exhaustion and bounce potential.
Action Plan:
Stay cautious on initial dips below 25,000; this area can act as a bear trap.
Look for confirmed reversal signals (strong bullish candles, RSI upturn) especially if the price swiftly reclaims 25,000+ after liquidity grabs.
Sustained close above 25,200 = bullish setup for 25,350/25,500 targets.
Sustained trade below 24,830 signals further weakness.
Summary:
NIFTY 50 is at a make-or-break level around 25,000. Expect possible stop-loss sweeps below this area, but also be prepared for a sharp reversal if key supports and positive divergences play out. Confirmation above 25,200 flips the bias bullish; below 24,830, further slide likely
NIFTY S/R for 21/7/25Support and Resistance Levels:
Support Levels: These are price points (green line/shade) where a downward trend may be halted due to a concentration of buying interest. Imagine them as a safety net where buyers step in, preventing further decline.
Resistance Levels: Conversely, resistance levels (red line/shade) are where upward trends might stall due to increased selling interest. They act like a ceiling where sellers come in to push prices down.
Breakouts:
Bullish Breakout: When the price moves above resistance, it often indicates strong buying interest and the potential for a continued uptrend. Traders may view this as a signal to buy or hold.
Bearish Breakout: When the price falls below support, it can signal strong selling interest and the potential for a continued downtrend. Traders might see this as a cue to sell or avoid buying.
MA Ribbon (EMA 20, EMA 50, EMA 100, EMA 200) :
Above EMA: If the stock price is above the EMA, it suggests a potential uptrend or bullish momentum.
Below EMA: If the stock price is below the EMA, it indicates a potential downtrend or bearish momentum.
Trendline: A trendline is a straight line drawn on a chart to represent the general direction of a data point set.
Uptrend Line: Drawn by connecting the lows in an upward trend. Indicates that the price is moving higher over time. Acts as a support level, where prices tend to bounce upward.
Downtrend Line: Drawn by connecting the highs in a downward trend. Indicates that the price is moving lower over time. It acts as a resistance level, where prices tend to drop.
Disclaimer:
I am not a SEBI registered. The information provided here is for learning purposes only and should not be interpreted as financial advice. Consider the broader market context and consult with a qualified financial advisor before making investment decisions.
